
Analysis for the last few days has expected to see a consolidation.
Price is moving sideways and is range bound. Volume is declining. This is exactly what was expected.
Summary: This bounce is either another second wave correction or a fourth wave correction, and it should continue for a further four (more likely) or nine (less likely) trading sessions. If price moves higher from here, then look for resistance at the downwards sloping cyan trend line on the daily charts.
To see how each of the bull and bear wave counts fit within a larger time frame see the Grand Supercycle Analysis.
To see detail of the bull market from 2009 to the all time high on weekly charts, click here.
Last published monthly charts can be seen here.
If I was asked to pick a winner (which I am reluctant to do) I would say the bear wave count has a higher probability. It is better supported by regular technical analysis at the monthly chart level, it fits the Grand Supercycle analysis better, and it has overall the “right look”.
New updates to this analysis are in bold.
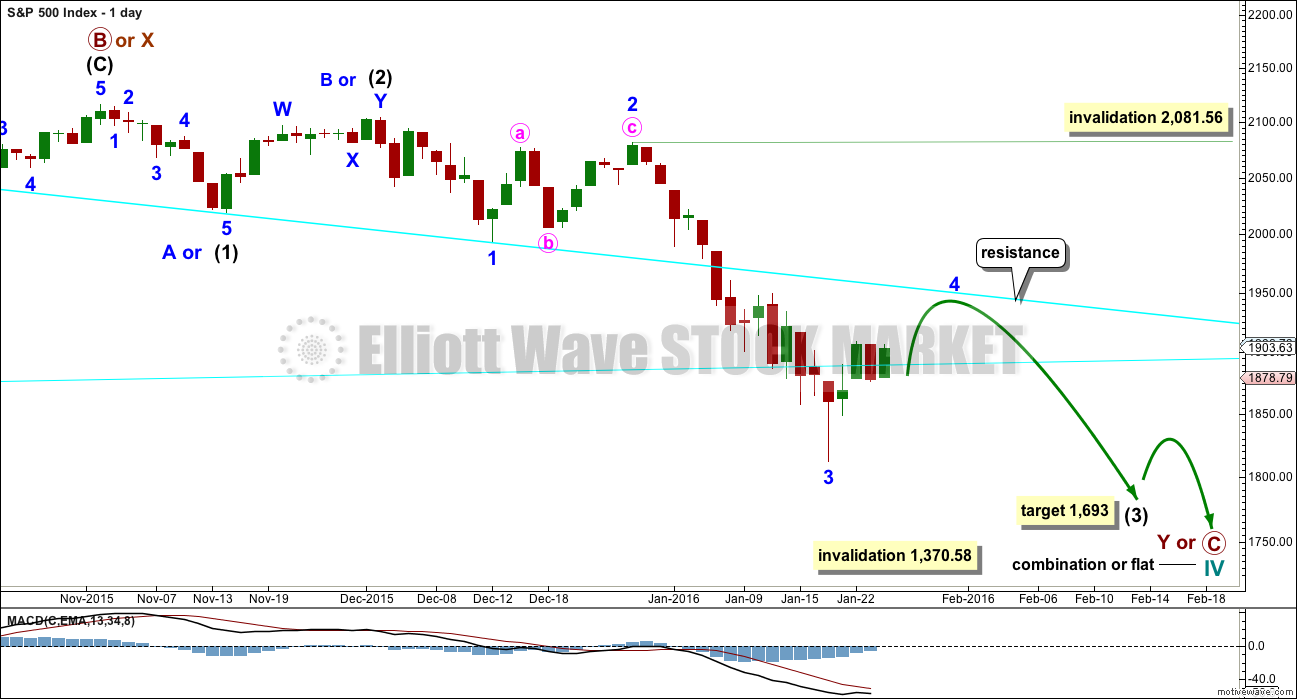
BULL ELLIOTT WAVE COUNT
DAILY CHART – COMBINATION OR FLAT
Click chart to enlarge.
This wave count is bullish at Super Cycle degree.
Cycle wave IV may not move into cycle wave I price territory below 1,370.58. If this bull wave count is invalidated by downwards movement, then the bear wave count shall be fully confirmed.
Cycle wave II was a shallow 0.41 zigzag lasting three months. Cycle wave IV should exhibit alternation in structure and maybe also alternation in depth. Cycle wave IV may be a flat, or combination.
Cycle wave IV may end within the price range of the fourth wave of one lesser degree. Because of the good Fibonacci ratio for primary wave 3 and the perfect subdivisions within it, I am confident that primary wave 4 has its range from 1,730 to 1,647.
Primary wave C should subdivide as a five and primary wave Y should begin with a zigzag downwards. This downwards movement is either intermediate waves (1)-(2)-(3) of an impulse for primary wave C or minor waves A-B-C of a zigzag for intermediate wave (A). Both these ideas need to see a five down complete towards the target, so at this stage there is no divergence in expectations regarding targets or direction. When and if these two ideas diverge, I will separate them out into two separate charts. For now I will keep the number of charts to a minimum.
Primary wave A or W lasted three months. Primary wave C or Y may be expected to also last about three months. It is now in its second month at this stage and may not be able to complete in just one more. It may be longer in duration, perhaps a Fibonacci five months. That would still give a combination the right look at higher time frames.
Within the new downwards wave of primary wave C or Y, a first and second wave, or A and B wave, is now complete. Intermediate wave (2) or minor wave B lasted a Fibonacci 13 days exactly. At 1,693 intermediate wave (3) would reach 4.236 the length of intermediate wave (1).
This daily chart and the hourly chart below both label minor wave 3 as complete. It is also possible that the degree of labelling within minor wave 3 could be moved down one degree, because only minute wave i within it may be complete. The invalidation point reflects this. No second wave correction may move beyond its start above 2,081.56 within minor wave 3. If this bounce is minor wave 4, then it may not move into minor wave 1 price territory above 1,993.26.
Price broke through support at the cyan trend line which is drawn from the August lows to September lows. This line is no longer providing resistance. The next line to offer resistance may be the downwards sloping cyan line.
HOURLY CHART
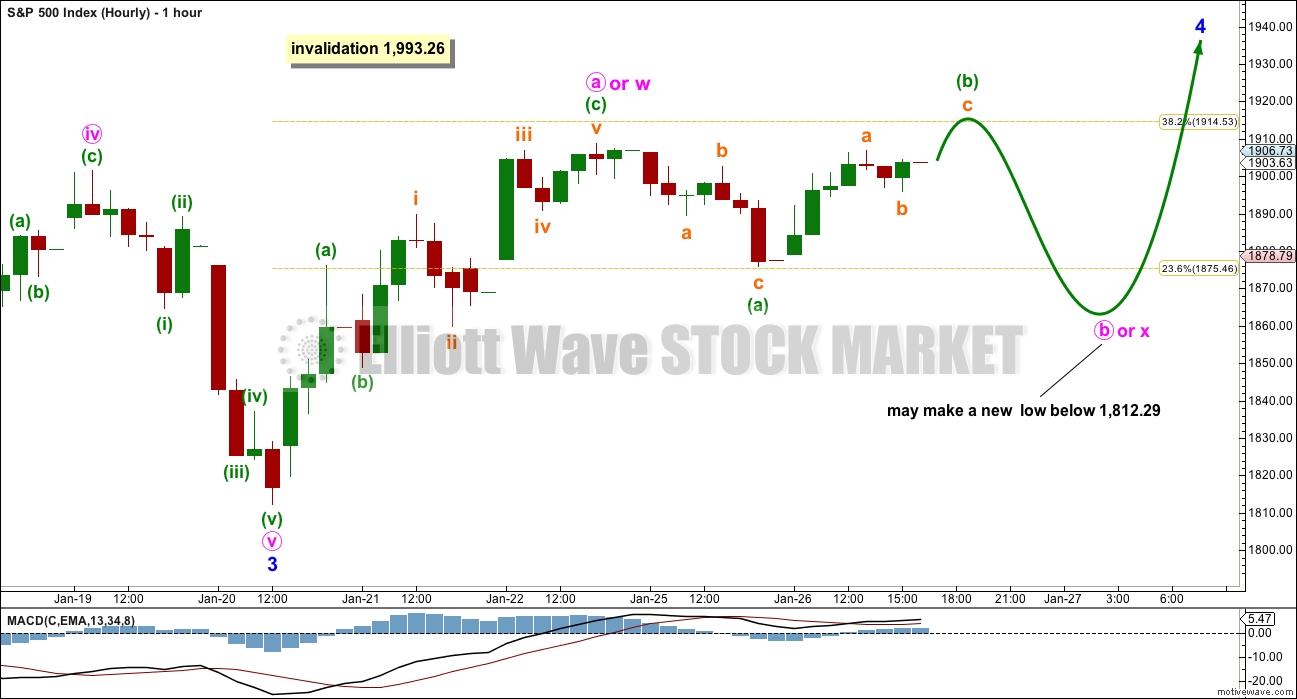
Click chart to enlarge.
At this stage, the bull and bear wave counts are essentially the same at the hourly chart level. Commentary will be with the bear wave count.
BEAR ELLIOTT WAVE COUNT
DAILY CHART
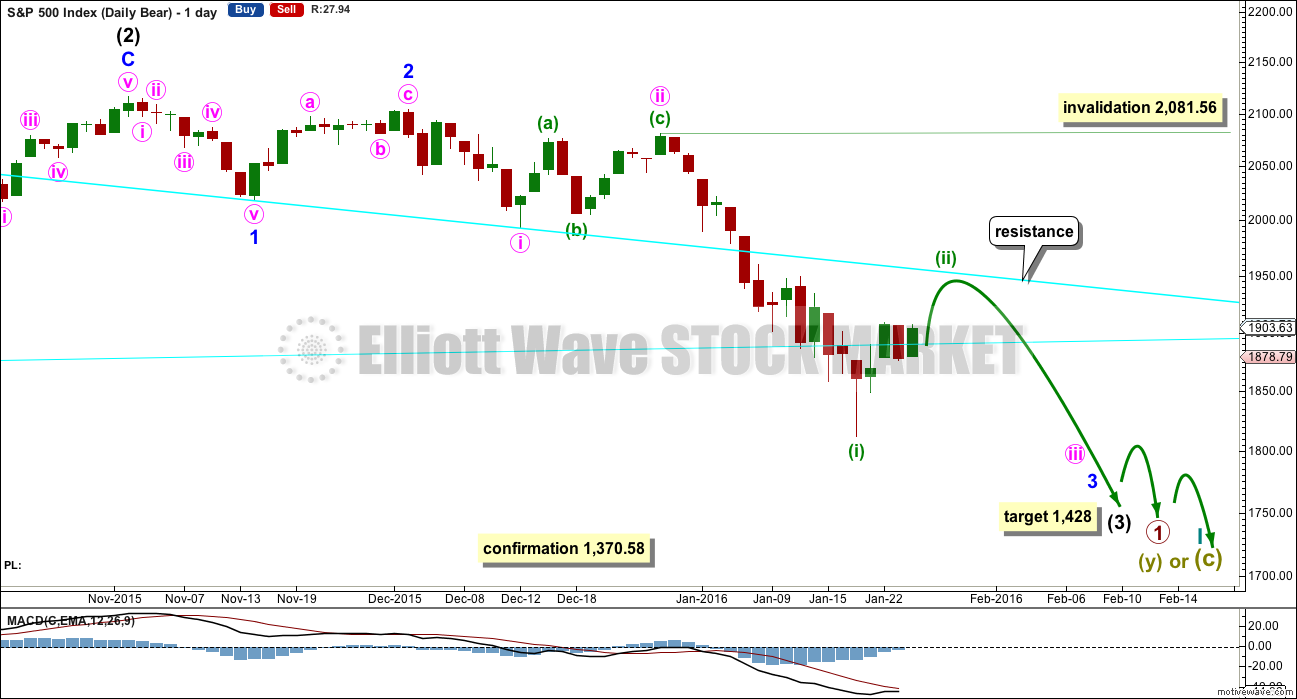
Click chart to enlarge.
This bear wave count fits better than the bull with the even larger picture, super cycle analysis found here. It is also well supported by regular technical analysis at the monthly chart level.
Importantly, there is no lower invalidation point for this wave count. That means there is no lower limit to this bear market.
Downwards movement so far within January still looks like a third wave. This third wave for intermediate wave (3) still has a long way to go. It has to move far enough below the price territory of intermediate wave (1), which has its extreme at 1,867.01, to allow room for a following fourth wave correction to unfold which must remain below intermediate wave (1) price territory.
Intermediate wave (1) subdivides as a five wave structure with a slightly truncated fifth wave.
Ratios within intermediate wave (1) are: minor wave 3 is 7.13 points short of 6.854 the length of minor wave 1, and minor wave 5 is just 2.82 points longer than 0.618 the length of minor wave 3. These excellent Fibonacci ratios add some support to this wave count.
Intermediate wave (2) was a very deep 0.93 zigzag. Because intermediate wave (2) was so deep the best Fibonacci ratio to apply for the target of intermediate wave (3) is 2.618 which gives a target at 1,428. If intermediate wave (3) ends below this target, then the degree of labelling within this downwards movement may be moved up one degree; this may be primary wave 3 now unfolding and in its early stages.
I have two scenarios for the correction which began two days ago. It may be either a second wave or a fourth wave. Looking at how far down intermediate wave (3) still needs to go on the weekly chart, I would favour the second wave scenario. That will be the main hourly wave count for that reason.
HOURLY CHART
Click chart to enlarge.
If this correction is a second wave, then it would most likely be a single or double zigzag. Because the first wave up subdivides best as a three, a zigzzag, then minuette wave (ii) may be unfolding as a double zigzag.
Double zigzags normally have relatively shallow X waves that do not make new price extremes beyond the start of the first zigzag labelled here subminuette wave w. Subminuette wave x may now be a complete shallow zigzag. Subminuette wave y may have begun.
Minuette wave (ii) may end about the 0.618 Fibonacci ratio at 1,979.
Double zigzags normally have a clear slope against the prior trend. The second zigzag in the double exists to deepen the correction when the first zigzag did not move price deep enough. With the first zigzag ending only at the 0.382 Fibonacci ratio the definition of not deep enough is met.
Minuette wave (ii) may not move beyond the start of minuette wave (i) above 2,081.56.
Although minuette wave (ii) is labelled here as an incomplete double zigzag, that is not how it must unfold. This chart outlines only one possibility amongst several that still exist. It is still impossible to tell with certainty what structure will unfold for this correction.
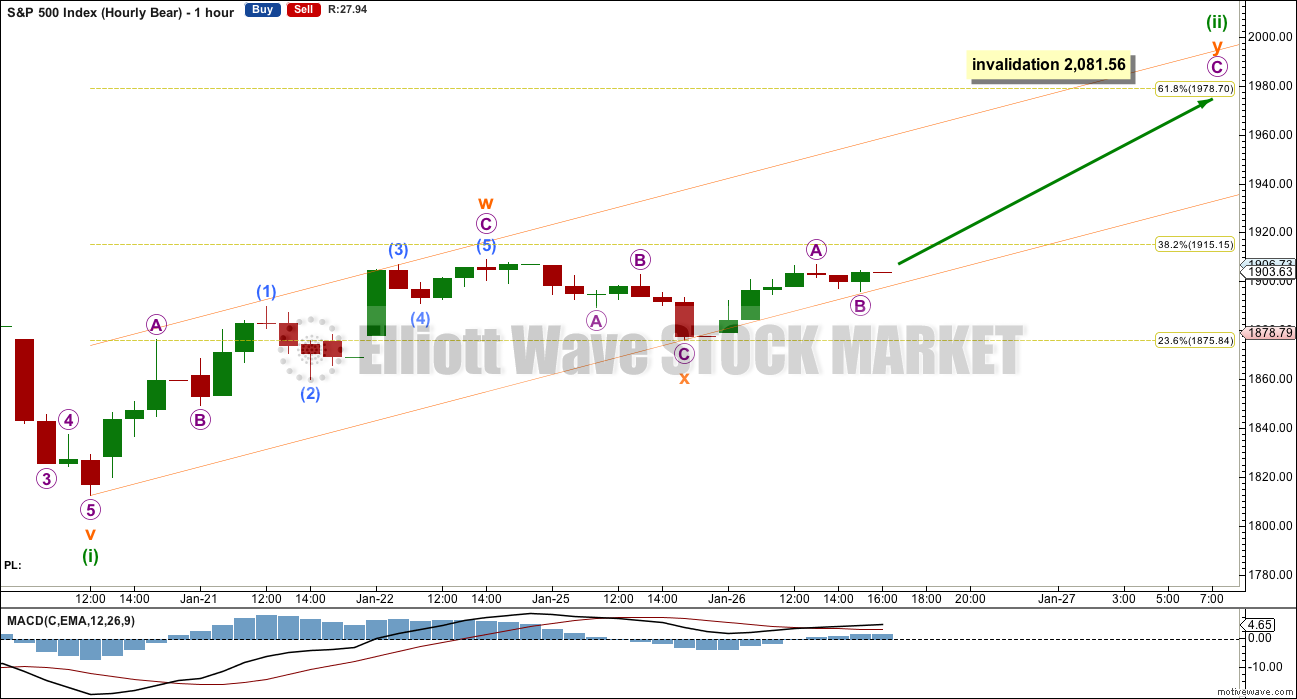
ALTERNATE HOURLY CHART
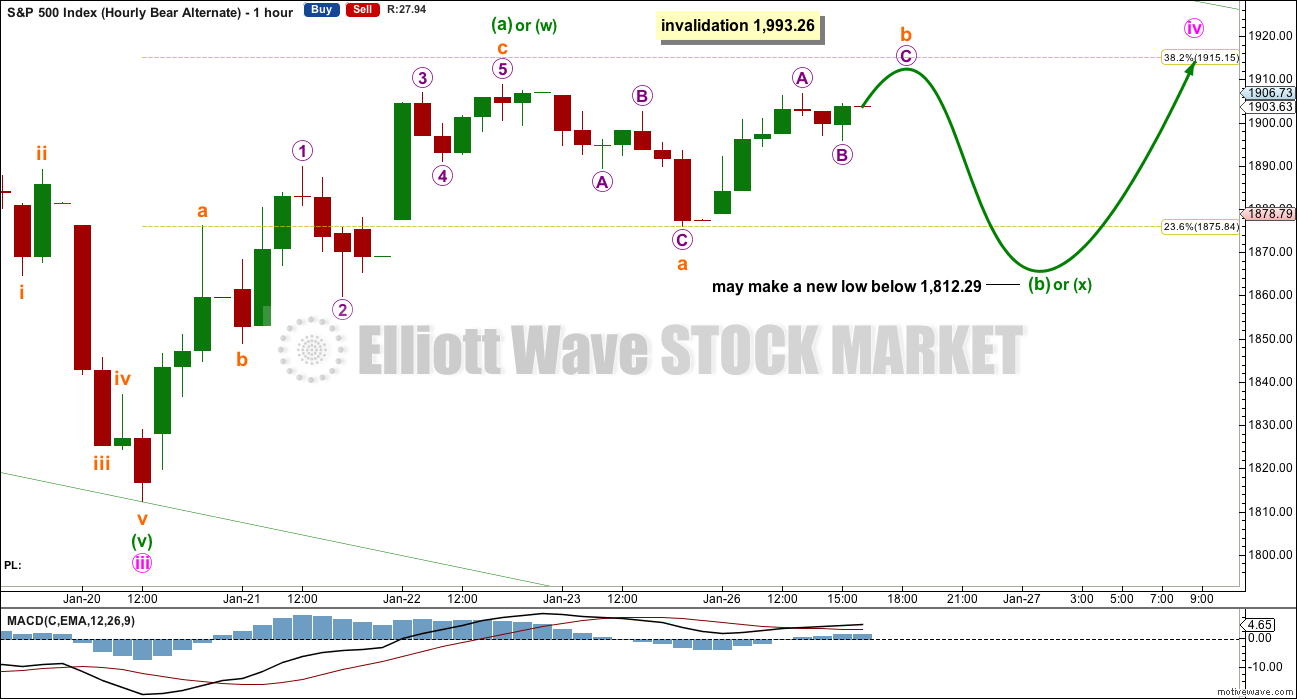
Click chart to enlarge.
If the degree of labelling within the last wave down is moved back up one degree, then this correction may be a fourth wave.
This wave count expects that the middle strongest part of intermediate wave (3) is over. This may be the case; an extended fifth wave down to follow this correction may be able to take intermediate wave (3) down to the target.
Minute wave iv may not move into minute wave i price territory above 1,993.26.
The first wave up of minuette wave (iv) subdivides best as a three, a zigzag. This means that minuette wave (iv) may be unfolding as either a flat, triangle or combination. It could also be a double zigzag as per the labelling in the first bear hourly chart.
Within an expanded flat, running triangle or combination, minuette wave (b) or (x) may make a new price extreme beyond the start of minuette wave (a) or (w) below 1,812.29. There is no lower invalidation point for this wave count.
Minuette wave (b) or (x) must subdivide as a corrective structure. It may be any one of 23 possible corrective structures. Today this chart looks at the possibility it may be unfolding as a flat correction.
Overall, it must be understood that when price is within a consolidation as it is now it is impossible to tell which Elliott wave structure will unfold. A fourth wave may be any one of 23 possible structures. The labelling will change as the structure unfolds. It is impossible to tell what pathway price will take during the correction due to the great variety of corrective structures. My focus will be on determining when it could be over.
I would not want to label this correction as a complete zigzag at the high of 1,908.85. It would be far too brief. It is most likely incomplete.
Today the structure for minute wave iv would still be incomplete.
TECHNICAL ANALYSIS
DAILY CHART
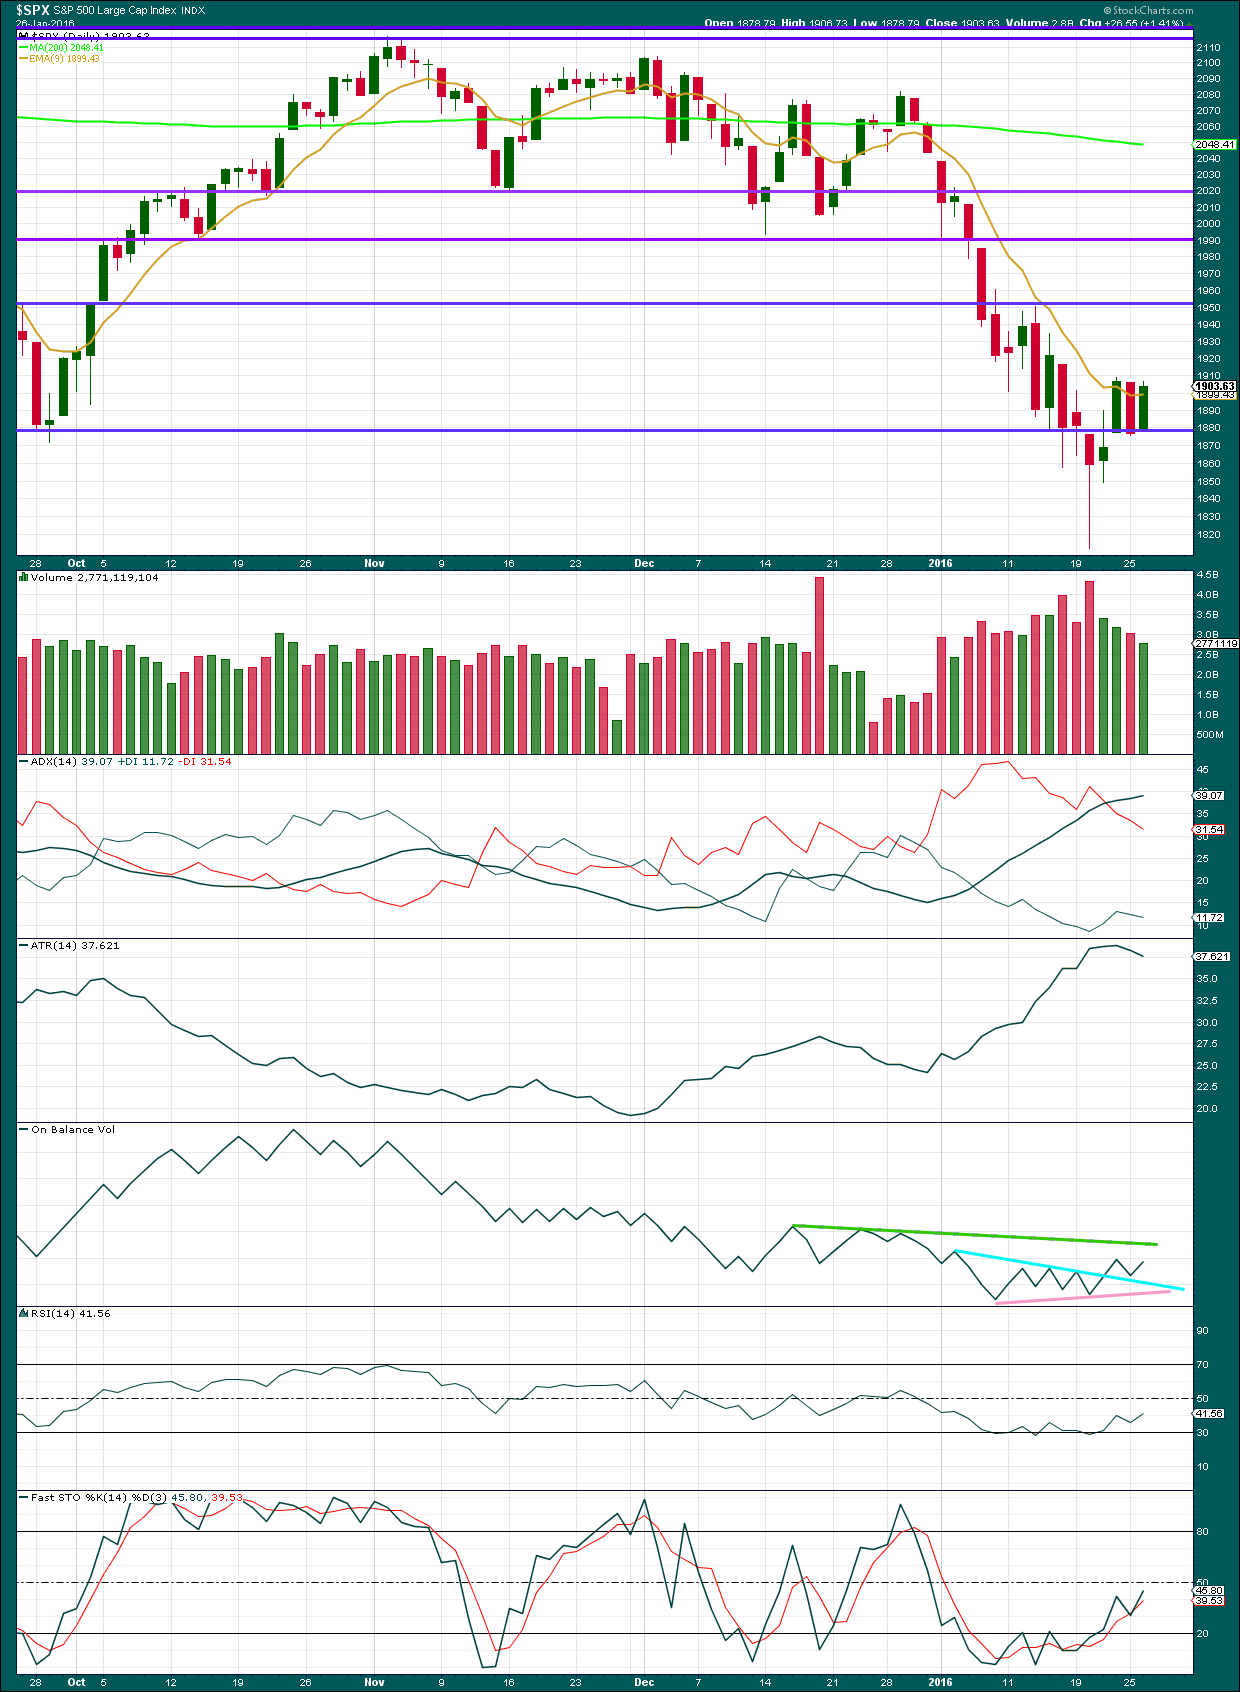
Click chart to enlarge. Chart courtesy of StockCharts.com.
As price fell to the last low, it came on increasing volume. The fall in price was supported by volume.
As price has moved higher and then sideways for the last four days, it comes on declining volume. This looks typically corrective; normally during a consolidation volume declines.
ADX still indicates that there is a trend and it is down. ATR disagrees as it is declining, which normally indicates price is consolidating. With price in choppy overlapping movement for the last three days, on balance technical indicators point to a consolidating market and not a trending market at this time.
ADX is a lagging indicator.
On Balance Volume may assist to show when any further upwards movement in price comes to an end. If OBV comes up to touch the green trend line, that may stop price.
If the market is consolidating at this stage, then it should be expected that price will swing from support to resistance and back again. Stochastics may be used to show when each swing ends. When Stochastics reaches overbought, then expect price to find resistance and turn down. With Stochastics not yet overbought and increasing further, upwards swings from price should be expected within this consolidation.
DOW THEORY
For the bear wave count I am waiting for Dow Theory to confirm a market crash. I am choosing to use the S&P500, Dow Industrials, Dow Transportation, Nasdaq and I’ll add the Russell 2000 index. Major swing lows are noted below. So far the Industrials, Transportation and Russell 2000 have made new major swing lows. None of these indices have made new highs.
At this stage, if the S&P500 and Nasdaq also make new major swing lows, then Dow Theory would confirm a major new bear market. At that stage, my only wave count would be the bear wave count.
The lows below are from October 2014. These lows were the last secondary correction within the primary trend which was the bull market from 2009.
These lows must be breached by a daily close below each point. So far the S&P has made a new low below 1,821.61, but it has not closed below 1,821.61.
S&P500: 1,821.61
Nasdaq: 4,117.84
DJT: 7,700.49 – this price point was breached.
DJIA: 15,855.12 – this price point was breached.
Russell 2000: 1,343.51 – this price point was breached.
This analysis is published @ 10:22 p.m. EST.
Europe in the red, US futures in the green (so far).
It looks as if the syncopation whipsaw will continue tomorrow. I generally avoid very short term trades but the last few days have been kinda fun as the market action has been so predictable. Will probably unload hedges (again!) at the open and re-load at the next dive…the market is giving mid and long term traders some remarkable opportunities to get positioned for what’s on the horizon…take them people!! 🙂
so we could be headed down toward the lows to form that B wave? then up to a high in C wave to finish out the correction?
I really thought about that as well but I think this is what is playing out as an idea only. Notice today we touched precisely at 38.2 fib and rejected which is normal before the next move up to the 61.8 at 1979. Then the big decline…
Yes. That is one possibility I’ll be charting.
Thanks. I have an overshoot to 2008 price target. Isn’t that sorta interesting given we are about to enter bear territory…
Joseph or Rodney?
Do you see a triangle here or is it just me?
Ace,
I would not have drawn the lines such or see a triangle. But a case can be made that that last 4 days (including today) show a bull flag. If broken to the upside, it projects a move up of about 85 points or so from the top of the flag. That takes us to 1990 or so. I would not put too much weight on this though. But if we break to the upside (above 1910 and beyond), it gives us a reasonable target to consider.
Thanks Rodney!
I think it is basing to bounce in the beginning of the month as NEW money flows in!
Just an idea only! That is all…
If everything that I have seen over the years that looked like a triangle forming actually became one, I would be a rich man by now and certainly not posting here.
Hope I answered you question.
Good point – we won’t know until after it happens! In the context of a 14 day sell off and a bounce before the next leg lower which is a classic corrective move – especially the fact we had got rejected at the 38.2 fib on the SPX today before maybe going up to tag the 61.8 at 1979ish. I was thinking potentially this would be a valid pattern.
It doesn’t meet the rules so far for a contracting triangle.
For an EW contracting triangle (the most common type) the rules are restrictive (more so than classic TA triangles). Each subwave may not move beyond the end of the prior triangle subwave in the same direction. Today made a slight new low below the prior downwards day of 25th Jan.
I’m ruling a triangle out.
On further reflection I can’t rule it out. But it is most unlikely.
Only wave A would be complete for a triangle.
K thanks. So it will be truly interesting what this pattern ends up being in the next week or so.
I h s got thrown out today when we hit those lower levels.
Jack
After hours fb and paypal up huge. Looks like MACD SPX is waiting for a day or 2 to cross over. Have you seen it in any case that it failed and just didn’t work?
I know it is counter-intuitive but maintain upside hedges. We have one more upside pop. See ya tomorrow…
Sorry Lara; I did not realize you had posted and did not mean to front run your comments!
Verne
I must admit you are the VIX guy on this site as far as I can see. Have you ever seen a candle like that on a daily? I got to tell you it is interesting. Your technical thoughts? What a massive DOJI. Look at how high it spiked but the index didn’t go as low?
Much appreciated!
A while back Olga mentioned IBKR had issued a ban on shorting UVXY so it does seem as if the crowd has been eager to short any strong upward move in volatility. It looks to me like the smart money has been accumulating long positions in volatility and the dumb money has been shorting it, both aggressively, hence the long wicks. I can see the mother- of- all capitulation/ short- covering spikes developing…
No worries.
The correction continues.
The scenario of a double zigzag is still valid. It would now expect new highs for the last wave C of the second zigzag.
The scenario of a triangle, flat or combination is also still valid. It would now expect some more downwards movement to compete wave b or x, then more sideways movement for a few more days.
Overall this correction is still incomplete. It is still either a second wave or a fourth wave.
If volume is lower again today that will support that view.
I am still sitting on the sidelines waiting for this correction to be possibly complete. When the structure looks complete on the hourly chart I will then draw a channel about it. When the channel is breached to the downside then I will enter short. Not yet.
No Fed help… No Fed Put (That is OVER!) They have shot their L _ _ D!
You only have fundamentals (Which suck and getting worse) and
of course EW’s and Technical analysis!
Now putting hourly counts aside… What are the Daily, Weekly & Monthly counts?
+ The Bullish talking heads are out in full force talking their book for 2016… means only ONE thing!
Oh… and I left out one thing… Extreme equity valuations on a multiple to revenue basis + free cash vs market capitalization of the most popular stocks (momentum plays) in the main index’s,
I’ve missed you 1812… hope to see you again soon 🙂
Jack
That was awesome. I am not sure how they pushed VIX High and then Lower but that was something else!
Jack
Uh oh. Look at that VIX Candle now spike with a DOJI. I have never seen a candle like that in history!
SPX has broken out of the IHS at roughly 1906 to the upside. Projection for move upwards of about 85 points, or 1991. This would be end of the current correction. I am not sure if it would be a wave 2 or wave 4 correction. I am guessing ii. But I leave that to Lara.
I saw this this past weekend and commented yesterday as well..
My guess and hunch tells me 2nd wave correction.
But like you said we will all wait for final approval.
Well, it broke down beneath the neckline. A reminder that classical chart patterns are not 100% just like most indicators. We will wait to see if the IHS plays out.
I agree!
Have a great day all. Look for UVXY to revisit support at around 41.50 Ya’ll know what to do. Back tomorrow! Bye!
verne
I’m out dont have time to chat till the close. best of luck!
Bye’…
Falling bullish wedge. More upside probable…
Had a quick second. But you changed your ideas from sell?
I thought you are all in yesterday short? What happened now?
Let me guess Banksters bought the futures right ? lol
Reloading upside hedges…same protection, at a much lower price of course! 🙂
Interesting that the market yet has to print a candle entirely above the support cyan line from the August to September lows…another reason I expected stiff resistance to ongoing upward movement. Battle around round number pivots are also good short term tells. When bulls fail to take them decisively ( 1.5 % or more ABOVE the pivot), a short term bearish trade has good reward to risk ratio as the next trading session generally sees a fall, even if only temporarily, back below the pivot.
If the bulls do not take BOTH pivots today, which should coincide with a decisive move above the cyan line, we could see a swift move back below the start of this correction. I would expect one more stab at the cyan support line which is still providing important information IMHO. 🙂
PS Selling UVXY calls first thing at the open bought at support around 41.50 based on above stated idea.
I don’t make a lot of very short term trades but every now and then a gift falls right into your lap if you know what to look for..
ok
No charge… ! 🙂
had to respond – no charge to you either 😉 Best of luck….
Ben
Futures saved for now. I am taking the day off. More than likely it jolts up when the fed saves the day as usual!
BA & AAPL down big premarket, especially BA… funny how these moves don’t seem to be reflected in the futures pricing this morning.
How are you able to post without a reply button on your post?
Listen man I know what you are saying these are ridiculous up moves but I’m
Telling you in a consolidation you short you lose the most!
The setup favors higher prices.
You got to wait for this to grind up and then you short!
Bad entry here, only an unexperienced trader would sell here!
Be careful!
Options – Please be careful what you post.
Was only a few days ago you were advising people to move into short positions and turn off for 10 days.
Appreciate that you are trying to support people, however analysis is preferred over views.
Ali
Hi
I said trade at your own risk too. Even if you took that trade like I did you would have made +200% if you got out that week.
He certainly is ALL over the map is he not? 🙂 🙂 🙂
Verne and Ali,
Come on – I got to go but seriously I am here to learn..
Trade at your own risk.
The setup to fade is coming.
You can not be stubborn in this market.
Pride doesnt pay! If you are wrong on a trade move on – dont look back and learn from your mistake
bye!
Just highlighting it O.
I didn’t trade the position, just mindful that others may follow and it appears (from the outside) that you are lurching long and short.
Trying to trade a plan.
I have my own plan. I share it and always say trade or invest at your own risk. Looks like I have a 9/10 hit ratio of being right and it always works 😉 Today we go higher as I have been saying for days now and we are going higher…
all the best!
It is great that you share your trading experience and techniques.
The key though in doing so is to share your approach without using words that tell others what to do.
Because in this membership there are many who are inexperienced and will be reading your comments and comments of others here as advice and guidance.
I do not think TBH that this membership is suited for inexperienced traders. If they are trying to learn how to profit here they may be disappointed. Because its analysis only, not a signal service and not trading advice. And because this market is volatile and hard to trade.
But they are here. And they are listening and reading our comments.
So please frame your comments using personal pronouns, telling us what approach you are taking, how and why. And remember the inexperienced traders reading your comments.
And thank you for sharing your many years of expertise with us all.
If someones ask me again. I won’t share my view on short or long to be interrupted as a buy or sell. When I joined a room before it was easy to see others view based on experience. No problem.
I entered my 2nd short yesterday ~12:30 ET. 1st was at 2100 – 2115 area.
Pick your spot is all I am saying for Med/LT Short.
I don’t day trade and I don’t trade anything that can be put on overnight… just to be clear!
Lara,
Could the correction be over already where you have pick circle a? S&P futures and Nasdaq futures are down about 1% after apple earnings disappointed. Wondering if we are starting the decline already.
Thanks,
Ben
Futures were down over 1% last night as well when China was crashing and today we rallied over 280 points. The futures are thinly traded and can change in an instant…That’s My 2 cents.
That is exactly my view.
I hope those shorts feel lucky
Because today they are going to need it!
No reversal signal and no basis to go short
Being hopeful of a decline is not a trading strategy
No Luck Involved! Go Short & Stay Short Med & LT!
Not today. If you think the fed will raise rates. I think we are definitely on different planes of monetary policy understanding.
Odds are we go higher
I presented the I h s on spx
I have no basis to go short! Not a single clue
In fact futures have erased almost everything now from a approx -14 point drop
So I’m not going to be logging in today till after the market
All the best!
The Fed is out of ammo! The deflationary cycle is upon us like a Freight Train going downhill. The Fed can’t stop it… nobody can. The system needs to cleanse itself of all this unsustainable debt and unfunded liabilities (Unsustainable!)! That’s the truth that the powers that be refuse to acknowledge. Everything else is noise! EW has the big picture right. Businesses should NOT be valued (market Capitalization) more than 2 to 3 times (max) the revenue they generate + free cash. It will revert to the mean… after an overshoot.
You sound like blue star on I bank coin!
Listen I’m bearish but I’m also careful
These things don’t go down in a straight line
I’m saying short term pop and drop
No
All
Time highs man
Joseph
This guy on twitter is really good. Check him out. Even I am still learning about technical analysis!
I really do not think so. I will approach analysis of this correction with patience. We need to see a clear channel about it, and then that channel needs to be breached.
Only then (and maybe not even then) will we have any reasonable probability that it could be over.
Lara, Thanks for the reply. I closed my QQQ puts at the end of the day for 2.5x on this big Nasdaq drop. Looking for the flat to play out and will re-short in a few days. Appreciate the follow up.