
A new high above 1,901.10 invalidated the main hourly Elliott wave count and confirmed the alternate.
Summary: A deeper and longer bounce is in the early stages. It may end about 1,915 or 1,978. It should continue next week. The larger trend remains down.
To see how each of the bull and bear wave counts fit within a larger time frame see the Grand Supercycle Analysis.
To see detail of the bull market from 2009 to the all time high on weekly charts, click here.
Last published monthly charts can be seen here.
If I was asked to pick a winner (which I am reluctant to do) I would say the bear wave count has a higher probability. It is better supported by regular technical analysis at the monthly chart level, it fits the Grand Supercycle analysis better, and it has overall the “right look”.
New updates to this analysis are in bold.
BULL ELLIOTT WAVE COUNT
DAILY CHART – COMBINATION OR FLAT
Click chart to enlarge.
This wave count is bullish at Super Cycle degree.
Cycle wave IV may not move into cycle wave I price territory below 1,370.58. If this bull wave count is invalidated by downwards movement, then the bear wave count shall be fully confirmed.
Cycle wave II was a shallow 0.41 zigzag lasting three months. Cycle wave IV should exhibit alternation in structure and maybe also alternation in depth. Cycle wave IV may be a flat, or combination.
Cycle wave IV may end within the price range of the fourth wave of one lesser degree. Because of the good Fibonacci ratio for primary wave 3 and the perfect subdivisions within it, I am confident that primary wave 4 has its range from 1,730 to 1,647.
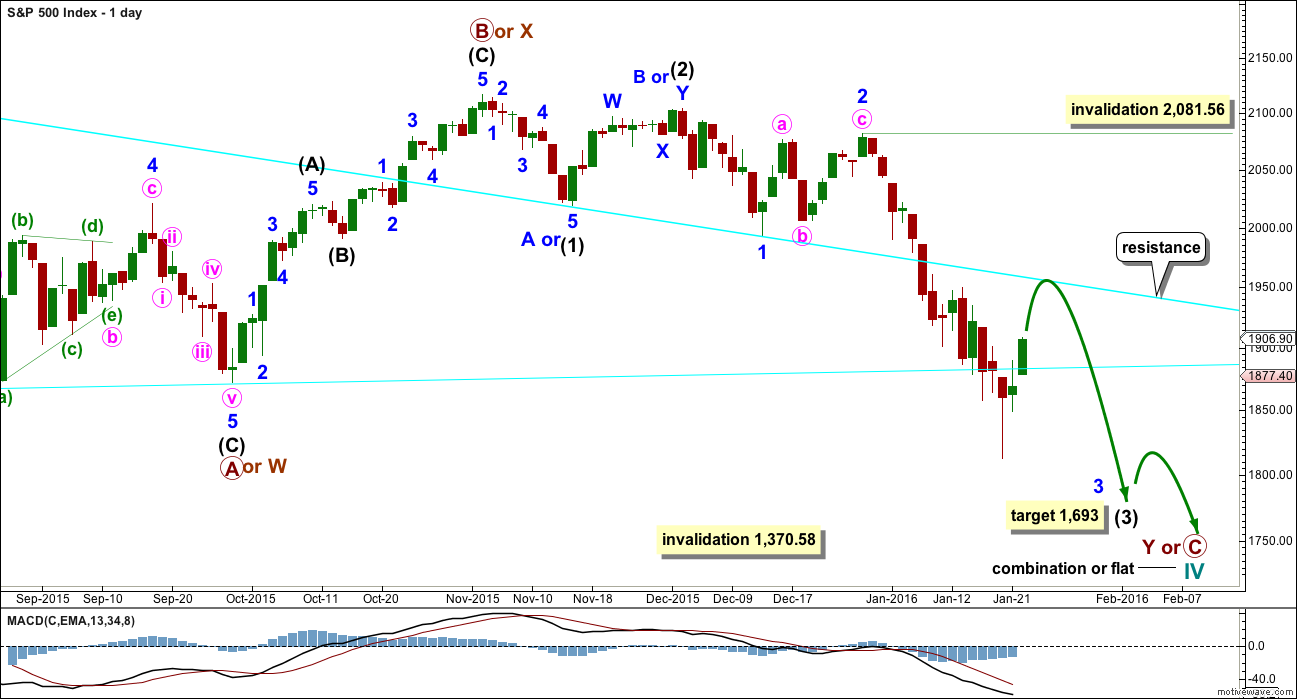
Primary wave C should subdivide as a five and primary wave Y should begin with a zigzag downwards. This downwards movement is either intermediate waves (1)-(2)-(3) of an impulse for primary wave C or minor waves A-B-C of a zigzag for intermediate wave (A). Both these ideas need to see a five down complete towards the target, so at this stage there is no divergence in expectations regarding targets or direction. When and if these two ideas diverge, I will separate them out into two separate charts. For now I will keep the number of charts to a minimum.
Primary wave A or W lasted three months. Primary wave C or Y may be expected to also last about three months.
Within the new downwards wave of primary wave C or Y, a first and second wave, or A and B wave, is now complete. Intermediate wave (2) or minor wave B lasted a Fibonacci 13 days exactly. At 1,693 intermediate wave (3) would reach 4.236 the length of intermediate wave (1).
Minute wave iv may not move into minute wave i price territory above 1,993.26. It may end when price finds resistance at the upper cyan line.
Price broke through support at the cyan trend line which is drawn from the August lows to September lows. This line is no longer providing resistance. The next line to offer resistance may be the downwards sloping cyan line.
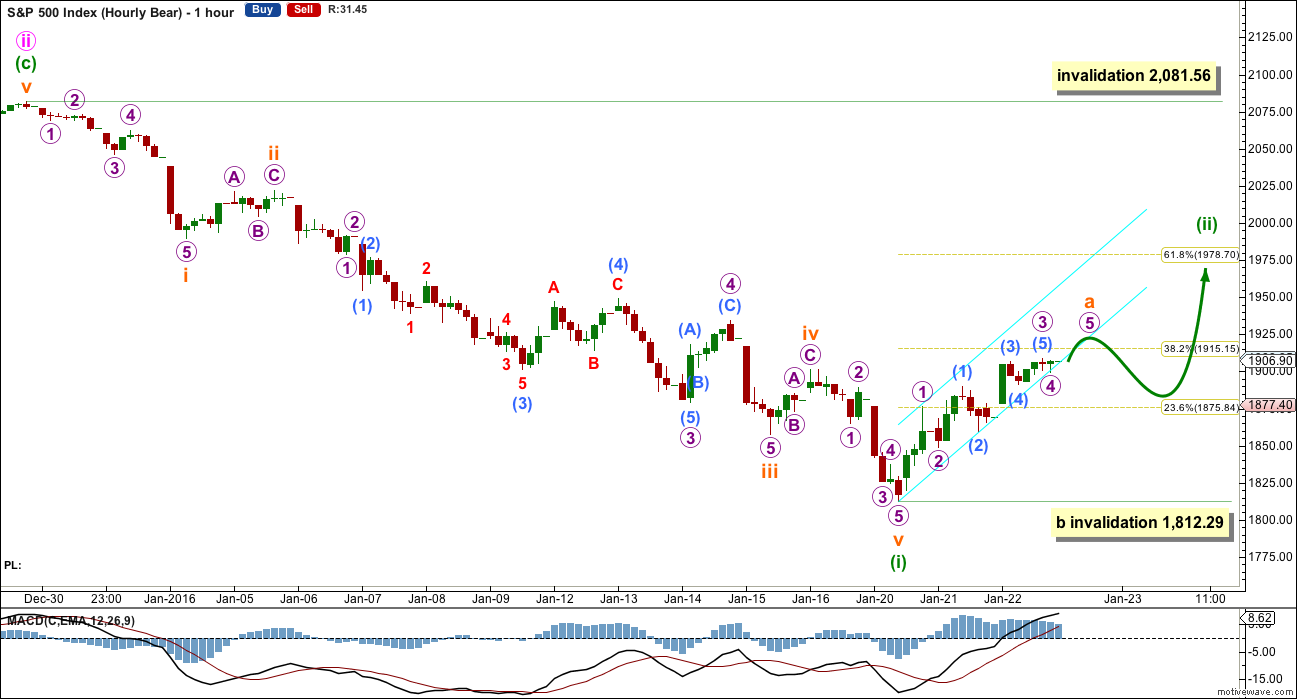
HOURLY CHART
Click chart to enlarge.
At this stage, the bull and bear wave counts are essentially the same at the hourly chart level. Commentary will be with the bear wave count.
BEAR ELLIOTT WAVE COUNT
WEEKLY CHART
Click chart to enlarge.
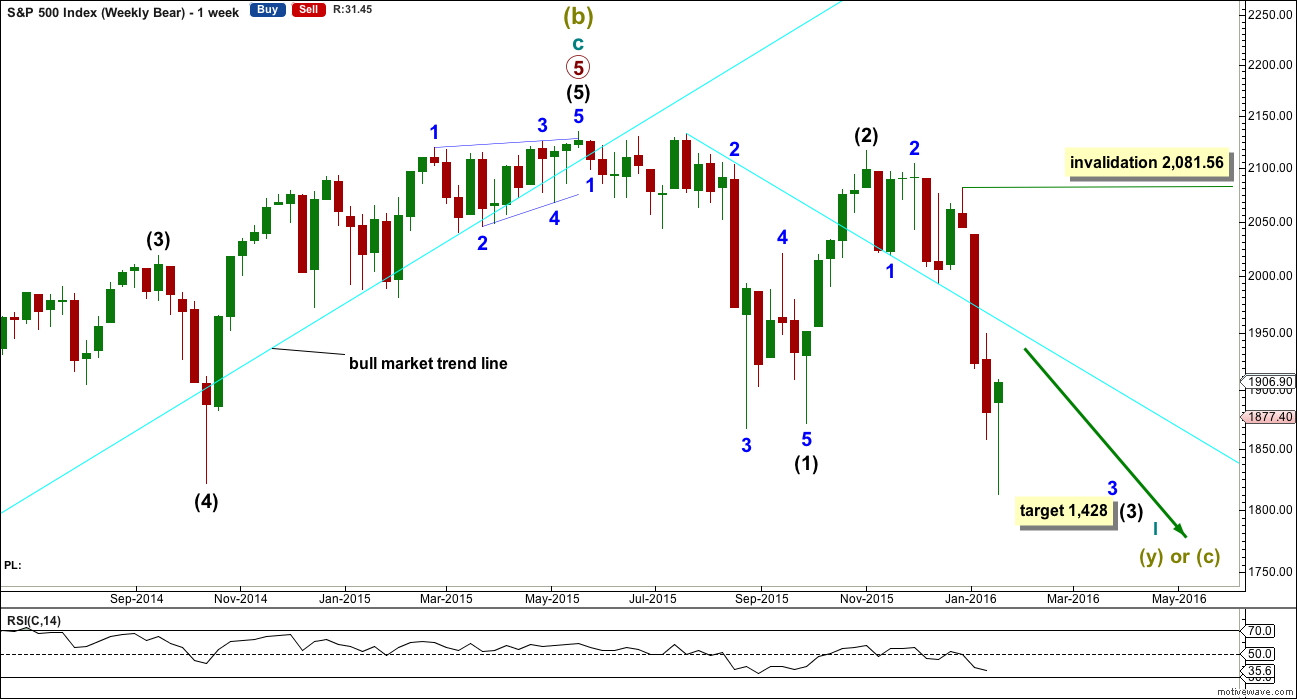
Downwards movement so far within January still looks like a third wave. This third wave for intermediate wave (3) still has a long way to go. It has to move far enough below the price territory of intermediate wave (1) to allow room for a following fourth wave correction to unfold which must remain below intermediate wave (1) price territory.
Intermediate wave (1) subdivides as a five wave structure with a slightly truncated fifth wave.
Intermediate wave (2) is complete as a deep zigzag.
Intermediate wave (3) would reach 2.618 the length of intermediate wave (1) at 1,428.
The hammer candlestick for this week suggests a trend reversal. This is not an indicator that the bear market is over. It may be an indicator that a correction within the bear market has begun.
DAILY CHART
Click chart to enlarge.
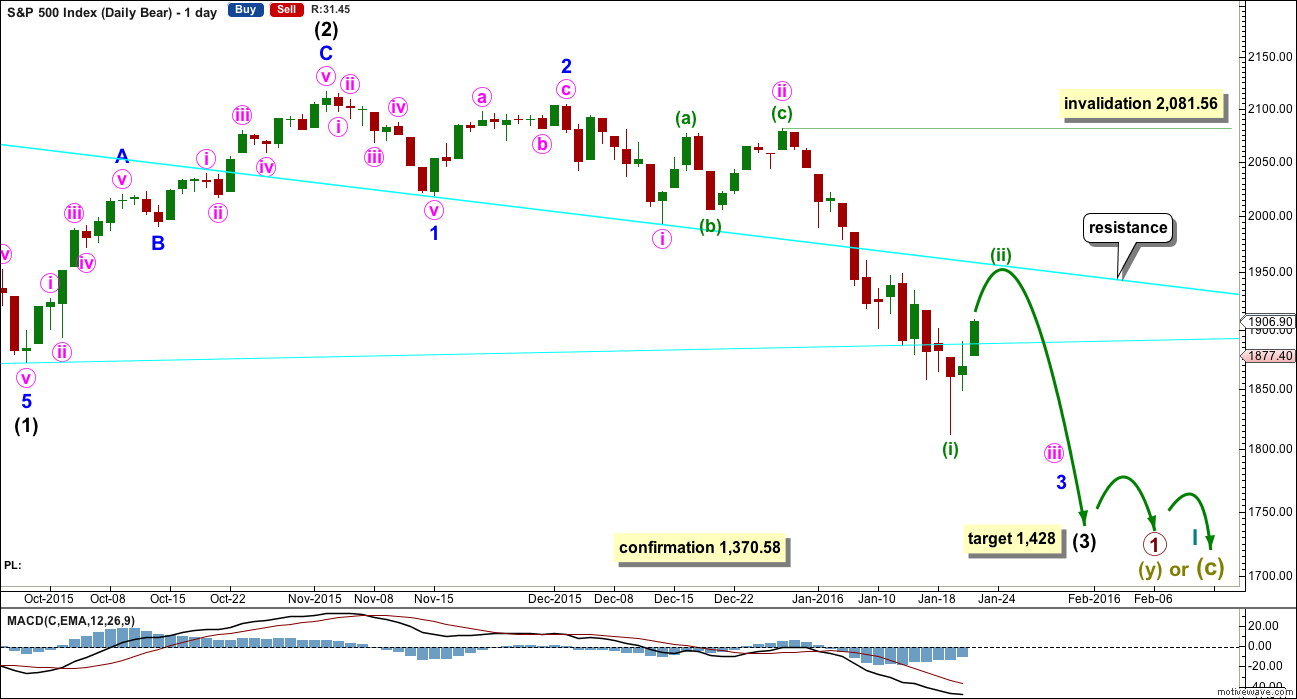
This bear wave count fits better than the bull with the even larger picture, super cycle analysis found here. It is also well supported by regular technical analysis at the monthly chart level.
Importantly, there is no lower invalidation point for this wave count. That means there is no lower limit to this bear market.
The downwards movement labelled intermediate wave (1) looks like a five.
Ratios within intermediate wave (1) are: minor wave 3 is 7.13 points short of 6.854 the length of minor wave 1, and minor wave 5 is just 2.82 points longer than 0.618 the length of minor wave 3. These excellent Fibonacci ratios add some support to this wave count.
Intermediate wave (2) was a very deep 0.93 zigzag. Because intermediate wave (2) was so deep the best Fibonacci ratio to apply for the target of intermediate wave (3) is 2.618 which gives a target at 1,428. If intermediate wave (3) ends below this target, then the degree of labelling within this downwards movement may be moved up one degree; this may be primary wave 3 now unfolding and in its early stages.
This week I have changed the labelling within the wave down labelled minute wave i. It does not look like a good five on the daily chart, but it will subdivide as a five on the hourly chart. Sometimes the S&P’s waves just don’t always look right at all time frames. This has a better look at the weekly chart level. This change makes no difference to expected direction, targets or invalidation points at this stage. It will make a difference towards the end of intermediate wave (3).
I have two scenarios for the correction which began two days ago. It may be either a second wave or a fourth wave. Looking at how far down intermediate wave (3) still needs to go on the weekly chart, I would favour the second wave scenario. That will be the main hourly wave count for that reason.
HOURLY CHART
Click chart to enlarge.
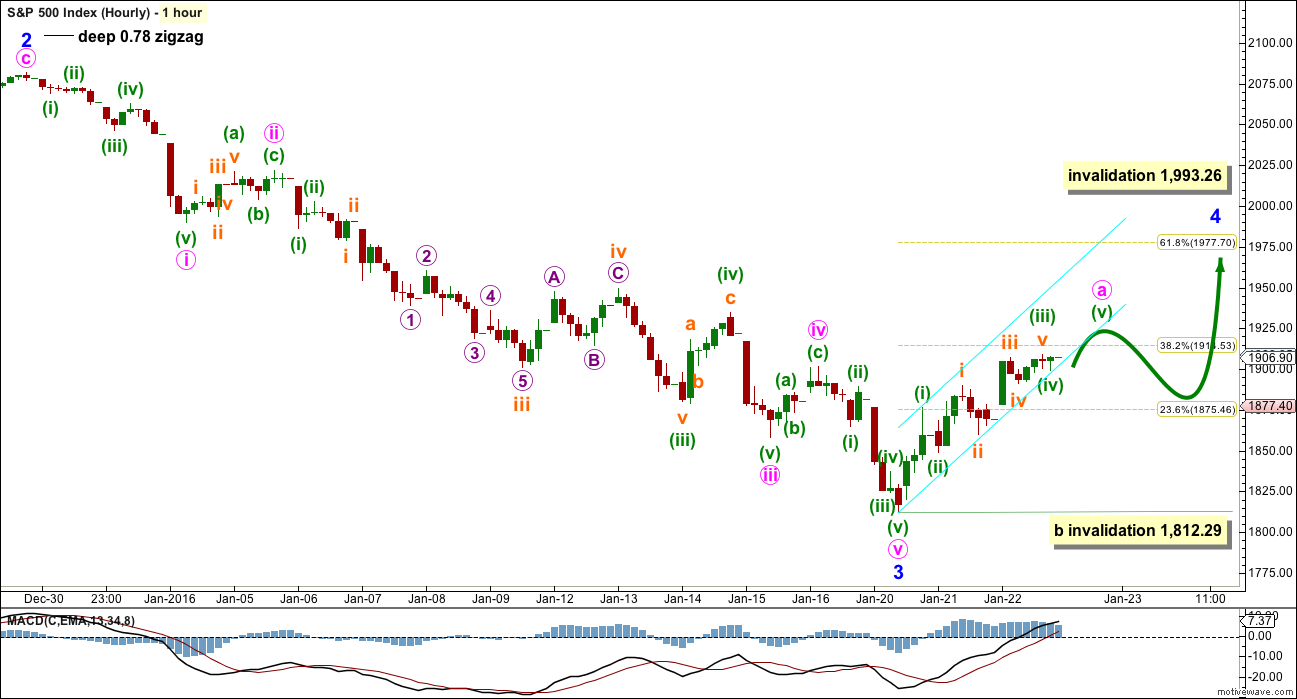
Despite the lack of alternation between second and fourth wave corrections, this downwards move must be over. Alternation is a guideline, not a rule. It should be expected, but sometimes it doesn’t happen. Low probability wave counts are still possible.
If this upwards movement is another second wave correction, then it would most likely be a zigzag. It may end about the 0.382 or 0.618 Fibonacci ratios, with the 0.618 ratio slightly favoured.
Within the zigzag, subminuette wave a looks to be either complete or almost complete. A small best fit cyan channel is drawn about it. When that is breached, then it may be subminuette wave b.
Subminuette wave b may not move beyond the start of submineutte wave a below 1,812.29.
So far within this bear market intermediate wave (2) lasted 25 days. Minor wave 2 lasted 11 days. Minute wave ii lasted 10 days. Each successive second wave correction was shorter in duration. If this bounce is another second wave, then it should be shorter than 10 days. Overall, this wave count expects choppy overlapping upwards movement for another three or six days to total a Fibonacci five or eight.
ALTERNATE HOURLY CHART
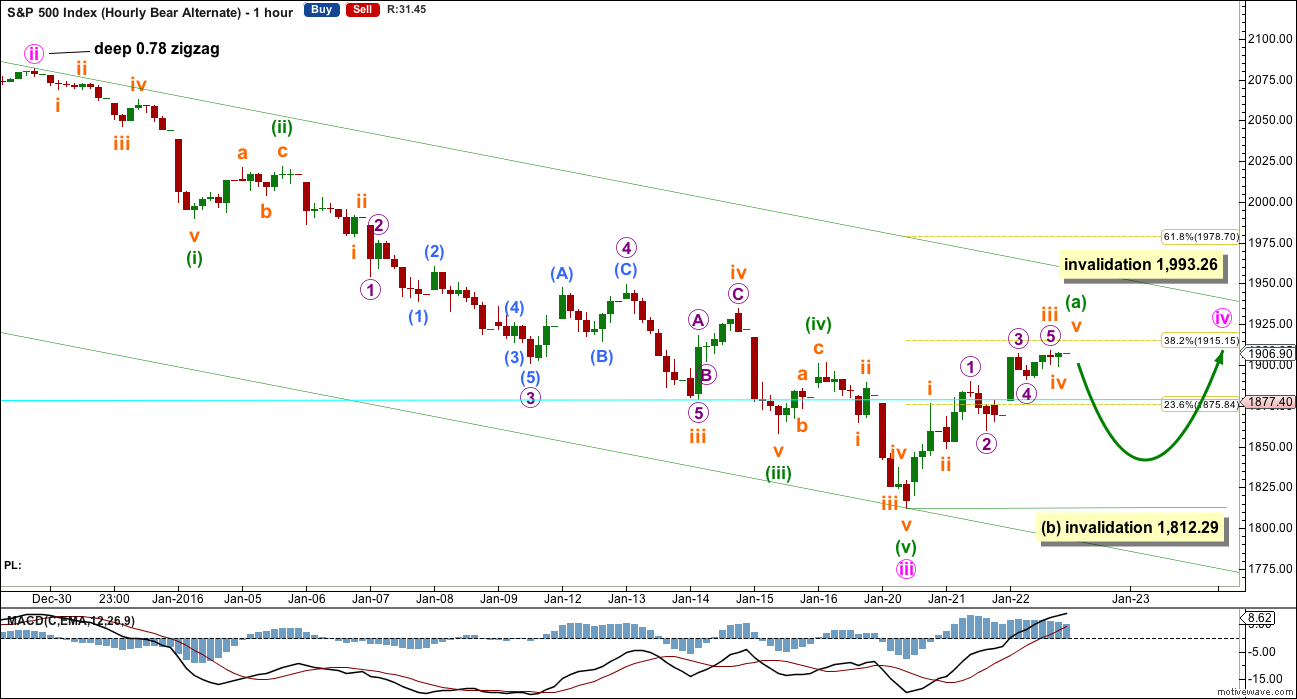
Click chart to enlarge.
If the degree of labelling within the last wave down is moved back up one degree, then this correction may be a fourth wave.
This wave count expects that the middle strongest part of intermediate wave (3) is over. This may be the case; an extended fifth wave down to follow this correction may be able to take intermediate wave (3) down to the target.
Minute wave iv may not move into minute wave i price territory above 1,993.26.
So far upwards movement does look like an impulse. When the first move in a correction is a five, then the following B wave may not move beyond the start of wave A below 1,812.29.
Minute wave ii was a deep 0.78 zigzag lasting 10 days. Minute wave iv should be expected to show alternation with minute wave ii. A flat, combination or triangle would be most likely. However, as we have seen, alternation is a guideline not a rule. So far upwards movement looks like an impulse, but it may yet morph into a single or double zigzag.
While the correction unfolds (whether it is minuette wave (ii) or minute wave iv) the labelling within it will probably change. There are still multiple structural possibilities and it is impossible at this early stage to tell which one will unfold.
TECHNICAL ANALYSIS
DAILY CHART
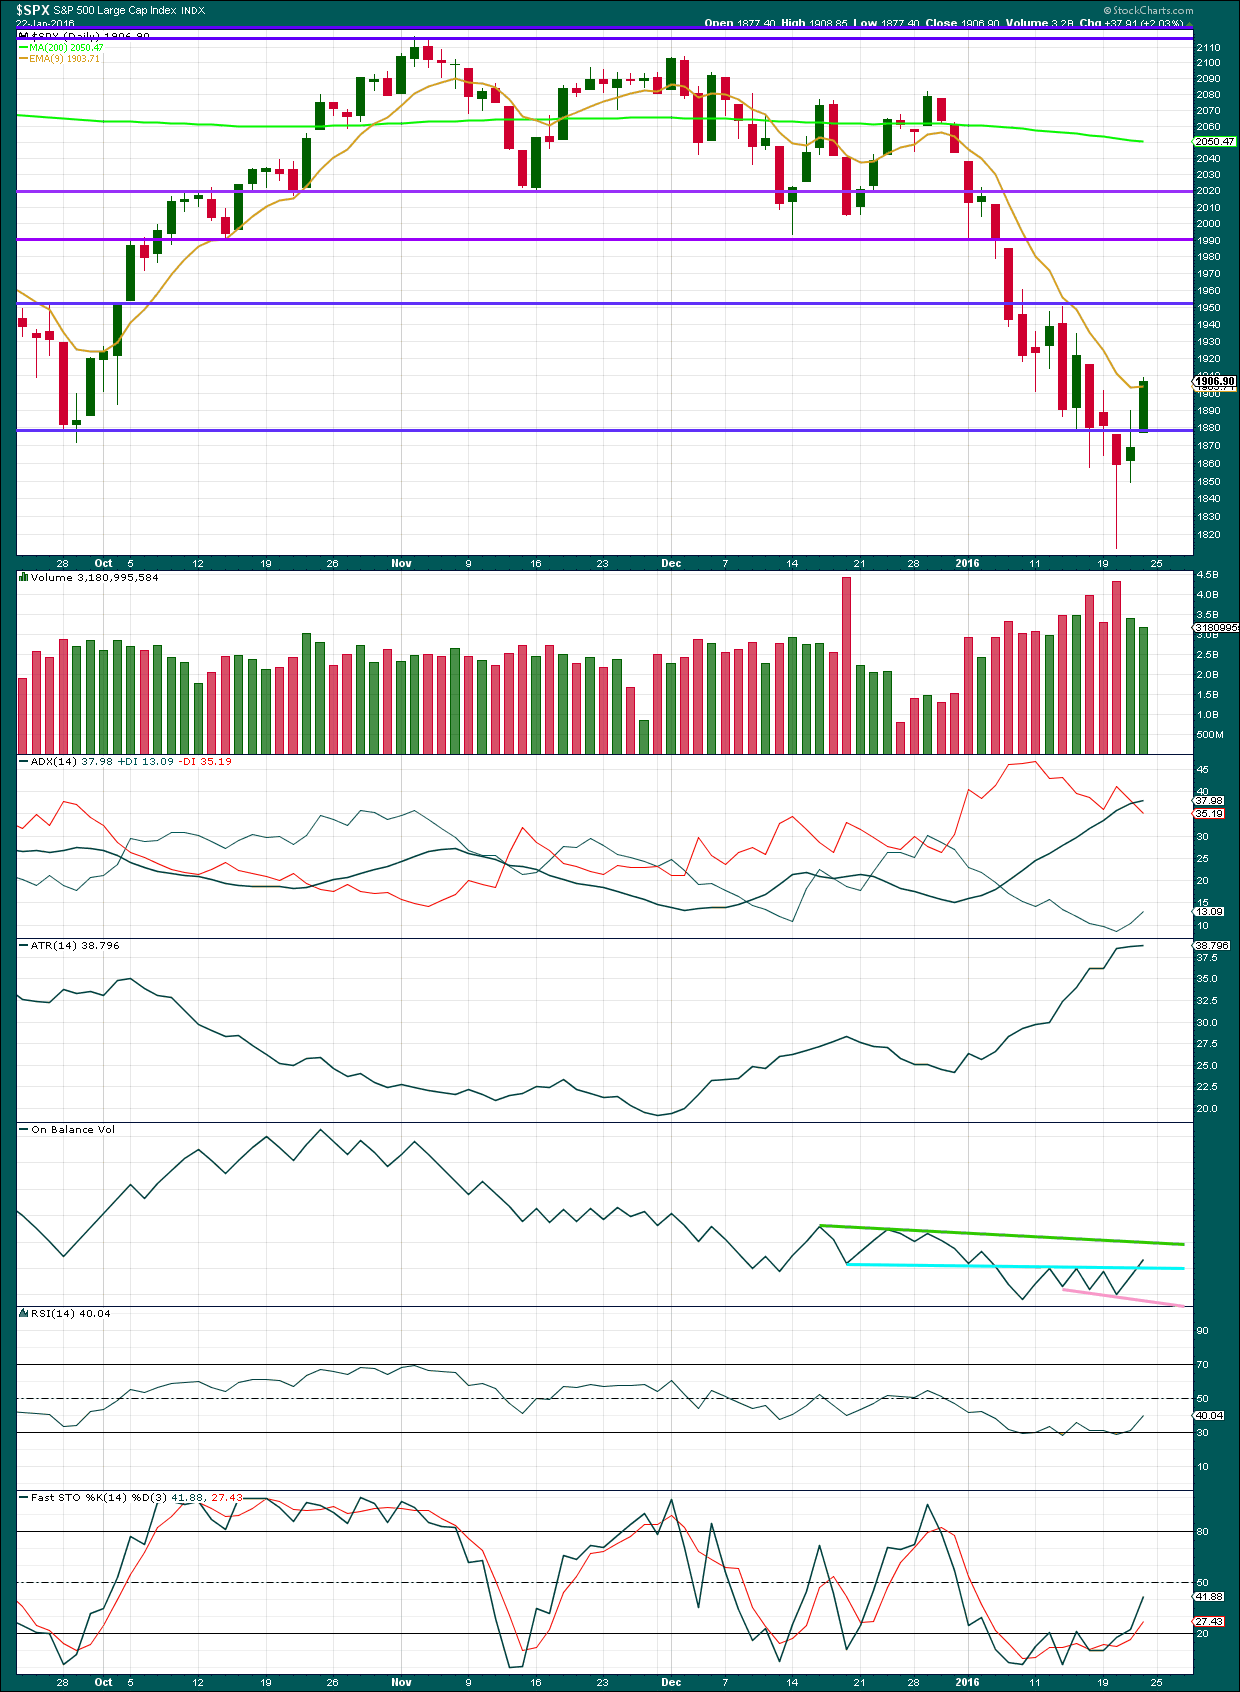
Click chart to enlarge. Chart courtesy of StockCharts.com.
We still have a series of lower highs from the all time high and lower lows.
This week the S&P made an important new low below August 2015 lows. (Although price did not close below the August 2015 lows, a new low was still made.)
The last rally failed to see a new all time high.
All the indices are making important new lows.
The two upwards days at the end of this week should be viewed as a bear market rally. The only question is: how long it will go on for and how deep it will be?
There is no technical confirmation of a trend change from bear to bull.
The volume profile continues to be bearish. Price came with increasing volume as it fell to the new low this week. As price has risen for Thursday and Friday, it comes with declining volume.
ADX still indicates the market is trending and the trend is down. At the end of this week, ATR is beginning to disagree: it is flattening off indicating a correction.
On Balance Volume did not find resistance at the blue line. The next line of resistance for OBV is the new green line.
This correction is returning RSI and Stochastics from oversold.
DOW THEORY
For the bear wave count I am waiting for Dow Theory to confirm a market crash. I am choosing to use the S&P500, Dow Industrials, Dow Transportation, Nasdaq and I’ll add the Russell 2000 index. Major swing lows are noted below. So far the Industrials, Transportation and Russell 2000 have made new major swing lows. None of these indices have made new highs.
At this stage, if the S&P500 and Nasdaq also make new major swing lows, then Dow Theory would confirm a major new bear market. At that stage, my only wave count would be the bear wave count.
The lows below are from October 2014. These lows were the last secondary correction within the primary trend which was the bull market from 2009.
These lows must be breached by a daily close below each point. So far the S&P has made a new low below 1,821.61, but it has not closed below 1,821.61.
S&P500: 1,821.61
Nasdaq: 4,117.84
DJT: 7,700.49 – this price point was breached.
DJIA: 15,855.12 – this price point was breached.
Russell 2000: 1,343.51 – this price point was breached.
This analysis is published @ 01:37 a.m. EST on 23 January, 2016.
Hi
Lara
So based on today and that candle today was über bearish.
Do we go back into “expect more surprises to the down side”?
Thanks
Ace
Jack
Your thoughts on today’s action ?
Ace – IMHO this is the start of the middle of the third wave…down we go…
Great Jack!
I will find a song for this moment….
The song is …..
http://youtu.be/l6eSksEp27U
Thank you for the song Ace – we’ve got to watch out for the CB’s dovish statements…
Good point but I think gundlach made it clear about the fed on zero hedge site.
Unless they go back to zero rates or change the rate hike schedule which I think would change everything even for the worse.
This should just start heading lower!
The Macd monthly sell signal needs to cut a 30% correction already… It’s been almost 1 year… It’s getting way to boring for this ping pong that high.
Today we barely hit the 38.2 fib on spx but
Ndx over shot it and reversed so That might have been it….
Jack
How long does middle of third wave last to get to the end of this move? Are we talking weeks or months ?
Below’s a different story ….Ftse 100
Good Evening (n/z) Lara
about Ftse 100 , I think it is possible to move the (i)minuette right to the last downturn (5602) and wait to end the rising (ii). you can confirm this ?
Thank you from avner.
Lara, before you were posting (at least a possible view) that wave IV could be over. Would that not still be possible (least fav option) if the low this week was Y of WXY for Wave 4? Sorry for the messy chart but trying to keep a view of the top possible options
That is a possible wave count, yes.
But is has the following problems:
The first structure for primary W would be seen as a flat correction. Within it intermediate (B) is over 90% of (A), but less than 110% and so this would be a regular flat. Which means that (C) is way longer than a (C) wave of a regular flat normally is.
C waves of regular flats are commonly close to even in length with the A wave, the whole thing moves sideways and normally fits well within a channel. This one is very far indeed from ideal. It meets the rules, but it does not have the right look.
The second structure of Y could be over yes. And it would be a zigzag. So the whole correction for cycle IV would be a double combination and would move sideways. So far so good (apart from the problems of the regular flat).
Within Y the fifth wave is a problem. Where you have it beginning at the end of (4) means on the hourly chart (5) would have to be an ending diagonal. But it meets neither the rules for a contracting nor expanding diagonal. The rule regarding wave lengths is violated.
You can make pretty much any wave count you like. But if you ignore the right look it must necessarily have a very low probability.
Even one rule violation invalidates the wave count.
Now you could resolve that by moving (3) and (4) lower. Then it would be a valid wave count.
It still has too many problems for me to publish it.
Thanks
Lara,
Would have the time to do analysis of NASDAQ index as last one is dated October 2015?
Regards,