
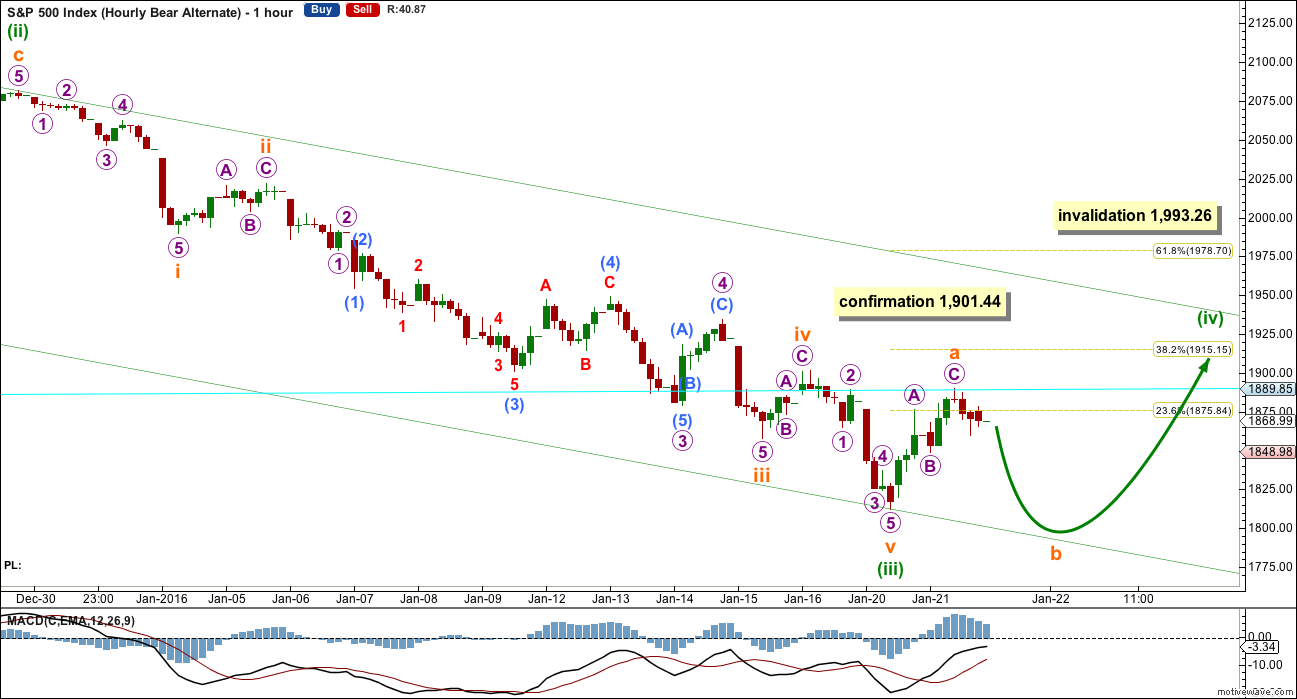
Price remains below the invalidation point on the preferred hourly chart, so that Elliott wave count still has a higher probability.
Summary: The middle of a big third wave should be approaching. The wave count expects a further increase in momentum. This view has a higher probability than the alternate which expects a bounce here. A new high above 1,901.44 would indicate a multi day bounce has arrived, which may not move above 1,993.26. Price is finding resistance right at the cyan trend line at the end of Thursday’s session.
To see how each of the bull and bear wave counts fit within a larger time frame see the Grand Supercycle Analysis.
To see detail of the bull market from 2009 to the all time high on weekly charts, click here.
Last published monthly charts can be seen here.
If I was asked to pick a winner (which I am reluctant to do) I would say the bear wave count has a higher probability. It is better supported by regular technical analysis at the monthly chart level, it fits the Grand Supercycle analysis better, and it has overall the “right look”.
New updates to this analysis are in bold.
BULL ELLIOTT WAVE COUNT
DAILY CHART – COMBINATION OR FLAT
Click chart to enlarge.
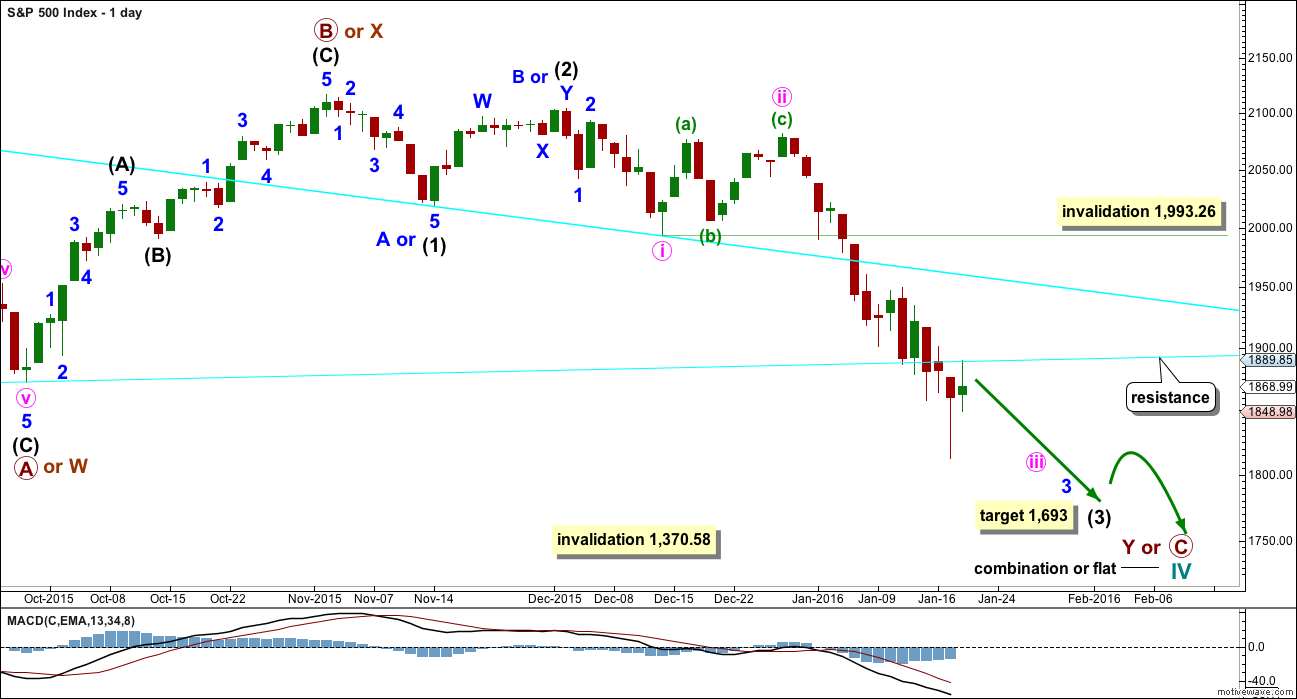
This wave count is bullish at Super Cycle degree.
Cycle wave IV may not move into cycle wave I price territory below 1,370.58. If this bull wave count is invalidated by downwards movement, then the bear wave count shall be fully confirmed.
Cycle wave II was a shallow 0.41 zigzag lasting three months. Cycle wave IV should exhibit alternation in structure and maybe also alternation in depth. Cycle wave IV may be a flat, or combination.
Cycle wave IV may end within the price range of the fourth wave of one lesser degree. Because of the good Fibonacci ratio for primary wave 3 and the perfect subdivisions within it, I am confident that primary wave 4 has its range from 1,730 to 1,647.
Primary wave C should subdivide as a five and primary wave Y should begin with a zigzag downwards. This downwards movement is either intermediate waves (1)-(2)-(3) of an impulse for primary wave C or minor waves A-B-C of a zigzag for intermediate wave (A). Both these ideas need to see a five down complete towards the target, so at this stage there is no divergence in expectations regarding targets or direction. When and if these two ideas diverge, I will separate them out into two separate charts. For now I will keep the number of charts to a minimum.
Primary wave A or W lasted three months. Primary wave C or Y may be expected to also last about three months.
Within the new downwards wave of primary wave C or Y, a first and second wave, or A and B wave, is now complete. Intermediate wave (2) or minor wave B lasted a Fibonacci 13 days exactly. At 1,693 intermediate wave (3) would reach 4.236 the length of intermediate wave (1).
Minute wave iv may not move into minute wave i price territory above 1,993.26. It may end when price finds resistance at the upper cyan line.
Price broke through support at the cyan trend line which is drawn from the August lows to September lows. This cyan line is now providing resistance for a throwback. This line is copied carefully over to hourly charts.
HOURLY CHART
Click chart to enlarge.
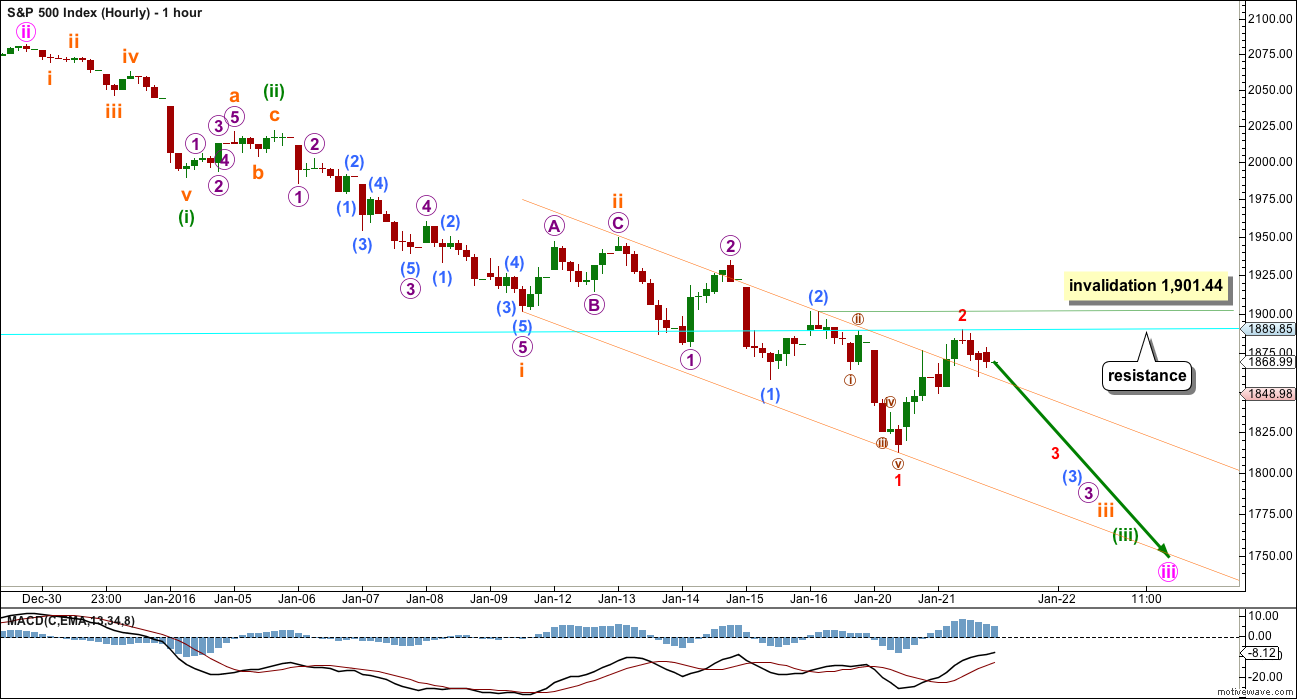
At this stage, the bull and bear wave counts are essentially the same at the hourly chart level. Commentary will be with the bear wave count.
BEAR ELLIOTT WAVE COUNT
DAILY CHART
Click chart to enlarge.
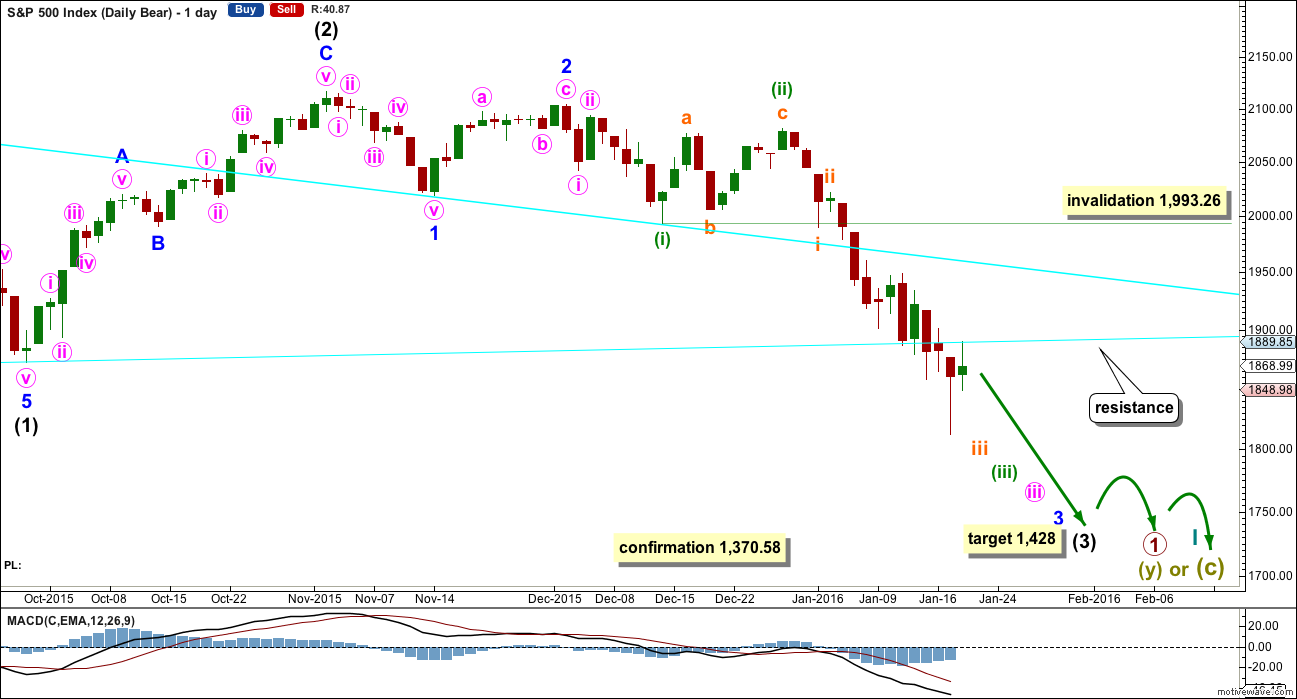
This bear wave count fits better than the bull with the even larger picture, super cycle analysis found here. It is also well supported by regular technical analysis at the monthly chart level.
Importantly, there is no lower invalidation point for this wave count. That means there is no lower limit to this bear market.
The downwards movement labelled intermediate wave (1) looks like a five.
Ratios within intermediate wave (1) are: minor wave 3 is 7.13 points short of 6.854 the length of minor wave 1, and minor wave 5 is just 2.82 points longer than 0.618 the length of minor wave 3. These excellent Fibonacci ratios add some support to this wave count.
Intermediate wave (2) was a very deep 0.93 zigzag. Because intermediate wave (2) was so deep the best Fibonacci ratio to apply for the target of intermediate wave (3) is 2.618 which gives a target at 1,428. If intermediate wave (3) ends below this target, then the degree of labelling within this downwards movement may be moved up one degree; this may be primary wave 3 now unfolding and in its early stages.
Because minuette wave (ii) was a deep correction of minuette wave (i), it would be expected that the correction of minuette wave (iv), when it arrives, should be shallow against minuette wave (iii). Minuette wave (iv) may not move into minuette wave (i) price territory above 1,993.26.
Intermediate wave (3) today shows a further increase in downwards momentum. It is now slightly stronger than the strongest part of intermediate wave (1) (its third wave is the August low, now off to the left of this chart; intermediate wave (1) ended with a slightly truncated fifth wave). A further increase should be expected. This supports the first hourly chart below.
HOURLY CHART
Click chart to enlarge.
So far all the corrections along the way down are zigzags. None of subminuette wave ii, micro wave 2, submicro wave (2), minuscule wave 2 or now nano wave ii can be seen as anything other than single or double zigzags. This supports this first hourly wave count; they all look like second wave corrections.
Nano wave ii may not move beyond the start of nano wave i above 1,901.44.
The acceleration channel about micro wave 3 is not working to show where price is finding resistance. Sometimes channels just don’t work well for the S&P. Because it was not working, I will redraw the channel as a best fit.
The cyan line is working well to show where price found resistance for Thursday’s high. That line should continue to hold, if this wave count is correct.
Upwards movement for nano wave ii subdivides perfectly as yet another zigzag and looks like a typically corrective structure. There are now nine first and second waves complete for this wave count. This wave count expects to see explosive downwards movement. A new low below 1,812.29 would increase the probability of this wave count but will not now provide full confidence.
ALTERNATE HOURLY CHART
Click chart to enlarge.
What if the middle of the third wave is over?
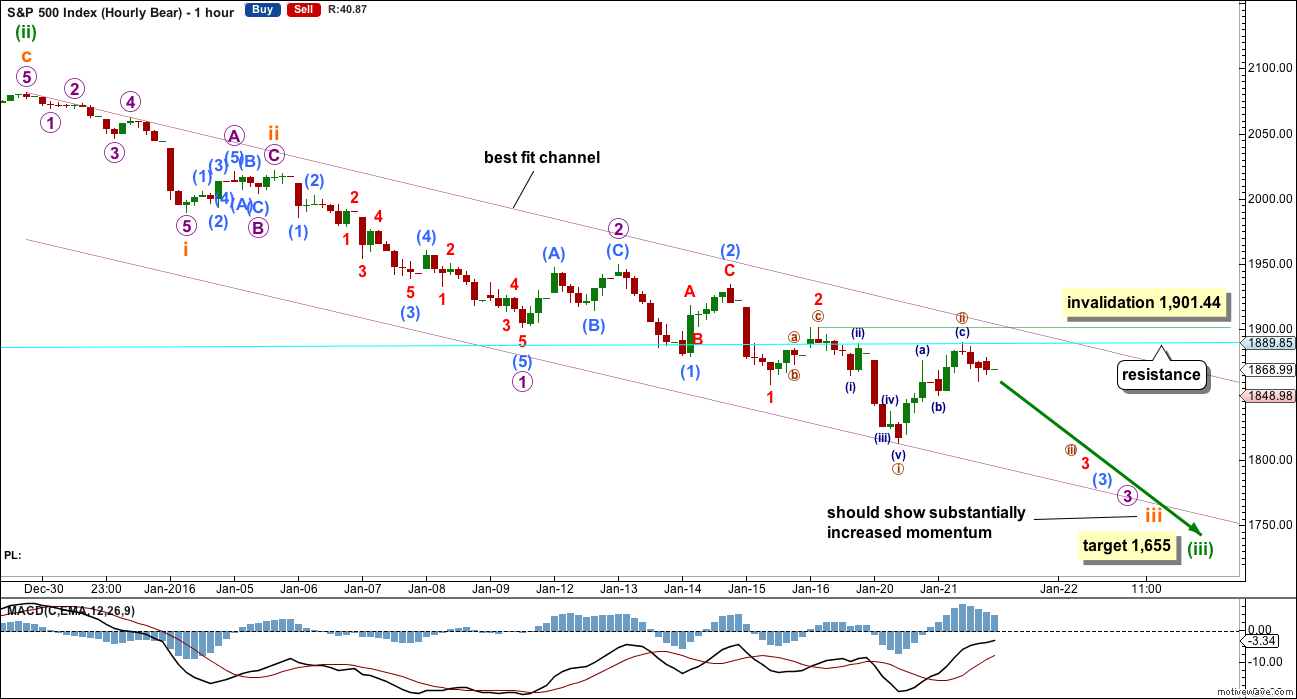
Minuette wave (iii) would be 5.95 points longer than 2.618 the length of minuette wave (i).
Ratios within minuette wave (iii) are: subminuette wave iii is 15.45 points longer than 1.618 the length of subminuette wave (i) (this is just less than 10% the length of subminuette wave iii, so I consider it an acceptable ratio, just), and subminuette wave v is just 3.07 points short of equality in length with subminuette wave i.
There is inadequate alternation at all wave degrees for this wave count which substantially reduces its probability:
– Subminuette wave ii was a shallow 0.35 zigzag; subminuette wave iv is a more shallow 0.26 zigzag.
– Micro wave 2 was a shallow 0.27 zigzag; micro wave 4 was a still shallow 0.49 zigzag.
– Submicro wave (2) was a deep 0.61 zigzag; submicro wave (4) was a deep 0.64 zigzag.
Minuette wave (ii) lasted 10 days. When minuette wave (iv) turns up it should last a Fibonacci 5 or 8 days in total. It may not move into minuette wave (i) price territory above 1,993.26. At this stage, I would expect minuette wave (iv) to be more brief than minuette wave (ii) unless it turns out to be a time consuming and shallow triangle.
This wave count requires a new high above 1,901.44 for confirmation.
Minuette wave (ii) was a deep zigzag. Minuette wave (iv) should be expected to be a shallow combination, flat or triangle. A flat would be most likely. It should exhibit alternation with minuette wave (ii).
The most likely target for minuette wave (iv) would be the 0.382 Fibonacci ratio of minuette wave (iii) at 1,915.
At this stage, within minuette wave (iv), the first wave up for subminuette wave a may be complete. Because this subdivides as a three wave structure, it means subminuette wave b may make a new low below subminuette wave a at 1,812.29 as in an expanded flat, running triangle or an X wave within a combination.
This wave count would now expect to see a three wave structure downwards. There is no lower invalidation point at this stage.
The main wave count expects to see a five wave structure downwards. It is only structure (is it a three or a five?) and momentum which differentiate these two wave counts today.
If tomorrow moves price lower on light volume with weak momentum and it subdivides as a three, this wave count should be taken very seriously. However, if tomorrow moves price lower on increased volume with strong momentum, then this wave count may be discarded.
TECHNICAL ANALYSIS
DAILY CHART
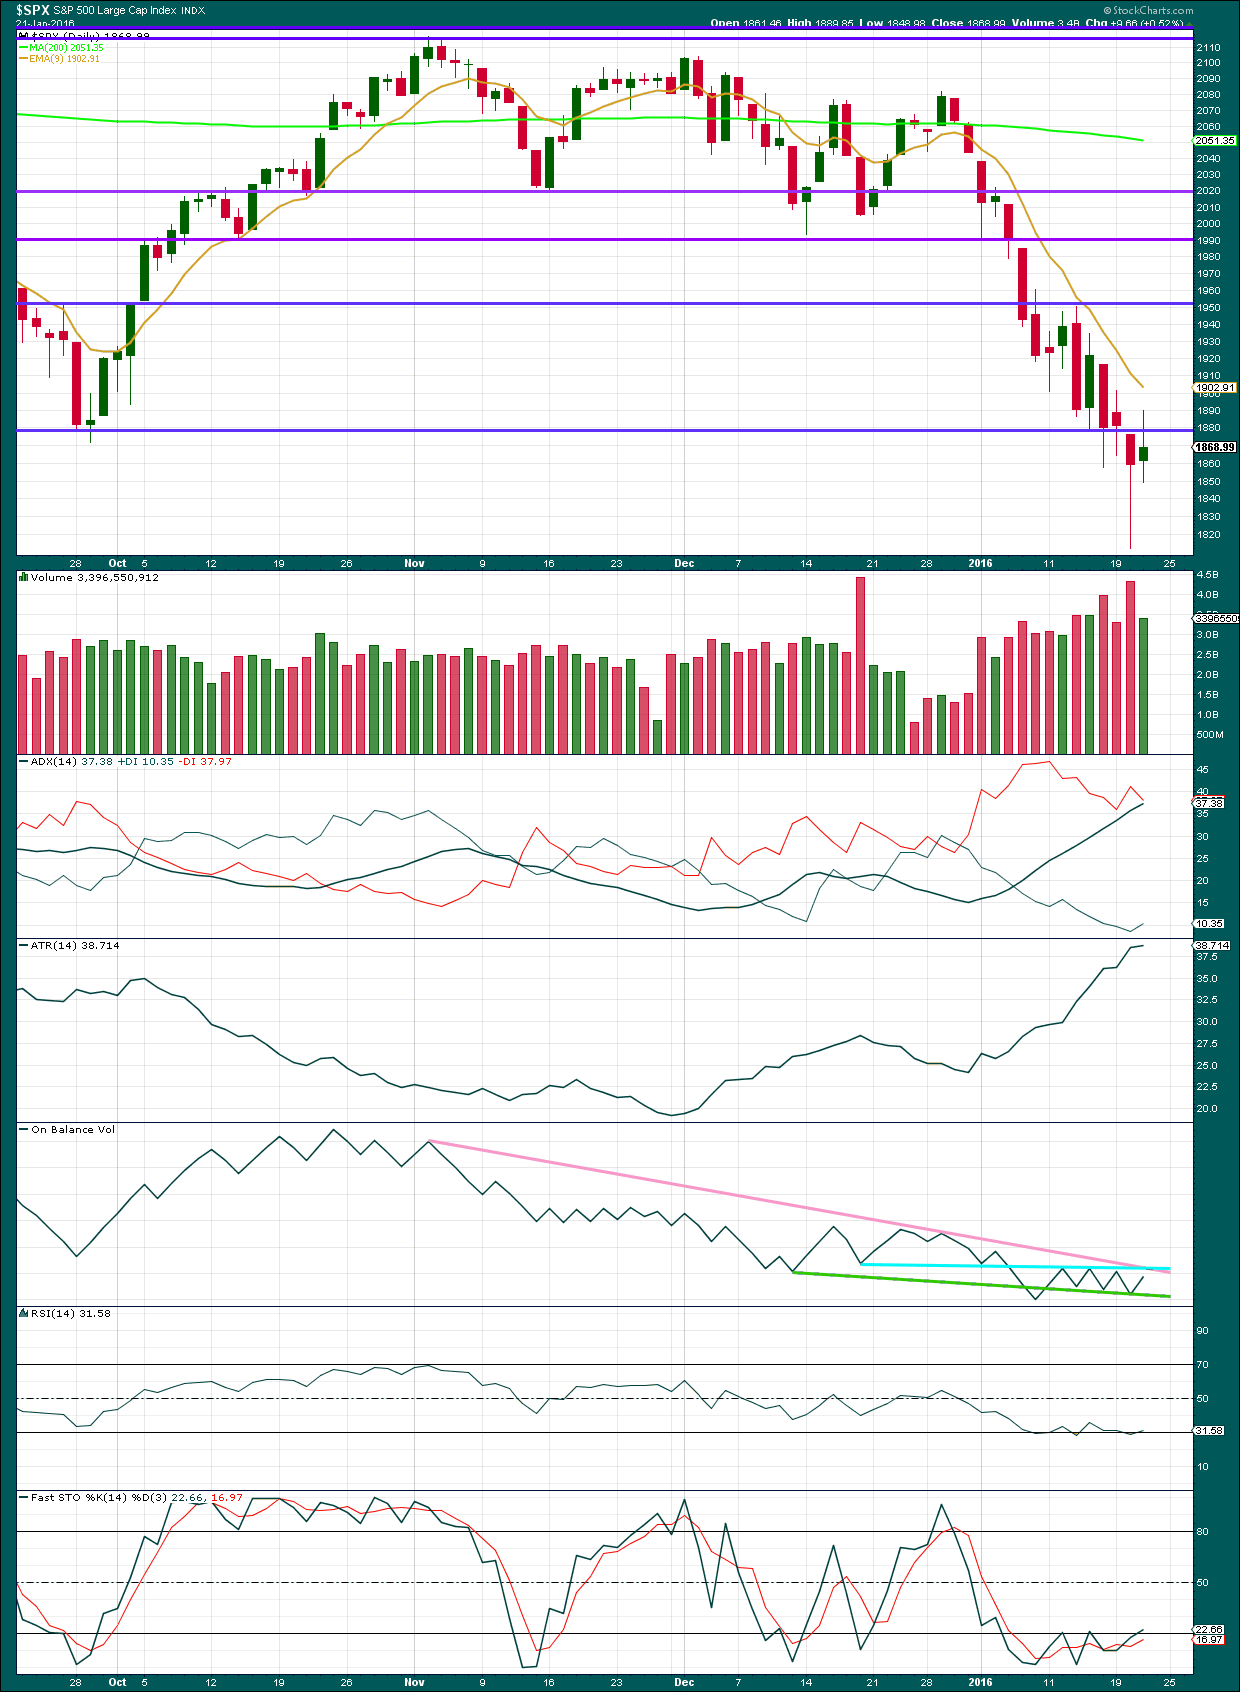
Click chart to enlarge. Chart courtesy of StockCharts.com.
A small green candlestick comes again with lighter volume. The volume profile remains consistently bearish. Price was not supported by volume.
The bulls put up a good fight today, but it is unconvincing. They moved price higher but could not keep price at the day’s highs. The bears managed to push price back down to leave a long upper wick on the daily candlestick, with a small real body. This candlestick is not convincingly bullish. But then, it is only one candlestick.
The green candlestick for Thursday may have resolved the hammer candlestick for Wednesday. Plenty of examples of a hammer in a downtrend followed by only one or two weak upwards days can be found.
ADX and ATR still agree. There is a trend. The trend is down. Expect upwards corrections along the way to find resistance at the 9 day EMA.
On Balance Volume has turned upwards. Any further rise in price may be contained by OBV, if it comes to touch the cyan trend line on OBV.
RSI and Stochastics can remain extreme for some time (particularly Stochastics) during a trending market. Divergence is what these two are most useful for at the daily chart level at this time. Today’s upwards day may have resolved RSI slight divergence, or it may need a few more days of an upwards correction to do that.
VOLATILITY INDEX (INVERTED)
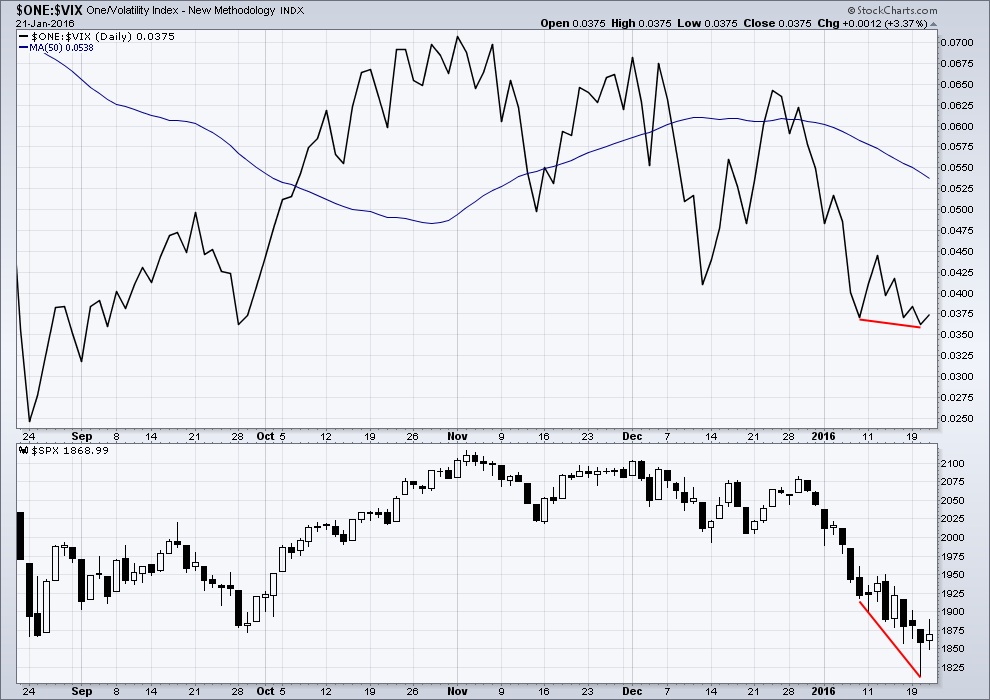
Click chart to enlarge. Chart courtesy of StockCharts.com.
Short term VIX divergence is often a reliable indicator of corrections. There is no divergence between price and VIX today. This supports the main hourly Elliott wave count.
ADVANCE DECLINE LINE
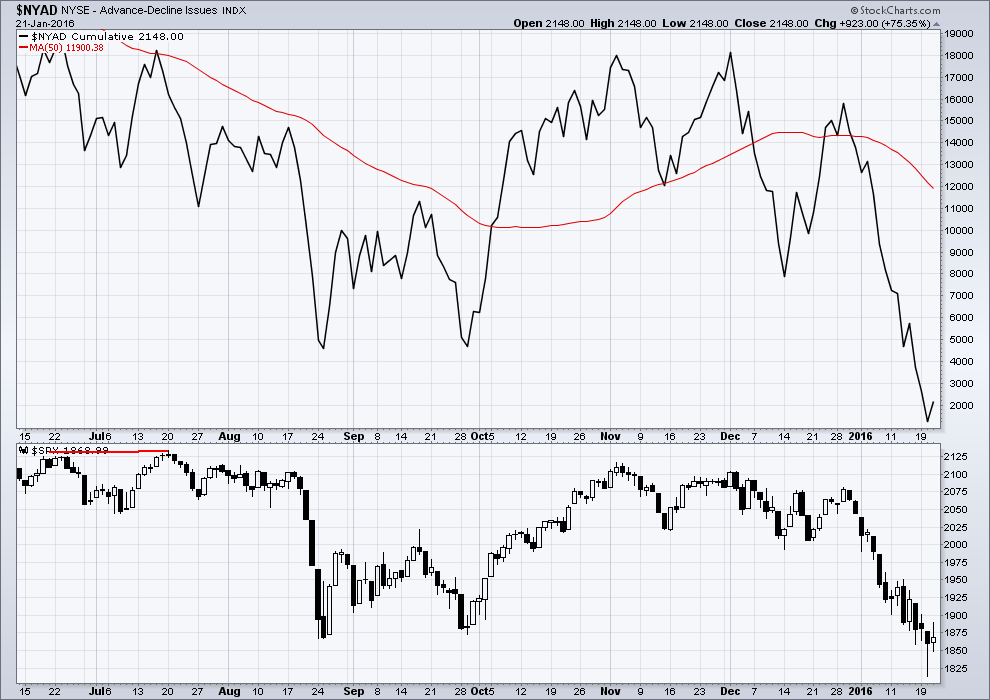
Click chart to enlarge. Chart courtesy of StockCharts.com.
There is no divergence between price and the AD line. The fall in price is supported by breadth. This supports the main Elliott wave hourly count.
DOW THEORY
For the bear wave count I am waiting for Dow Theory to confirm a market crash. I am choosing to use the S&P500, Dow Industrials, Dow Transportation, Nasdaq and I’ll add the Russell 2000 index. Major swing lows are noted below. So far the Industrials, Transportation and Russell 2000 have made new major swing lows. None of these indices have made new highs.
At this stage, if the S&P500 and Nasdaq also make new major swing lows, then Dow Theory would confirm a major new bear market. At that stage, my only wave count would be the bear wave count.
The lows below are from October 2014. These lows were the last secondary correction within the primary trend which was the bull market from 2009.
These lows must be breached by a daily close below each point. So far the S&P has made a new low below 1,821.61, but it has not closed below 1,821.61.
S&P500: 1,821.61
Nasdaq: 4,117.84
DJT: 7,700.49 – this price point was breached.
DJIA: 15,855.12 – this price point was breached.
Russell 2000: 1,343.51 – this price point was breached.
This analysis is published @ 07:41 p.m. EST.
We’ve dropped out of the upwards channel from the 1812 low for the first time – but someone seems to want to put us back in it right at this moment
Boy I’ll be glad when today’s over. Gonna have a beer for sure this weekend.
These wounds are gonna take some licking!! 🙂
Think I shall be joining you, the wounds are pretty deep this week. I am just glad I held onto a few hedges. To be honest I am not sure how much more I can take
Par for the course tbh Paresh. Without doubt I lost the battle today, but I’ve got my eye on the war.
Best of luck to you buddy – remember every dog has its day. Keep some ammo aside to fight the next battle.
Second that…
A break above 1,901.44 has confirmed a longer lasting rally is in progress.
I will have two wave counts for the structure within this third wave.
If the middle has passed this is a fourth wave for minuette (iv), as per the alternate bear hourly chart above. It really should exhibit some alternation with minuette (ii) and so not move much higher than it is now. It may be a sideways triangle, regular flat or combination. Those three possibilities would be my pick. Sideways movement in a range from 1,812 to about 1,915 for a few more days. This first wave up is wave A and it looks like an almost complete double zigzag, one more high to complete it then down. Invalidation point 1,993.26.
Or….
When I look at the bigger picture and how long this third wave should be I will move the degree of labelling within minuette (iii) all down one degree and see this as another second wave. That is still entirely possible. The invalidation point is higher at 2,081.56. The 0.618 Fibonacci ratio for retracement is 1,978.
So my conclusion: looking at the bigger picture this third wave is not over. It still has to move far enough below the price territory of intermediate (1) which has its extreme at 1,867.01, to allow room for the following fourth wave of intermediate (4) to unfold and remain below intermediate (1) price territory.
This is still a third wave. It has deep quick corrections, but the trend is still down. Corrections are still an opportunity.
We have no confirmation of a trend change yet.
I have looked back at the crash from 2007 – 2009 on the weekly chart to see what happened after weekly hammer candlestick patterns. They were often seen at lows along the way down, but not always. I can see two weekly hammers (16 Dec 2007 and 17 Aug 2008) at the top of waves down.
And so again, the hammer is a warning. It is not definitive. Weigh it up with all other information.
This one may resolve itself in a week or less, or it may take a little longer.
At this stage the correction is just begun, not complete yet.
Thanks Lara! Next week will be very interesting…is the start of ER season, aapl, amzn, googl to name a few techs…depending on future guidance the waves will develop and momentum will build up. For now they’ll park it right on the 1901 pivot point.
So the Daily Bear is thrown out because of a breach of 1901.44 and not necessarily (yet) a close at or above it? Thanks
No. The first hourly bear.
Not the daily.
and to be clear, this is based on the assumption that the start of intermediate wave 1 was at 2134.71 (all time S&P high)? Are there any count scenerios that would invalidate that as the high altogether and also reducing the probability of short/medium term lower lows? thanks
The last bull count was invalidated 7th Jan.
If I can see a new bull wave count which would allow for new all time highs I will publish it. For now I cannot see one.
And I am not going to force it on the basis of two upwards days with light volume.
Boy… You change your view like the wind!
Why do you bother posting? It’s not helpful to anyone.
I honestly thought it would add value. The price action alone today got me convinced especially with the intensity of the melt up and that weekly hammer on the SPX. Surely, it wont resolve in 1 week you think? I thought i would share it. No problem. I could be wrong.
I was referring to this SPX hammer weekly. That is what has me convinced…
If I even take a look at all other hammers we went up 2-3 weeks soon after. See my view now?
My other view was that we could go up into the Fed meeting like we always do. They might pull a wild card about the rate hike schedule based on oil price problems. Pure speculation. That could rock the boats and give us the SPX 2,000 target or 1,993 if you will.
That type of candle stick pattern needs confirmation before you can know the direction with certainty. When the completed pattern that follows fails to confirm, you get an explosion in the opposite direction.
k thanks.
Jack
I ran the 50% fib and it tags around 1950ish. Question – usually in your experience does that sound like a good retrace before the plunge or would 1918 suffice? I have been following Northman Trader and he has a target of 2,000+ since that is the moving average reconnect. Doesn’t that change the picture for this decline or would you be still looking for a fail at 1918?
Ace – 38% for bear market
As you know, nothing out there is ever going to be 100%. No one really knows.
Having said that I am feeling good today. This upside move is going to alleviate a lot of oversold technical indicators and set us up for another downside move.
My humble 2 cents:
Bear markets mission is to cause maximum destruction of wealth. It is not setup for all the Bulls to create wealth riding the bull market to the top and then change positions to the shorts at the top and create further wealth riding the bear to the downside. No that is not it. They are going to be some folks that are going to make money in the bear market, but also even more people that are going to lose money. In the bear market IMHO the first and outmost mission should be capital preservation, then maybe making some money on the short side. IMHO people with a lot of cash in the bottom of a bear market are going to make a lot money because they have cash to buy things very cheap.
I agree with the indicators. After today – I further want to add actually that SPX 2,000 is a very important point level. My hunch based on what I can see is that we should get to 1993-2000 within the next 2 weeks or sooner. It is at that critical market junction that things should get interesting. Market breath today was really good supporting short term bullish case as well. In my market experience that 13 days sell off we just had and the reversal was a clue this past week. The amount of stocks down to up would not allow any more selling to occur. It was just mathematically impossible as one analyst to keep on selling…
Have a great weekend!
Verne
Have you ever seen a weekly hammer not play out?
What about that hammer now? Is it still a head fake?
The information you are asking for is in the charts. Look at the weekly chart of the 2007 – 2008 crash. Look at the start of the movement. You will see two weekly hammers at the top of downwards waves.
So the answer is in the charts.
No. They don’t always mean a trend reversal.
Thank you.
Thanks Lara! My sentiments exactly. Well, it looks like the bulls managed to hold onto their hides for the time being. Mid and long term short positions hardly budged with today’s pop. Short term hedges popped nicely today but gave some back with short term trades. Still adding to mid and long term short positions. I remain bearish!!
Going long USO. Taking advantage of this pop to add new short positions in small caps. The best is yet to come ya’all! Don’t let the banksters get you down. Keep building mid and long term positions to avoid the near term gyrations- they are meaningless so far as the larger trend is concerned. IT REMAINS DOWN!!
Have a great week-end everyone!!
Hello
All
I took a survey if we are going to 1900 yesterday and well here we are.
SPX 2,000 ANYONE?
Oh heck why not:
SPX 2,050
SPX 2,100
Your comments and your use of capital letters are offensive to me and add no value at all to this site – in fact quite the opposite imho. No doubt that is exactly how they are intended.
This is the last I will mention the matter – I will no longer respond to or read your comments
Sorry, you feel that way – I had the capital on. It was faster to type. I really did not have that intention. I was learning a ton from the team. Will make sure I don’t put caps on.
I will second that. Please don’t use all caps, it’s the digital equivalent of shouting at people.
And I will also ask please to keep the emotion at a minimum.
Emotion is the enemy of trading. It’s mostly psychological. And so to be influenced by others emotion is not helpful when trading.
Thank you.
I was only asking the trading view targets of levels. It was an honest mistake and was not at all intended to offend anyone. I actually had the caps on as it was fast to type. I was expressing my concern of the move. It was just taking the wrong way somehow – especially on a day like today. Won’t happen again – Sorry!
SPY 15 min Chart with Volume…feels like a holiday
does volume mean anything?
what matters is price…S&P is currently up 1.66%. So, depending on your entry and exits will determine your profit or loss. If anybody had a crystal ball they wouldn’t be looking for answers.
so spx 2000 is on deck.
just my hunch….
if that is your hunch you ought to be loaded up on calls and/or SPXL
i plan on it Monday at the 1st hour when we pull back to 1880-75
This is THE GREATEST BULL MARKET IN HISTORY
NOTHING CAN STOP IT! 🙂
Some people must have the patience of a Saint
You aren’t the ACE from the $RAD board are you?
Yep – add that to RSI on my chart below . Paints a picture!
Barry
My point about volume was that in this market volume has not played a role from my perspective to dictate price. I am also not on that RAD board. I have noticed that this market is just well very unstable. Just when I thought it would turn it went the other way and the world markets are on fire now. I was bearish but now bullish. The hammer on the SPX weekly is to big to ignore imo. I could be wrong and am open to comments. Hope that helps!
Verne
What is your take on the invalidation point?
Looks like a 5-3-5 off five down so far….close of gap from yesterday at 1869.99 would seal the deal…
off to run a few errands…
The top today could be top of wave 3 of the rising wedge (you noticed) up from 1812.17, with wave 4 currently in progress for a wave (c) move up from 1812.17 – that would resolve wave 3 being shortest and make quite alot of sense to me.
It would mean we have been in a sideways correction since 1901 a few days ago (1901 would be top of wave (a), 1812.17 end of wave (b).
From 1901 to 1812 looks like a 3 wave structure to me
In summary down or up from here?
Looks like SPX 2,000 is in short term cards to me. I am not that advanced I have to admit! JUST THE SIZE OF THE WEEKLY SPX HAMMER WORRIES ME!
possibly up a little bit more, but nothing major. (c) already made it above (a).
(b) very much longer than (a) so it might not work
*Idea* attached
Check out RSI – enuff said!!
thanks.
what time frame is this?
I think it was 5 min
Thank you for your contributions Olga.
IMHO we’re in the 1700s folks just don’t know it yet.
That is a good joke.
So seriously, what is your upside target on this move?
We could be setting for a MULTI WEEK BOUNCE TO 2050 HONESTLY!
What is your take on that?
upside target 1918 max
downside target 1790 (personal target)
Thank you. I am really not feeling good at the moment – probably something I ate yesterday to be honest.
I have to go get something to eat!
be back
Your count expecting extended 5th’s Jack? Or do you have a different count to Lara?
This move is steep for a 4th wave imho – again no alternation with wave 2 at all unless it started from further back (maybe 1901 a few days ago was top of wave a, 1812.17 was bottom wave b, and wave c now back up)
The abc you are describing makes sense. 1790 is where I am planning to take some profits based on some numbers I ran in the past…
Primarily, what I am looking at is if we break 1820 then we’re going to be camping out in the 1700s. The trend is down, and IMHO I don’t think we have enough liquidity out there to support a prolonged rally.
Jack
Can you please explain that weekly hammer on the SPX? Is it significant in your experience? I am just not quite sure and seeking understanding.
Yet another bearish rising wedge on one minute chart; probably prelude to another sharp break to the downside…
Man – yer zooming into some fine detail right there! 🙂
Here’s a little inside baseball…banksters and governments HATE short-sellers. The Chinese put people in jail for doing it and if you make too much money in US markets, the SEC will charge you with insider trading or some other trumped up charge to make an example of you. These guys are expert at ferreting out traders’ stops and taking them out. I am starting to wonder if they also don’t have their own stable of Elliotticians…nuff said…
I think it’s also worth noting that all market analysis is a game of probability not certainty. Lara would be the first to admit that her counts could be wrong – she publishes what she sees in good faith and with vast experience.
That’s why we have stops / invalidation points and its important to use them otherwise we have no powder left for when the right count shows itself.
Its also worth mentioning that following the wrong count can still make you money (up until the point it morphs into something different).
All things being equal, EW is the best shot at getting it right more often than wrong imho.
We still have Lara’s wave 4 count which I feel uncomfortable about (for the same reasons Lara pointed out) but that certainly does not make it wrong
Vern, if you go back to the money men of years ago it was a known secret they used astrology, more recent has been numerology so I would expect big money players certainly use EW.
To all more experienced traders than me,
I have not posted a comment here since August when I heavily shorted the SPX. Back then we THOUGHT we were in a middle of a huge 3rd wave down, with apparently four or five 1,2 waves stacked behind each other… And we saw the market turn around back to its all time highs and stay there for 6 months. And all the wave counts changed after the market went convincingly back above 1900…
The question is, how is the market any different now vs. then? How do we know we’re not seeing the same thing that happened about 6 months ago from August 24 lows…
I’m still on the sidelines looking for a good time to TRY to get some of the money back that I lost 6 months ago… I’m still waiting… I thought I had missed my chance with the market plunging this month. But there are always opportunities…
Thanks,
Ari
Fact is Ari, we don’t know for sure. All we can do is exercise discipline in following our stops when the market tells us we are wrong. I left 100K on the table last August because of that crazy truncation and a weird UVXY spike in the middle of a fourth wave, something I had NEVER seen in many years of trading UVXY. I wish you all the best, and do sympathize with the feeling of getting ambushed…been there many times…hang in there…
I feel your pain Ari – had my back side handed to me on a plate with this move up today. Great to hear back from you.
Not easy being a bear but our time will come – If you are seriously wounded I would just sit on the sideline waiting for low risk entries (i.e. entries very close to invalidation points).
Is very much easier said than done, as the market will convince you that it will invalidate and you are throwing your money away. That may be the case quite often, but there will be occasions when you are right – throw the kitchen sink at those times and ride it all the way to the end (don’t leave too much on the table).
Again – this is very much easier said than done – our emotions are totally against us in this market.
Good points Ari.
So, are we in the middle of the third wave down now or NOT?
I am confused?
Not sure but it does not matter. All I know and care about is the TREND. It’s down…no confusion about that Ace..
I dont know. We could RETRACE THIS WHOLE MOVE DOWN BACK TO 2,116 TO BE HONEST!
I really have no idea what is going on NOW.
How can the trend be down if we are moving so FAST UP?
Huh??!! Have you ever heard of a time frame options? That is a very strange question for a trader, don’t you think? 🙁
UVXY starting to do the COBRA COIL…did you say that folk ACTUALLY SHORTED that beast?? Lor’ have mercy…!! 🙂
Does anybody believe a red candle today is out of the question? I don’t….
yes i do
Yer’ on…I bet you five cents…with five to one odds so you only have to put up a penny! 🙂
This next move down needs to step on the gas if it’s gonna be a wave 3 rather than a wave c – RSI divergence so we might still be in wave 2 (or b) at very small degree
I can see that happening!
The voracious marketing of a “market recovery”/”bottom is in” view from the Davos soothsayers has been in full force! They have officially all exhausted their ammo the last few days in this regard. They probably have been all selling what they could into this rally.
Bingo!!
Bingo means? You said you wanted a RED DAY? Was that serious?
Printing mini five down, three up…
Yeah…yeah…of course the bulls and banksters are not going to go quietly but hear me now and believe me later…THEY’RE GOING!!! 🙂 🙂 🙂 HE! HE!
Target is probably 2,140 man!
SPX 1877.50 and that’s a wrap…!
Next SPX 1887.50…recent shorts already comfortably in the green!!
Adding UVXY calls…
I’m now fully back in the game for richer or poorer. Let’s see what structure this move down carves out
Olga, I wanted to send you an e-mail but didn’t want to ask for it over the forum…the heck with it…e-mail me..
Cool!
Does anybody remember what the overnight futures in global markets looked like Tuesday night this week? We sometimes have really short memories.
As Yogi would say – Deja Vu all over again…! 🙂
Hi,
All
TODAY IS A DAY I AM NOT REACTING AND I DONT HAVE CONVICTION EITHER WAY!
I HOPE YOU ALL HAVE A GREAT WEEKEND!
THANK YOU FOR YOUR COMMENTARY!
THANKS,
ACE
ACE, this from a friend…YOU ARE WAY TOO EMOTIONAL ABOUT THE MARKET!! 🙂
probably.
You would be to, all the moves I have been through!
THIS IS NOT A DOWN TREND I AM AFRAID?
Look for bulls’ conclusive surrender of both round number pivots in DJI and SPX in downside break from rising wedge…UVXY starting stealthy climb back toward 50.00 🙂
did you say they SHORTED it???? WHOAA!!!
I think that wave 3 of the rising wedge from 1812.17 is shortest (if I’m looking at the same thing as you). But we’re on the same page in any case
Planning on scaling in some (more) short positions as we meet certain prices (I’m already in at 1880)
Intend on adding at 1914, 1920, 1932, and if it doesn’t reverse at that price then again at 1953.
FTSE has broken through 5915 area and i see that as opening the door for AT LEAST 5955 but quite possibly 6000 again and I would also expect to see the SPX in the 1932 to 1953 range at that time.
Also of the opinion that a short on FTSE at 6000 would be a great play. I’ll be throwing what ever i can at that if it gets there…
Hi Stuart – I noticed Alison on here is also trading FTSE via LSE. Do you trade on LSE? I was wondering about the stamp duty situtation on there (i.e. how you can make a decent living when you are taxed 0.5% as soon as you purchase a position). Or are the ETFs you trade exempt (assuming you trade LSE)?
I’ve thought about trading FTSE but just can’t get the figures to stack up, especially as there are plenty of other indexes without the stamp duty. So just wondering how frequent traders get around that
Hi Olga,
I don’t trade FTSE via LSE, in fact all of my trades are placed as spreadbets via IG index.
In the UK – where I’m based – that activity is (currently) tax free provided it is not your primary income, but is not without it’s disadvantages either…think Swiss franc debacle!
They offer ETF’s but i’ve never used them to be honest. There is some more info about their charges on the link below if you fancy reading up to see if this approach is of any use to you.
https://www.ig.com/uk/stockbroking-charges-and-fees#Stockbroking
Just want to point out i am in NO WAY promoting IG. I use them as my broker but would i recommend them to anyone? Errrm, that’s another story..
Thanks Stuart – thought there must be some way around it. I use Interactive Brokers so can usually get hold of most stuff – will take a look.
I’m based in Isle of Man part of the year (i.e. when it’s warmer!!) so just across the water from you!
Looking for break from wedge to first downside target of 1895.00, followed by break of 1887.50…
You kidding or something? Just look at that candle so far today you probably want to examine it again. 1895 is NOW a very low probability.
Yep – will be re-shorting the half I sold below 1894.91 as originally planned – might turn out to be just a scalp (if move down from there turns out to be 3 waves). But this move up looks about done to me for now.
Below 1894.91 it’s wave 5 of (c) up is not extending
So headline news goes something like this: market goes up because of hope of banksters manipulation (farther ECB stimulus comments) and oil price recovery which also went up because of hope.
So the key word here is hope. Anytime market goes up because of hope it turns around and comes back down.
Next level of upside resistance is 1918, this is going to close the gap in that area that is if it gets that high.
We need to look at these bear market rallies more objectively. Then, maybe we be able to avoid a couple and even make some money from couple of them.
Jack,
Is that gap 1916 – 1922 from Monday’s open?
With the gap and the next resistance at 1918, seems to me that is a good target to add to shorts. Thanks a lot.
This is last Friday’s gap down open.
We might not even go that high…
excellent point…
That’s right. I forgot Monday was a holiday. Thanks.
2140 is NEXT!
They rattled quite a few short positions today…too bad. Hard to imagine anyone believes anything coming out of the mouth of a fraudster like Draghi…
Agreed…banksters don’t mind taking bears money
Can anyone post volume figures for this move up? Was it on strong volume or vapours?
Short sale ban just appeared on UVXY (Interactive Brokers). Means alot of people are now shorting it. Should be interesting!
You’ve got to be kidding. Shorting UVXY, a derivative monster on steroids in this market environment? WHY DON’T THEY LET THEM JUST SHORT IT??! dummies…. 🙂
This explains why it has been declining as the markets have been retreating…amazing!!
Broke 44.50 and recovered immediately…standing pat…
all
2,140 back on deck now?
I’ve still got a huge problem that this could be a 4th wave after no alternation between so many second and forth waves, and a third which did not appear. Third waves at this degree should literally leave you breathless.
I think once this plays out a bit more, what appeared to be 1’2’s at lower degree are part of a larger degree 1,2 with the wave b finishing at recent lows.
Yep! I am still seeing a bearish rising wedge on multiple chart time frames…
Olga
At this point do you favor 1993? or just 1950-1960?
From Lara’s analysis:
“When minuette wave (iv) turns up it should last a Fibonacci 5 or 8 days in total.”
We are in the third day if you count Wednesday when the minuette (iv) started.
Thank you Rodney. I must have over looked that!
All
IT IS VERY IMPORTANT WHAT HAPPENS TODAY!
THIS CHANGES EVERYTHING!
MY QUESTION TO YOU ALL IS THIS THE 3rd WAVE ? I am NEW to 3rd WAVES ON SPX – AND INDICES . PLEASE EXPLAIN
Well you won’t get much better risk / reward than shorting right now – I’ve just shorted a bit more.
Now very much underwater on yesterdays position, and gone into margin which I *never* usually do, but there you go. Will see how it goes very shortly I think
She’s looking weak, but will she turn around??? The drama!!! He he….
This move up looks like a c wave to me
Sold half my position at a loss – will re-short under 1894.74 short term.
This still looks corrective to me atm.
Well I’m gonna need a good days trading at some point to get that loss back!!
Wounded but still very much determined
Me too. They not only have to plant a flag on these round number pivots- they also have to HOLD them. Whether they can accomplish that feat remains to be seen…the bears are not quite done yet – not by a long shot…UVXY line in the sand holding so far…
With all due respect to the esteemed ladies on the forum, these are the kinds of mind games that separate the men from the boys in this trading environment. I could be wrong, but UVXY saying to short the you-know-what out of this pop so that is exactly what I am doing…
could you please elaborate on how you are viewing the UVXY action?
A bit too complicated to go into detail on the forum; I’ll be happy to send you an e-mail after the dust settles Barry…hope you don’t mind.
you mean short SPX?
Verne
I am sorry but there is NO RESISTANCE here.
1905 and pushing matey!
Removed following you editing your comment to a more suitable one
I think the obvious situation was the grand down reversal on WED. Plus the hammer was the clue. I changed up my mind but that was the wrong thing to do and i am not even trading at all now. Just sitting on the side lines.
I agree this is NOT going down now.
Before you make up your mind, watch UVXY 44.50. If the bulls break it, I agree we are probably going higher; how much? hard to say but higher nonetheless IMHO…
Lara
What is your measure for multi day bounce? Does that mean 1-2 days or 5-8 days for this statement below?
“A new high above 1,901.44 would indicate a multi day bounce has arrived” which may not move above 1,993.26
Good morning Ace and all.
Lara has the confirmation point of 1901 for minuette (green) iv for the short term. Then 1993 becomes the invalidation point for the counter trend rally of minuette iv. But it is not a target.
She shows the completion of subminuette a (orange) around 1900 then subminuette b moves to around 1880 followed by a subminuette c to complete the minuette iv at the 38% retracement point of 1915. She also shows the 62% retracement at 1979 as a level to watch.
I agree the question remains ‘When do we add to our short positions?” I am thinking this counter trend rally has the purpose of driving out shorts just before a much bigger leg down to complete minute iii around the 1775 mark or lower. Then we will have a larger more time consuming counter trend rally to complete minute iv.
We could also see a triangle develop for minuette (green) iv. That might frustrate the most people and drive out the weak hands.
Thanks to all.
k thanks rodney!
Yeah but the problem is what happened to this 3rd wave ?
Are we in a 3rd wave still ?
Verne and Olga
The whole world is green today. If we clear 1901. The odds favor 1950-2000 now. That could take weeks. I wonder what you both think now?
We are getting nothing but more surprises to the upside now.
The short term trend to me for weeks looks like it is UP not down.
All that matters is what the market DOES not what we think. Invalidation points exist for a reason- they tell us when to act, and when not to…
ok thank you….
I am sure quite a few traders are going to scalp this potential upside move for a short day-trade. I will be cashing in hedges and taking an itsy bitsy position on the open if I get filled at the right price. There is nothing wrong with taking what the markets (and banksters!) give. Anyone contemplating going long this market at this juncture needs to have their head examined IMHO. DJI 16000.00 and SPX 1900 will give us a strong short term indication…stay frosty! 🙂
Verne
You are kidding right? do you use fib to trade?
This move up is gambling. It has the potential of 1950-1960 but i am NOT playing it long.
But Seriously what some of us thought about the hammer is now playing out. I am afraid this is going UP to 1960 with no doubt!
This can’t be a third wave now right?
The banksters keep on making huge cash dumps into DJI futures around the 16,000 pivot and every time they get slammed by the bears…it is really TOO funny to watch… 🙂
Algo trading using fake free endless digital dollars.
Very interesting point for those that are short:
The charts above indicate, regardless of whether we breach 1901.45 that we still have a vast amount of downside imminently as a (b) wave OR as a Wave iii.
Surely this is a time to be bold rather than fearful?
Ali
Keep an eye on UVXY. Current bid is 45.30. It may hit that or slightly below at the opening before starting a slow climb back to parity. Look for it to again clear 50 to confirm end of current counter-trend move. A break below 44.50 would imply a more protracted counter-trend move.
Futures yet to crack 1900.00
Jack
In 3 trading days the spx moved 181 points both ways.
I don’t know how today will close but odds look green based on the rest of
The world.
Are you of the idea spx 2000 is the target here into the fed ??
Possibly another psychological bull/bear battle around round number pivots in DJI and SPX…they may be temporarily regained, I seriously doubt they will be maintained…
It is kinda funny how the banksters think one day of jacked futures will undo the carnage underway. These markets are walking dead men…
I have looked back to Jack’s call of a counter trend rally to 1950.
This looks a very good call now.
Ali,
Yeah, Jack has some really good calls. I think he has tons of market experience.
Verne
How long you estimate this run to last? Into the FED next week WED?
Hi
All
Please help me understand something.
If we close above 1901 and the target is 1993.
How could this be a multi day bounce ? This weekly candle would be massive that usually has a few weeks follow up that could take 1 month.
Am I missing something about weekly hammers ??
Does probability favors a few weeks to get there ?
The bottom is in I think ?
Is this a third wave still ?
This was a surprise to the upside.
The only question is how we close.
This bounce could last for weeks if it holds. That’s the right look on a weekly candle of a massive hammer!
How will people play it if we pass invalidation?
Sell immediately and get long, or await a pull back?
If we pass invalidation, look for hourly bear alternete. at 1901 you have confir mation to go more up…. but the way is down .
“sell limt” In 1903 opportunity for future contract with a short stop. hope….
The one area missed in the “volume” assessment is the SPY dropped just under the Aug low with SIGNIFICANTLY less volume on both a daily and weekly. Many times I find this creates a big dead cat bounce. Longer term trend still looks down.
R/Kevin
Co-ordinated bankster jack up of futures. Don’t fall for it…unless you are a skilled day trader, and even then, I would be careful…
Their firing power is great and if we are in a Bear Market it can’t last forever. Problem is how much powder we have left to support existing positions and to add more as the wave pans out. The safer re-entry point seems a million miles away and the range has made it difficult to trade.
Maybe that’s just me?
Nikkei up 6%
Not sure what else it will take to get us over 1901 but we are kinda getting close based on current futures level….
Rising bearish wedge on futures 1 hr chart. Break from it should be sharp…
I don’t know but it doesn’t make sense to me
Is this still the third wave ?
hi
all
We have been here before but not sure what happens by the CASH OPEN.
15 handles higher ES NOW!
Hi
All,
Are 4 weeks of downward price action to much to continue lower? Or is getting 1-2 weekly white candle’s up o.k in this run down?
I tried to look at the past and we had plenty of sell offs that lasted 6 weeks in duration but plenty that bounced after 4 weeks.
I am worried about how this weekly candle closes this week.
TOMMOROW IS VERY IMPORTANT. IT COULD MAKE THINGS TRICKY!
SEE MY POINT?
Just asking around…
On the daily bear, why do we use 2.618 the length of intermediate wave (1) to calculate the 1,428 target of the 3rd wave? Is there a certain significance to that fib rate?
Thank you.
“Intermediate wave (2) was a very deep 0.93 zigzag. Because intermediate wave (2) was so deep the best Fibonacci ratio to apply for the target of intermediate wave (3) is 2.618 which gives a target at 1,428.”
In my (limited) understanding I also think that with so many 1,2’s (nine now) and the degree of labelling, wave 3 (if that count is correct) should be very extended making 2.618 x W1 much more likely than the usual 1.618 x W1
From my point of view I’d be quite happy just to see momentum & volatility pick up a bit atm
Simply because the more common ratio of 1.618 would not see intermediate (3) move far enough below (1) to allow room for intermediate (4) to unfold and remain below (1).
Because intermediate (2) was so deep.