
Price moved lower as the preferred hourly Elliott wave count expected.
Summary: The middle of a big third wave should be approaching. The wave count expects a further increase in momentum. This view has a higher probability than the alternate which expects a bounce here. A new high above 1,901.44 would indicate a multi day bounce has arrived. It may find resistance at the cyan line on the daily chart and may not move above 1,993.26.
To see how each of the bull and bear wave counts fit within a larger time frame see the Grand Supercycle Analysis.
To see detail of the bull market from 2009 to the all time high on weekly charts, click here.
Last published monthly charts can be seen here.
If I was asked to pick a winner (which I am reluctant to do) I would say the bear wave count has a higher probability. It is better supported by regular technical analysis at the monthly chart level, it fits the Grand Supercycle analysis better, and it has overall the “right look”.
New updates to this analysis are in bold.
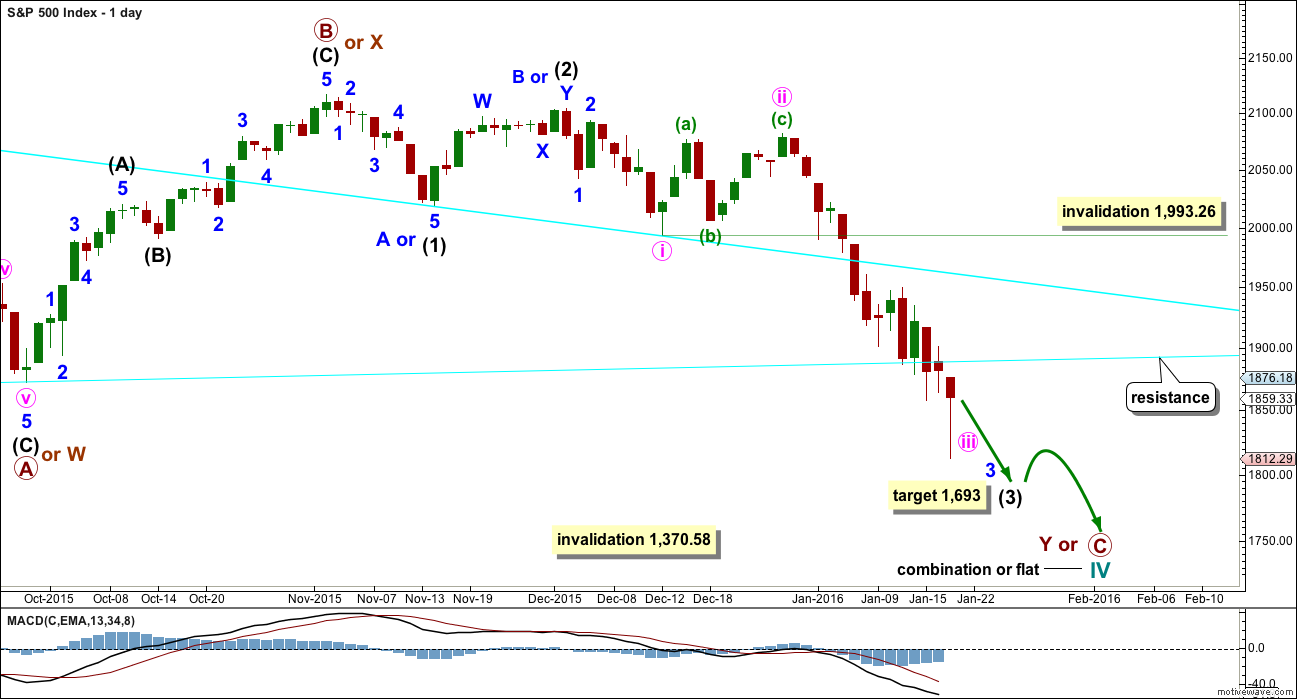
BULL ELLIOTT WAVE COUNT
DAILY CHART – COMBINATION OR FLAT
Click chart to enlarge.
This wave count is bullish at Super Cycle degree.
Cycle wave IV may not move into cycle wave I price territory below 1,370.58. If this bull wave count is invalidated by downwards movement, then the bear wave count shall be fully confirmed.
Cycle wave II was a shallow 0.41 zigzag lasting three months. Cycle wave IV should exhibit alternation in structure and maybe also alternation in depth. Cycle wave IV may be a flat, or combination.
Cycle wave IV may end within the price range of the fourth wave of one lesser degree. Because of the good Fibonacci ratio for primary wave 3 and the perfect subdivisions within it, I am confident that primary wave 4 has its range from 1,730 to 1,647.
Primary wave C should subdivide as a five and primary wave Y should begin with a zigzag downwards. This downwards movement is either intermediate waves (1)-(2)-(3) of an impulse for primary wave C or minor waves A-B-C of a zigzag for intermediate wave (A). Both these ideas need to see a five down complete towards the target, so at this stage there is no divergence in expectations regarding targets or direction.
Primary wave A or W lasted three months. Primary wave C or Y may be expected to also last about three months.
Within the new downwards wave of primary wave C or Y, a first and second wave, or A and B wave, is now complete. Intermediate wave (2) or minor wave B lasted a Fibonacci 13 days exactly. At 1,693 intermediate wave (3) would reach 4.236 the length of intermediate wave (1).
Minute wave iv may not move into minute wave i price territory above 1,993.26. It may end when price finds resistance at the upper cyan line.
Price broke through support at the cyan trend line which is drawn from the August lows to September lows. This cyan line may now provide resistance. It is copied over to hourly charts.
HOURLY CHART
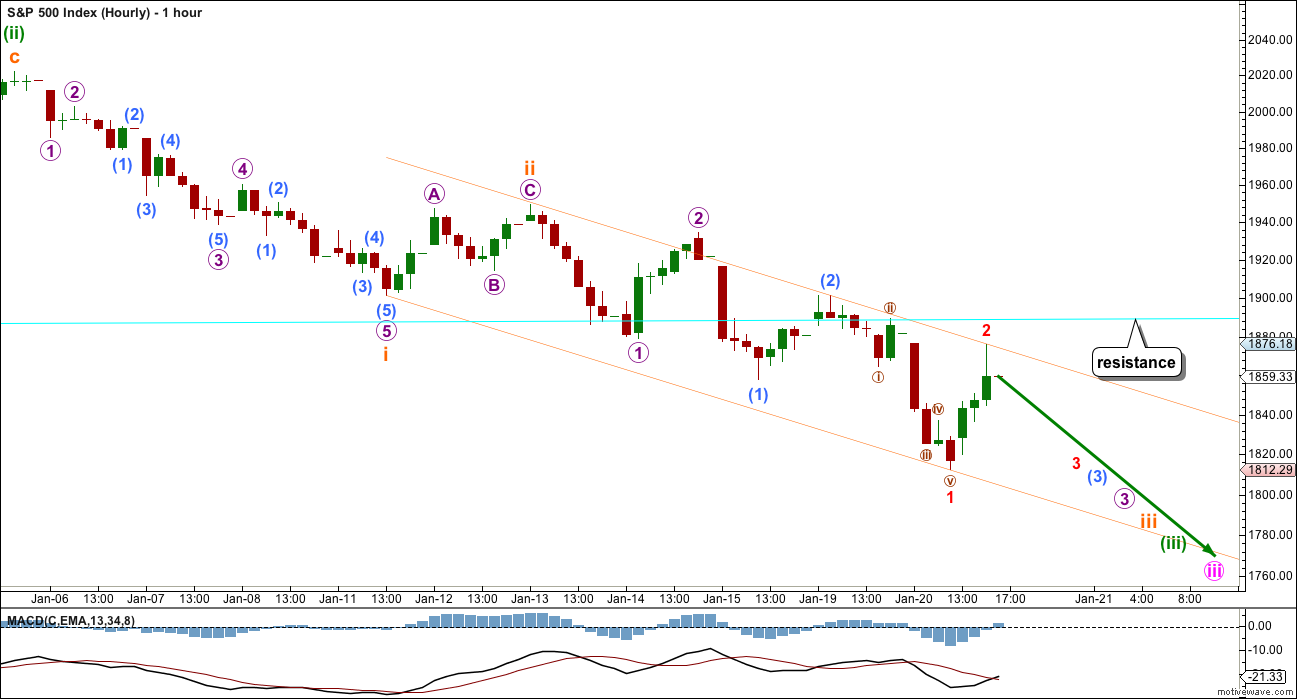
Click chart to enlarge.
At this stage, the bull and bear wave counts are essentially the same at the hourly chart level. Commentary will be with the bear wave count.
BEAR ELLIOTT WAVE COUNT
DAILY CHART
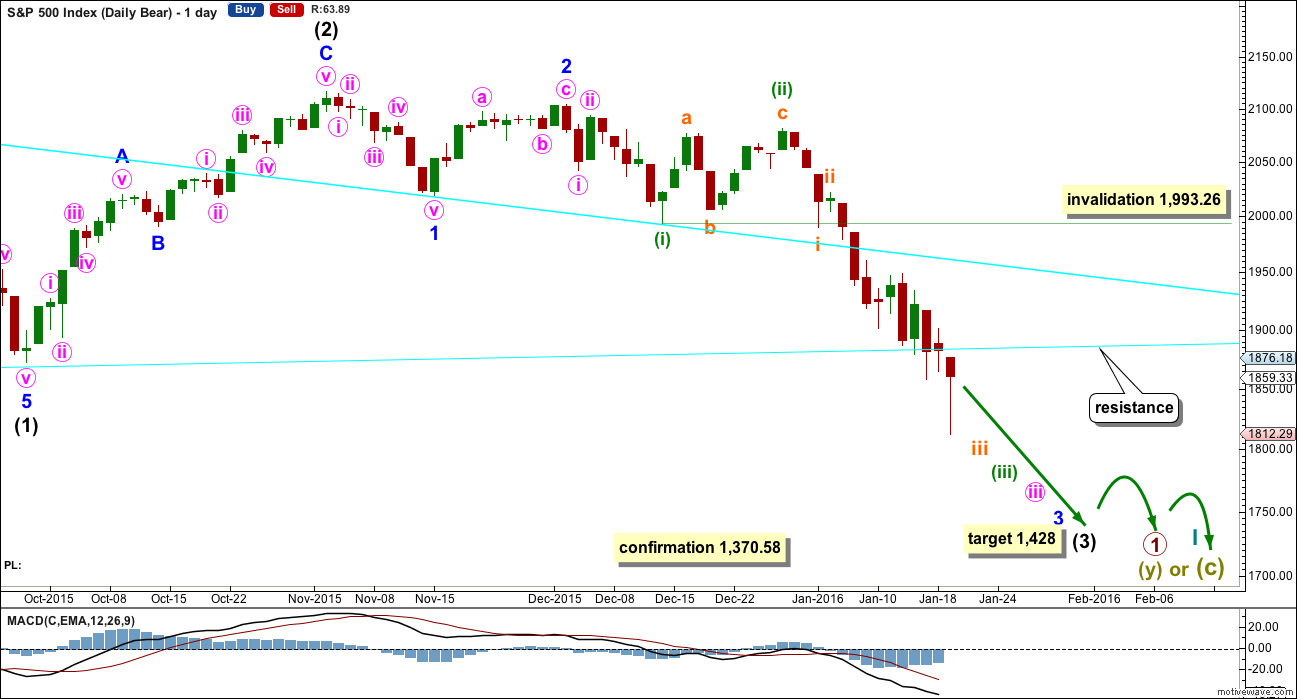
Click chart to enlarge.
This bear wave count fits better than the bull with the even larger picture, super cycle analysis found here. It is also well supported by regular technical analysis at the monthly chart level.
Importantly, there is no lower invalidation point for this wave count. That means there is no lower limit to this bear market.
The downwards movement labelled intermediate wave (1) looks like a five.
Ratios within intermediate wave (1) are: minor wave 3 is 7.13 points short of 6.854 the length of minor wave 1, and minor wave 5 is just 2.82 points longer than 0.618 the length of minor wave 3. These excellent Fibonacci ratios add some support to this wave count.
Intermediate wave (2) was a very deep 0.93 zigzag. Because intermediate wave (2) was so deep the best Fibonacci ratio to apply for the target of intermediate wave (3) is 2.618 which gives a target at 1,428. If intermediate wave (3) ends below this target, then the degree of labelling within this downwards movement may be moved up one degree; this may be primary wave 3 now unfolding and in its early stages.
Because minuette wave (ii) was a deep correction of minuette wave (i), it would be expected that the correction of minuette wave (iv), when it arrives, should be shallow against minuette wave (iii). Minuette wave (iv) may not move into minuette wave (i) price territory above 1,993.26.
Intermediate wave (3) today shows a further increase in downwards momentum. It is now just slightly stronger than the end of intermediate wave (1) (the August 2015 low off to the left of this chart). A further increase should be expected. This supports the first hourly chart below.
HOURLY CHART
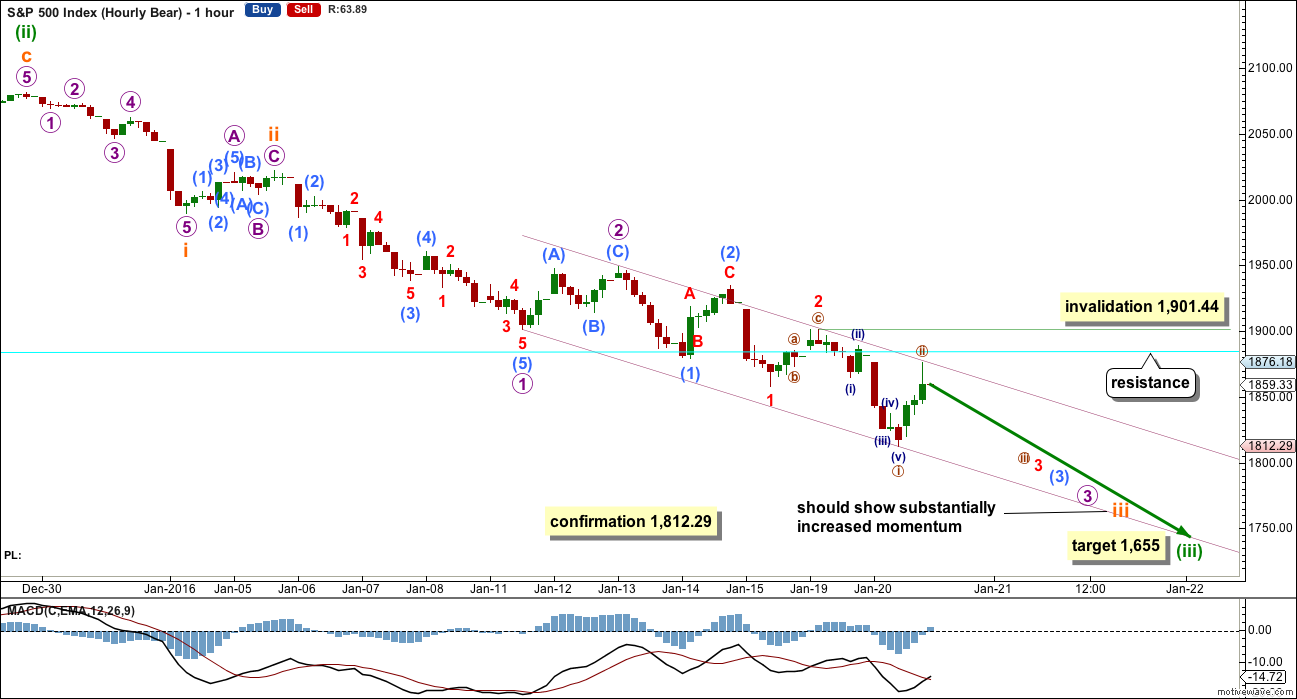
Click chart to enlarge.
So far all the corrections along the way down are zigzags. None of subminuette wave ii, micro wave 2, submicro wave (2), minuscule wave 2 or now nano wave ii can be seen as anything other than single or double zigzags. This supports this first hourly wave count; they all look like second wave corrections.
Nano wave ii may not move beyond the start of nano wave i above 1,901.44.
The violet channel is an acceleration channel about this middle of this third wave. Draw the first trend line from the end of micro wave 1 to the last low, then place a parallel copy on the high of micro wave 2. Upwards corrections should find resistance at the upper edge of this channel. This perfectly shows where Wednesday’s bounce ended.
If that trend line is breached, then the cyan line copied over from the daily chart should provide resistance.
The target for minuette wave (iii) remains the same. At 1,655 it would reach 4.236 the length of minuette wave (i).
ALTERNATE HOURLY CHART
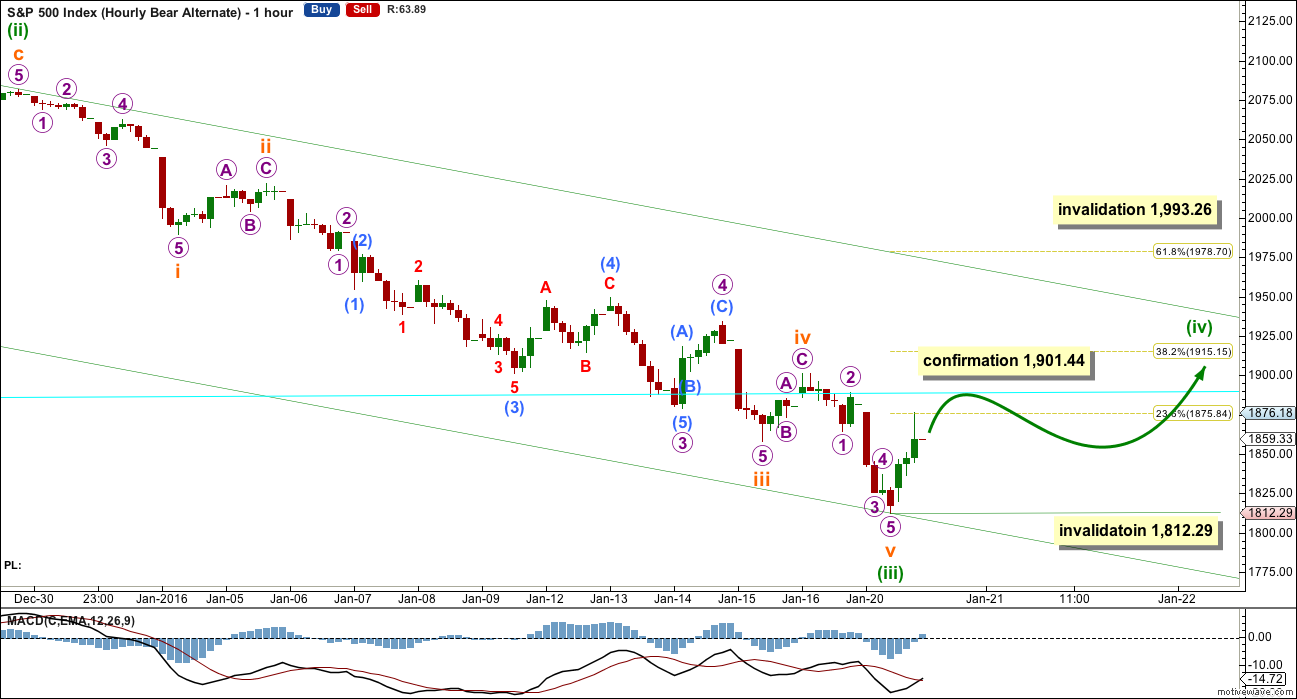
Click chart to enlarge.
What if the middle of the third wave is over?
Minuette wave (iii) would be 5.95 points longer than 2.618 the length of minuette wave (i).
Ratios within minuette wave (iii) are: subminuette wave iii is 15.45 points longer than 1.618 the length of subminuette wave (i) (this is just less than 10% the length of subminuette wave iii, so I consider it an acceptable ratio, just), and subminuette wave v is just 3.07 points short of equality in length with subminuette wave i.
There is inadequate alternation at all wave degrees for this wave count which substantially reduces its probability:
– Subminuette wave ii was a shallow 0.35 zigzag; subminuette wave iv is a more shallow 0.26 zigzag.
– Micro wave 2 was a shallow 0.27 zigzag; micro wave 4 was a still shallow 0.49 zigzag.
– Submicro wave (2) was a deep 0.61 zigzag; submicro wave (4) was a deep 0.64 zigzag.
Minuette wave (ii) lasted 10 days. When minuette wave (iv) turns up it should last a Fibonacci 5 or 8 days in total. It may not move into minuette wave (i) price territory above 1,993.26.
This wave count requires a new high above 1,901.44 for confirmation.
Within the early stage of minuette wave (iv), no second wave correction may move beyond its start below 1,812.29 tomorrow.
On balance this wave count is a possibility, but the probability is lower than the first hourly bear wave count. It is the complete lack of alternation in structure between three sets second and fourth waves which substantially reduce the probability of this wave count.
TECHNICAL ANALYSIS
DAILY CHART
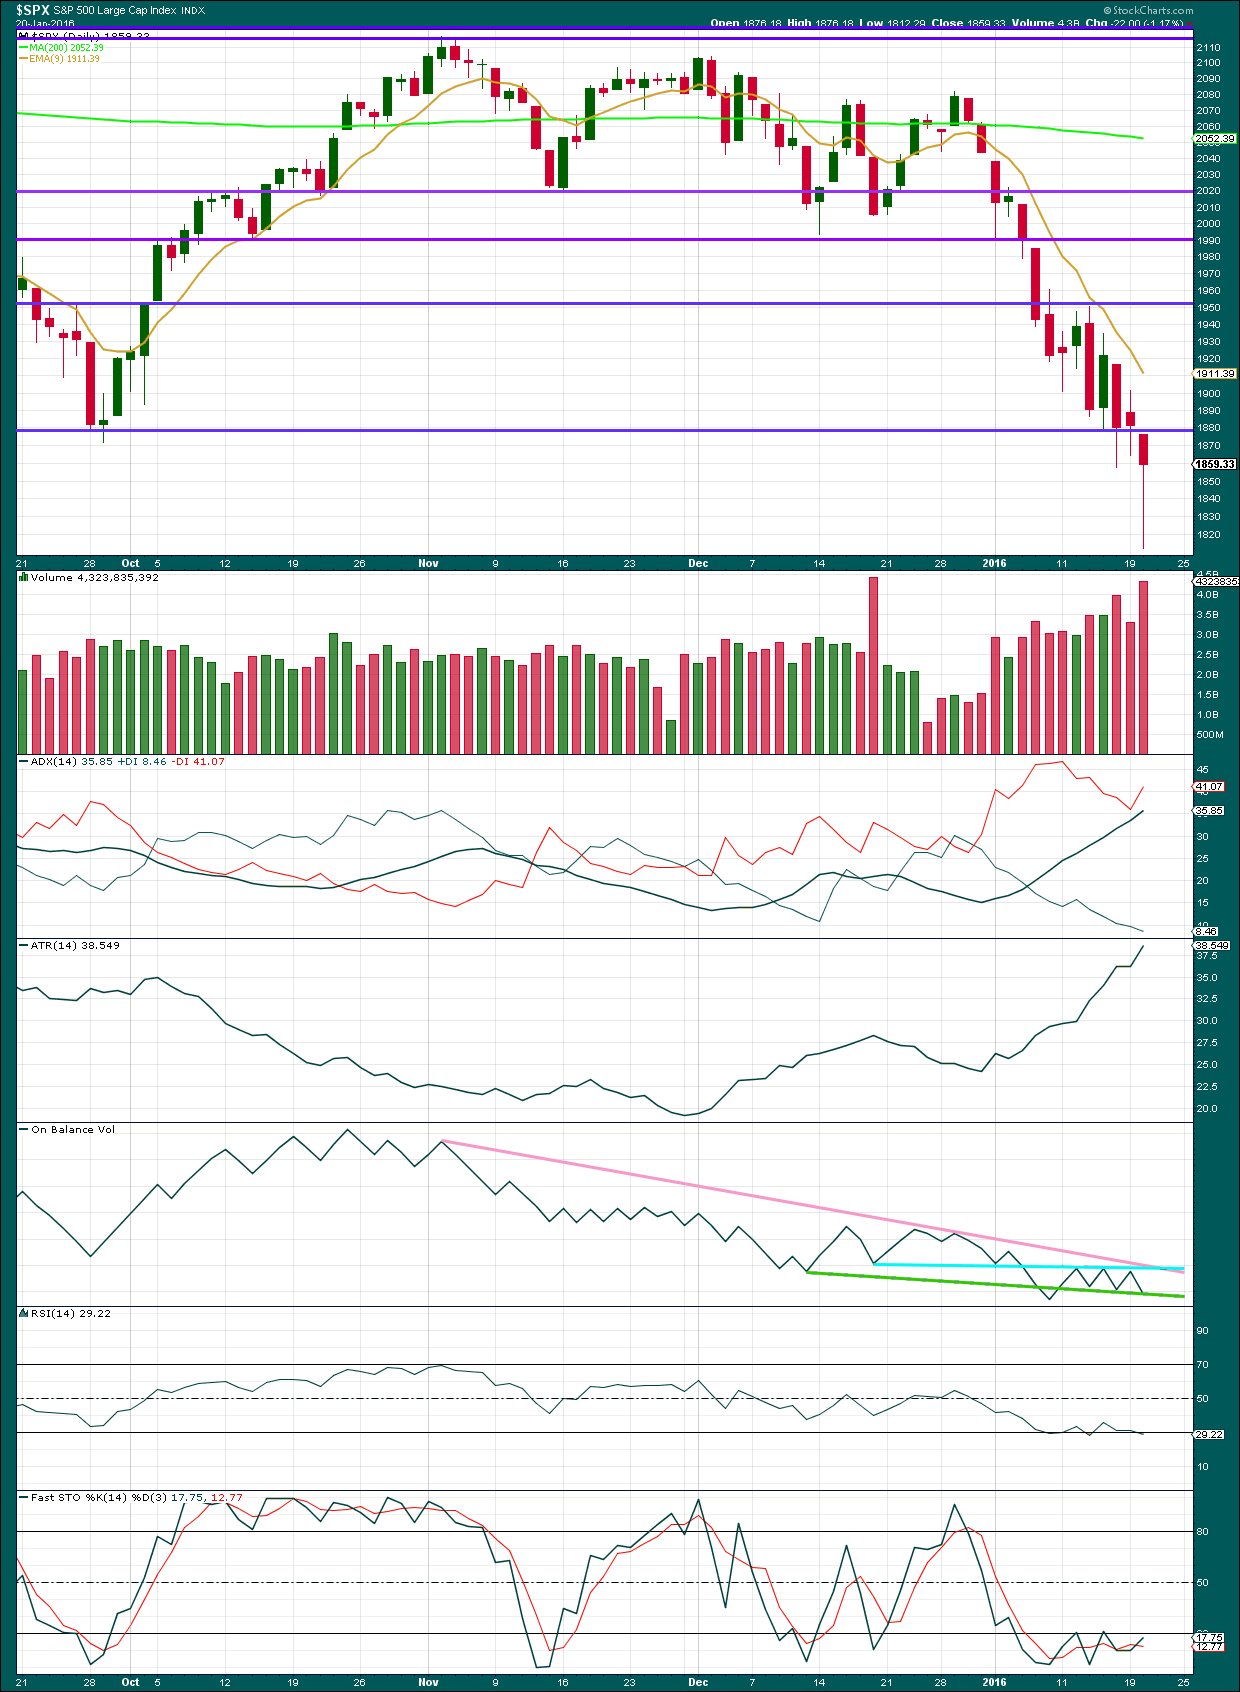
Click chart to enlarge. Chart courtesy of StockCharts.com.
The strong hammer candlestick for today’s downwards session is concerning.
I have looked back at the last large bear market of 2007 – 2009 and bull market corrections from 2009 to 2014. During the bear market there were several hammer candlestick patterns which were followed by only one or two upwards days; they were resolved quickly and did not indicate a major trend change. Occasionally hammers show up and are followed by a downwards day. Examples are on 20th February, 2009, 3rd August, 2011, and 8th May, 2012. There may be others. I also noticed hammer candlestick patterns at the ends of intermediate degree waves. Sometimes this pattern does indicate a major trend change.
Hammer candlestick patterns are warnings; they are not definitive. They often work but not always. This pattern should be weight up with other technical evidence.
Today’s session again comes with stronger volume. The volume profile remains consistently bearish.
ADX and ATR remain in agreement. The market is definitely trending. Expect corrections to find resistance at the 9 day EMA.
On Balance Volume bounced off the blue line again. It has come to sit on a new green line. If it bounces up from here, then the blue line should provide resistance and help to hold down price.
There is weak slight bullish divergence between today’s low in price and RSI which failed to make a corresponding new low. This supports the idea of a small bounce about here.
There is clearer divergence between price and Stochastics today which supports the idea of a small bounce about here.
VOLATILITY INDEX (INVERTED)
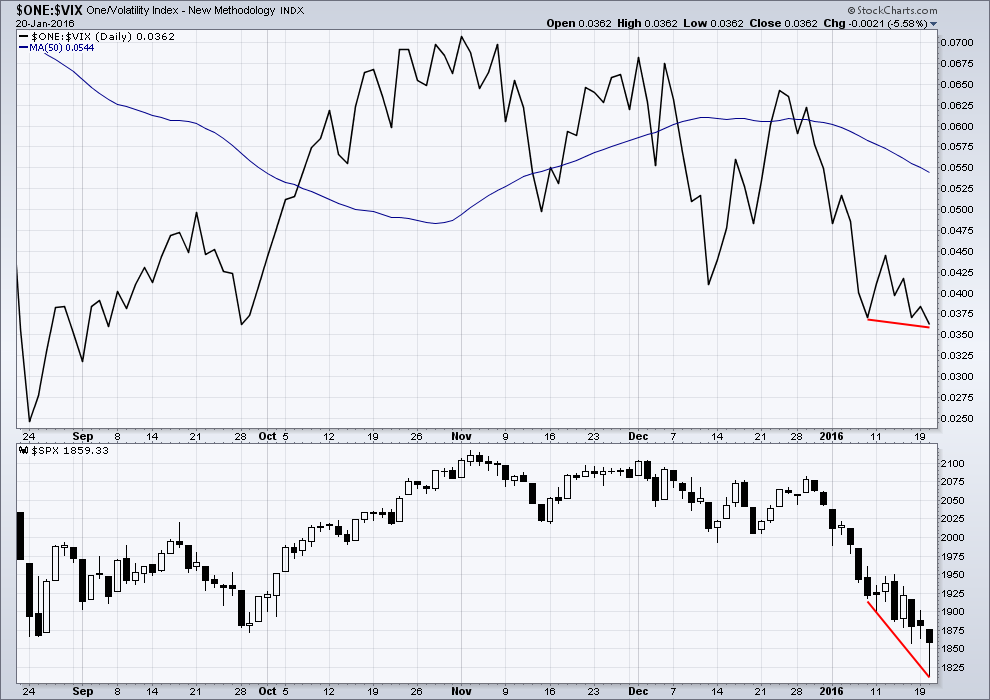
Click chart to enlarge. Chart courtesy of StockCharts.com.
Short term VIX divergence is often a reliable indicator of corrections. There is no divergence between price and VIX today. This supports the main hourly Elliott wave count.
ADVANCE DECLINE LINE
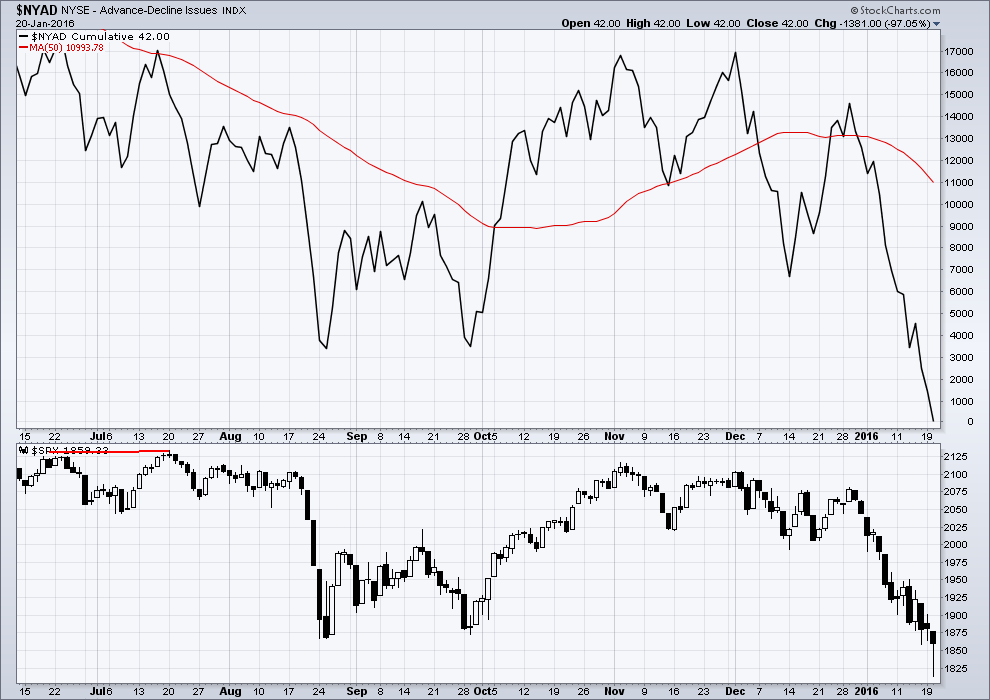
Click chart to enlarge. Chart courtesy of StockCharts.com.
There is no divergence between price and the AD line. The fall in price is supported by breadth. This supports the main Elliott wave hourly count.
DOW THEORY
For the bear wave count I am waiting for Dow Theory to confirm a market crash. I am choosing to use the S&P500, Dow Industrials, Dow Transportation, Nasdaq and I’ll add the Russell 2000 index. Major swing lows are noted below. So far the Industrials, Transportation and Russell 2000 have made new major swing lows. None of these indices have made new highs.
At this stage, if the S&P500 and Nasdaq also make new major swing lows, then Dow Theory would confirm a major new bear market. At that stage, my only wave count would be the bear wave count.
The lows below are from October 2014. These lows were the last secondary correction within the primary trend which was the bull market from 2009.
S&P500: 1,821.61
Nasdaq: 4,117.84
DJT: 7,700.49 – this price point was breached.
DJIA: 15,855.12 – this price point was breached.
Russell 2000: 1,343.51 – this price point was breached.
This analysis is published @ 09:47 p.m. EST.
My 2 cents.
I could post chart after chart that shows this scenario:
1) A series of relentless declines that takes price below previous support (think 1820-1860 S&P)
2) A hammer after breaking said support meaningfully
3) A follow-on day that does not hold for more than 1-2 days (e.g. price breaks the hammer low within 1-2 days)
All of this precedes every major market crash (20% – 30% down within 5-15 days).
We have that scenario *right now* …except for #3.
What does this tell me? If we are in a nano 3rd (nine embedded 1-2s), and the market unleashes the middle of this wave 3, then holding short for 15 more measly days will vindicate every loss you ever incurred being short during this banskster driven bubble of a market.
Good luck.
Corey,
Thank you and that sounds great. I am so glad you posted this.
Very insightful!
You heard the man! Get Shorty! er…I mean SHORT..! 🙂
Verne
This tape is tricky!
The only thing is we have been down already so many weeks. Look at the spx.
I’m starting to get worried about this weekly candle!
Did you see it ?
Hope you are right.
This upward move looks like it’s about done to me – but I’ll bet they hang on long enough to close well into the green.
Keeping the dream alive for just one more day. That can ain’t gonna kick itself…
uhh — those mysterous buyers I tell you. 7 years wasn’t enough…
A massive sell off in the last hour of trading would be welcome change and provide some nice alternation with the usual rallies…. Just a thought…
…as i dance round my office doing the bear dance.
Be sure to post us a link to the video of that dance!
Looks like five down from the highs, some sort of expanded flat with another manic wave C? One has to certainly give the bulls an “E” for effort… 🙂
what time frame ?
Poss just completed a small degree 5 down so we *may* bounce up a bit here – hopefully in a 3 wave structure
what is the target?
Blimey – you’re not very demanding are you? 🙂
Once b is done (it may be in b now), I’ll take a look.
I can also count the wave down as corrective so I’m being cautious
EDIT – c = a @1877.59 – which is also close to the 61.8 fib retrace
Below 1867.15 right now is where the move is proven 3 wave
BTW – I’m not sure that small degree targets are going to be very accurate. For me 1867.15 is more important atm as it gives me a 5 down 3 up trigger
New Targets –
(c) = (a) @1881.20
76.4 fib retrace @ 1882.62.
61.8 fib retrace @ 1878.25
Wave (b) low @ 1866.70
Again I think 1866.70 is currently the important level to watch at this very small degree
o.k, thanks a bunch! Comparing my notes…
FYI we just passed under 1866.70 so that would be my buy signal with a stop at 1876.67 (as again this down move could be wave (b) of a larger degree abc up).
But in any case we should eventually see a new low below 1859 now as this up move looks corrective to me.
Keep in mind that this move up could also be wave (b) of an abc down at larger degree !! 🙂
ditto buddy!
Well I see that little blast upwards as corrective – but it might have only been wave (a) of an abc. My guess is that it will only be (a) so they can keep us guessing right into the close.
It’s also possible to count it as a 5 wave structure with a long wave 1 but that look a little odd to me.
JUST LOOK AT THAT VIX HAMMER!
‘Yer can’t touch this….’ 🙂
https://www.youtube.com/watch?v=otCpCn0l4Wo
A note on Dow Theory:
(if I put it in a reply to the comments below it may be lost)
Yesterday the S&P reached below 1,821.61 but could not close below.
From Dhalquist and Kirkpatrick, “Technical Analysis”:
“Confirmation in the Dow Theory comes with both the industrial and railroad averages reach new highs or new lows together on a daily closing basis.”
Price needs to close below 1,821.61 for the S&P to confirm a bear market.
Verne and Olga
ON THE 1 HOUR SHOOTING STAR REVERSAL @1889.85?
Look for UVXY to climb back into the green prior to the close. My upside hedges from yesterday hardly budged…
NICE!
My position is already looking alot healthier – lets hope it stays that way.
My internet just went off – always picks it’s timing just perfect
Awesome!
Please get that internet fix.
I notice it is when you need it most things happen …
I only ever have internet problems in USA. Every other country (including obscure ones) are always fine. Brighthouse networks are terrible in my experience, but there is not much more choice where I am
Like magic – THE VIX TREND I SENT THIS MORNING HELD. NOW SPORTING A HAMMER!
Only down -4.5% from -8%
NOT BAD!
I notice that price is right on that lower cyan line. When I draw that carefully from the October 2014 low to August 2015 low it is touched right now.
What happens here will be indicative. If that line is breached I would favour the alternate idea of a fourth wave correction. If it holds I would favour the first preferred idea of a series of first and second waves complete.
I still have a really big problem with the complete lack of alternation in the alternate hourly bear chart. For there to be no alternation in structure or depth for not one but three sets of second and fourth waves…. it is possible. Alternation is a guideline not a rule. But the probability must necessarily be really low.
Furthermore, the S&P just doesn’t always sit nicely within channels. Which makes it really hard to trade.
The price point at 1,901.44 is the key.
I agree that this move up looks typically corrective. The only question is, how much higher will it go before it ends?
Thanks Lara
Closing gap at 1881.33 filled. This move corrective IMHO. No need for consternation just yet. Weak hands being shaken out, as is the custom…shorting the move…again! 🙂
Just waiting for us to fall out this up moves channel – will then throw what little bit of dry powder I have left at it.
We’re on the edge of it – will it get saved again???
I knew the banksters were at work when I saw all of Europe, including FTSE up considerably overnight. I would not be at all surprised to see us close near today’s highs. They also expended a phenomenal amount of buying power coming off yesterday’s lows. It must be nice to have that kind of disposable cash. This is the way they roll…
It must be nice to be able to sleep despite pushing unborn taxpayers into further debt.
We might just need one more pop higher to finish wave 5 of zig zag (c) of (Y). I now have end (X) at around 1849.30
Well we’ve not so much fell out as wandered out the channel atm. Move in both directions lacks any kind of conviction atm
Yep!
Love your choice of words 🙂
I think panic is more like it!
Please don’t tell me the bottom is in……..
Well honestly at this point it is how we close this week!
I honestly have no idea!
I know it’s difficult but we don’t know yet! We are almost right there at the invalidation point so until we clear it or stall and reverse here it is anyone’s guess!
I favor a high probability we reject here but I don’t know and it is at that moment in my experience when you let go of an idea and then it plays out to the down side :/
Stuart
HANG IN THERE MATEY!
THIS IS GETTING INTERESTING!
MARKET JUST DROPPED 10 SPX points in a blink of an eye 🙂
Hi
All
Is it me? Or is it every time the BEARS Manage to break this market somewhat it just keeps on some how , some mysterious way being stalled?
Euphoria -> Denial -> Fear
I think I’m always in denial of being long or short at times
:-/
SPY 10 minute..Price pays, BUT ramp up on decreasing volume
No volume no problem for now I guess. Lets see at the close. This is a VERY INTERESTING AREA!
UHH THOSE BULLS…
Thanks for that – I seem to have an issue getting good volume figures on my trading platform (Interactive Brokers). Very useful information
When combined with RSI divergence this up move is internally very suspicious
Hi
All
I am taking a survey now.
How many of you think we take out 1900? Just based on what you see today?
I don’t think so – lots of RSI divergence. If we do then I am suspicious about the wave counts being correct – for the third wave to have passed already doesn’t ring true with me
Copy that. It is amazing how just 1 day of price action can force me to change my mind.
I am still a student of the markets…
Jack
What is your take on this move so far today? You think it still has legs for a run past 1900? or not sure?
Past 1900 is going to be difficult. RUT2000 closed negative today.
IMHO the best way to get a good glimpse of what we’re going to have in terms of selloff is to look at RUT2000.
I’m taking some *serious* heat atm. Don’t know how much longer this market can go on frustrating the bears. We should really be reaching a point where it cuts us some slack.
The amount of deep retraces is beyond the pale
I agree. I am always taking heat on this market. I dont day trade only position so for me I wait at times throughout the contract life I have no choice but to wait and see and even then it can all change in only 1 day.
SURPRISE TO THE DOWNSIDE IS WHAT I LIKE!
It is just so regretful when you see price move against you so fast like your profit situation this morning. I totally understand…
All part of the game – no risk no reward.
Just need to get it right more often than wrong 🙂
Verne
As always we wait for the close on a grand surprise reversal up day like this before drawing a conclusion.
OUCH this is moving just grinding it WHATEVER IT COST AND I ALWAYS QUESTIONED SHORT COVERINGS BUT THAT SEEMS TO BE THE EXPLANATION EVEN AFTER 80 points higher? Hopefully the BEARS can claw back…
This move up to relieve market compression is entirely normal and sets us up for the next leg down. To treat this as a genuine trend reversal this far below the massive overhead around 1900 would be quite pre-mature I think…big hammer yesterday notwithstanding. Still way too much complacency for a true interim bottom…
Dangerous times….
OIL UP ON A MASSIVE SHORT SQUEEZE!
I think SPX should hit a wall at 1890ish?
Its struggled to break 1890 so far. Lets hope we end flat and then the start of the next leg down begins. As we have all said Fridays do not make lows, Monday beckons again and hopefully the bears push down
Reloaded short term diamond puts on the last pop via the ever prudent “stink bid”…they generally go right into the money shortly after being filled and are low risk trades in this environment… 🙂
UVXY put in a low of 48.94 so look for it to start creeping higher as the day goes on…
Vern–what’s your definition of “stink bid” ?
Any open order at least 50% below the current bid….yum! 🙂
Glad Verne and Olga are part of this site and write daily. They both combined add so much membership value! Great to have them here!
You are so very kind…thanks man…in good company!
Ditto
As tempting as it may seem, I would not chase this “rally”.
The most counter-intuitive for traders to do is sell bear market rallies, Ninety percent of them won’t do it. 🙂
where is your line in the sand? 1900? till you sit on the sidelines?
That’s easy, just look at the wave count. The invalidation point for the current bear configuration is 1901.44. The bulls are doing their best, but this market is having a difficult time picking itself up off the floor… they are not exactly threatening that pivot…
right…
The thing like you said the market is having a hard time moving up but look at it now just moving right back down…
I will!!! 🙂
This price action looks like that one Monday we had gone down to 1,900 and reversed and then went upto 1,950 the next day to go back down to 1,900 the new few days..
Verne
VIX doing a gap fill today and we have one more possibly then blast higher???
Looks like a good spot to add to short position.
Market up, UVXY up….
Above 1868.19 and we’re probably heading higher – hopefully not above 1901 though!!
Someone doesn’t want the party to end just yet.
EDIT – there she blows. 1868.19 could have been the end wave i down & iv up – so we might still be ok if this doesnt go above yesterdays high
UVXY positive again on only a small move down with the market still up – is a good sign.
Bulls obviously getting a little nervous (as are a few bears on here no doubt!!!)
Possibly going for the gap fill – fib 76.4% retrace of the wave down to yesterdays low is at 1880.47 which would all but fill yesterdays gap.
One more pop higher (imo) would make this move up a double zig zag correction with wave x at about 1836.85
Good call Olga. Nerve recking to watch this grind higher… 🙂
My position has swung over $20K positive and negative this morning (unfortunately the latter atm) – now that’s nerve wrecking!!
I have had even worse days. I can’t begin to tell you my stories. One day when we are done with this correction. I will explain : /
She’s looking mighty tired just now – lots of RSI divergence. If I wasn’t already fully positioned I’d be loading up the truck right now with a stop at 1901
I stumbled across an analyst calling for a bear market rally, I don’t know the guy or his track-record but…he makes some nice charts! Any comments?
http://exceptional-bear.com/resources/The+Big+Picture+Bear+Market+Rally++-+our+Allocation+and+Positioning+Jan+18$2C+2016.pdf
Davey,
I’ve read part of the analysis. I am not familiar with his work nor his counting method. I do not know this person’s track record. While I was reading, I checked back at my SPX 5 minute screen to see we broke out of the channel of yesterday’s rally. This is important and deserves attention.
One difficult discipline of a trader / investor is to stick with what works for them and not let the white noise confuse. I am not saying that this person’s analysis is bad. But I am saying I need to stay with and concentrate on what works for me while at the same time always being open to learn.
Finally, and this is for all subscribers to EWSM, Lara has been very gracious with what she allows us to post on her and I emphasize HER blog. We need to be very careful and considerate when posting information and analysis from other analysts, especially EW analysts. I love all the data, strategies, personal EW counts, indicators etc that are shared here. They are very helpful. But I try to be reserved in mentioning what other newsletters etc are saying. In addition, is the material you posted under a copyright?
Please don’t misunderstand me. I am not trying to be negative or put anyone down. I am just expressing my thoughts. In the end, what Lara allows on this blog is her choice, of course. Me, I enjoy you all. Thanks for your posting, Davey.
Good luck to all and may the Bear be on the attack!
Rodney, the material Davey has posted is a sample posted online for anyone to see. What Davey has done is to just attach the link.
Furthermore, free flow of information cannot and should not be suppressed. I think given that it is good for folks to share their opinion, your opinion is fair to be heard as well like everyone else. So it’s good to know about your thoughts.
Censorship is for insecure folks…free and respectable sharing of information and thought IMHO is the path to greater good.
Jack,
Thanks. It is good to know the material posted is public domain. I know at times I am a bit over sensitive to that issue because I have been ‘hurt’ by it. I also am in favor of free flow of information. But in my experience, it is the rare paid subscriber blog that allows full and complete commentary from other competing subscriber based blogs etc. In t he end, it is Lara’s decision.
This blog has a lot of value added because of all the subscribers who post. I would never want to stifle that because I learn a lot from you all. I’ve been here over four years and the development of the blog portion over the last year has been very welcome.
Bottom line, Davey asked for thoughts and I gave him mine. I don’t know anything about the methods and track record of the analyst.
My only moderation here will be for tone.
I don’t want this site to descend to the depths of YouTube where people are rude and nasty to each other.
If we all maintain a polite and collegial tone then it encourages sharing.
If people are rude then it pushes others out. They won’t share their ideas if they think the’ll be flamed for it.
And I almost never have to remove a comment or direct anyone to the comment policy. Members here are almost universally polite and supportive.
I have no problem with posting links to any other work as long as it’s in the public domain and not protected by copyright.
Hey Rodney, have you been reading my mind perchance? Excellent post and advice worth taking to heart by all of us. While I read literally dozens of other analysts and blogs, there is a good reason why I subscribe to Lara’s work and base virtually all my SPX trade decisions on her analysis. Can you believe she lets me clutter her forum with my innumerable market ramblings??!! 😀
Thank you for sharing the info…we’ve got to keep an eye on a bear market rally. IMHO we’re still not quite there yet (just my opinion for whatever is worth).
We had a good chance for a bear market rally when we completed a complete 5 waves down…what we ended up doing was a little abc last Thursday after that five down. IMHO the wave setup does not, at this time, support a major bear market rally. We know when we get there…before that I’ll like to see a clear nice five down.
Even now at the SPX at 1885? You are still confident we should stall here?
I am still trying to learn about how markets work.
But I am surprised that we just got so much buying or short coverings. All internals are weak.
So, what is your max pain up side potential?
There are so many problems in that wave count I just don’t know where to start…
I can see C waves counted as a-b-c (and they’re not C waves in triangles). They should fives.
I can see a C wave as an expanded flat.
I think I can see a diagonal (this analyst likes diagonals) with a third wave the shortest.
Their diagonals aren’t meeting the rules for diagonals. I think I can see one with no overlap between 2 and 4, not only no overlap but an enormous gap.
That is not Elliott wave. It just…. makes no sense at all.
Do not follow this persons work.
Anyone can put a bunch of letters and numbers on a chart and call it Elliott wave.
But if it does not meet the very clear rules in Frost and Prechter… then it’s not Elliott wave.
It’s worse than useless IMO, it diverts attention and wastes time.
Lara, thanks for the evaluation. I believe this guy is attempting to create some new “improved” EW (if that is possible).
Yeah, I’ve seen that kind of analysis many times.
What it appears to be doing is put a bunch of labels on a chart, call it Elliott wave, ignore all EW rules, ignore EW guidelines, call it “new”.
Do all of the above with no research to support the “new” rules.
I’m not buying it.
I’ve noticed also a second wave that moves beyond the start of the first and a fourth wave within a diagonal that moves beyond the end of the second wave.
So many core rules are broken in that analysis. I do not think it has any predictive value at all.
I respect the wisdom of an EW Jedi !
Whats everyones thoughts on todays moves?
For intermediate wave one down back in August, 2014, downward momentum produced a thousand point range in DJI on capitulation. We are looking at potentially nine degrees of third waves down in a nonet of of first and second waves, and it is reasonable to expect to see the momentum of intermediate one exceeded in intermediate three. Futures not yet reflecting this kind of washout waterfall decline so we may have at least two more days to go…I would not expect an intermediate three down to be contested as happened today…
I have noticed on the S&P that its first waves are often steeper than its third.
The third wave is still stronger once you get to the end of it, MACD will show greater momentum.
But it feels like it moves more slowly. It’s extended in price and time, so the corrections are more time consuming. The second wave corrections in it can be deep.
It feels different, and only once you get toward the end is it really clear.
Anyway, that is how I viewed the middle of the third wave up in the prior bull market. It was so very long, lots of complicated corrections.
It looks like the SPX is following SPX chart from the end of Dec. 2007-Jan. 22, 2008, before we got a bounce for about a week. After the bounce, the SPX continued to decline into the end of March. Just my 2 cents.
crude and futures are rolling over
From the Bear Daily Chart “Intermediate wave (2) was a very deep 0.93 zigzag. Because intermediate wave (2) was so deep the best Fibonacci ratio to apply for the target of intermediate wave (3) is 2.618 which gives a target at 1,428.”
I am very new to the analysis and am trying to follow the math. Here is what I did…Intermediate wave (2) high was 2116.40. Intermediate wave(1) low was 1870.40. This is 246 point up move. To calculate the target of intermediate wave (3) using 2.618 Fibonacci ratio I calculate 644.03 point down from the high of intermediate wave(2) or 1472.37. Your target is 1428. Where did I go wrong with my math. Thank you for your help.
By the way, I’m using tradingview for my charting..it appears the daily high/low values are slightly off on their charts. I wonder why
Welcome Barry!
The target for intermediate (3) is based upon the length of intermediate (1).
Ratios are seen between actionary waves; 1, 3 and 5.
Intermediate (1) was from 2,116.48 on 3rd November to 2,019.39 on 16th November, 97.09 points in length.
97.09 X 2.618 = 254.18
Intermediate (3) began 2,104.27 on 2nd December.
2,104.27 – 254.18 = 1,850.09.
I round up (or down) to the nearest point.
And I just realised the calculation I did there was for the bull wave count.
For the bear this is the correct calculation:
Intermediate (1) from 2,134.72 on 20th May 2015 to 1,871.91 on 29th September (it had a truncated fifth wave) = 262.81 length.
262.81 X 2.618 = 688.04.
Intermediate (3) began 2,116.48 on 3rd November.
2,116.48 – 688.04 = 1,428.44.
Rounded to 1,428.
Thank you this was very helpful to me and I was able to walk thru those calculations. If you don’t mind, why are you using 2.618 as the Fib to calculate the downside target?
The data I am using comes directly from the exchange.
For the S&P the data should be the same, it should all go through NYSE.
I too notice slight differences in my broker data and the data I get via BarChart. I don’t know why either. It really should be the same.
Hi Lara. Thanks for the analysis. You really have a way with the numbers and seeing the waves. Then you are also able to communicate it clearly and concisely. Absolutely essential for me.
One other thought, we have fallen roughly 300 SPX points in this current downtrend. And the news, in my opinion, has not been terribly negative. The fall of oil is getting all the blame. I think we will soon get some other very negative news that will bring on the final capitulation. It is strange but it often happens this way. When the other shoe drops on the economy or some war event or a sovereign debt crisis etc. the so called bottom will drop out of the market. The market anticipates the economy and news.
Thanks again to you and all the other contributors.
I truly believe we’ll bottom when oil bottoms. Lara’s target for oil was $22 8-10 months ago. I don’t know if her target has changed but i believe we should be in the fifth wave of oil.
Thanks Rodney for the kind words.
I searched my local NZ Herald this morning and found in the business section an editorial that basically said this bear market is just a correction and presents a great buying opportunity. That the fundamentals of the economy in the USA are all just fine, and that it won’t mean any recession for NZ.
This was the conclusion:
“This could mean slower growth. But the economy is in fundamentally good shape with both the Government and Central Bank well positioned to stimulate things further if needed.”
Overall I’m seeing positive spins on the markets turning down at this time.
Which leads me to think that this third wave hasn’t passed the middle.
Psychologically it is the middle of the impulse of a third wave which is the tipping point from positive to negative mood.
I think what we are noticing here in the “news” is the fundamental premise of Elliott wave theory; it is social mood which makes the news and moves the markets. Social mood changes come first and are quickly reflected in market movement. News follows market movement.
The news or fundamentals don’t move markets. They follow.
S&p was lower than 1821 re Dow Theory ?
I was thinking the same thing Craig. We broke 1821 but finished higher. Lara, does in take a close below 1821 for the SPX to confirm the Dow Theory?
So sorry everybody!
In my haste and coverage of breadth and volatility I left out checking those price points for Dow Theory.
Yes, the S&P has now broken below that price point.
The only one now left is Nasdaq.
Once that makes a new low below October 2014 low at 4,117.84 then its all over.
Thanks Lara for posting so fast. I wanted to compare some notes I had.
It’s hard to stay a bear when you see such a reversal like today!
Not if you look at the big picture…global markets are crashing…and we are just at the beginning…
But still that reversal
Was something else!
Futures down a little now let’s see if we can get some more action to the downside!
I just got spooked to be honest! Remember oct 2014? The Bullard bottom ?
Thats the thing about bear markets. They have deep fast rallies.
But we have lower highs. Lower lows. All technicals tell us we are in a bear market.
Rallies are opportunities.
We have zero evidence that this bear market is finished for now while price remains below 1,901.44. And even then it would still be a bear market rally, a fourth wave.
Quite a few analysts optimistically pointing out the intra-day reversal yesterday. The expressed positive sentiments are really interesting considering what the markets have actually done this year. It is said that a bear market descends a “slope of hope” in its initial stages. To their credit, some are pointing to the 2013 break-out level of around 1600 as a likely magnet. Nonetheless, both these kinds of positive comments and the stately and sedate advance of the VIX point to a persistent bullishness that is quite remarkable.
Futures suggesting a relatively tame day of action tomorrow.
Thanks Lara!