
A new low below 1,901.10 confirmed a third wave down was unfolding.
Thereafter, price continued lower.
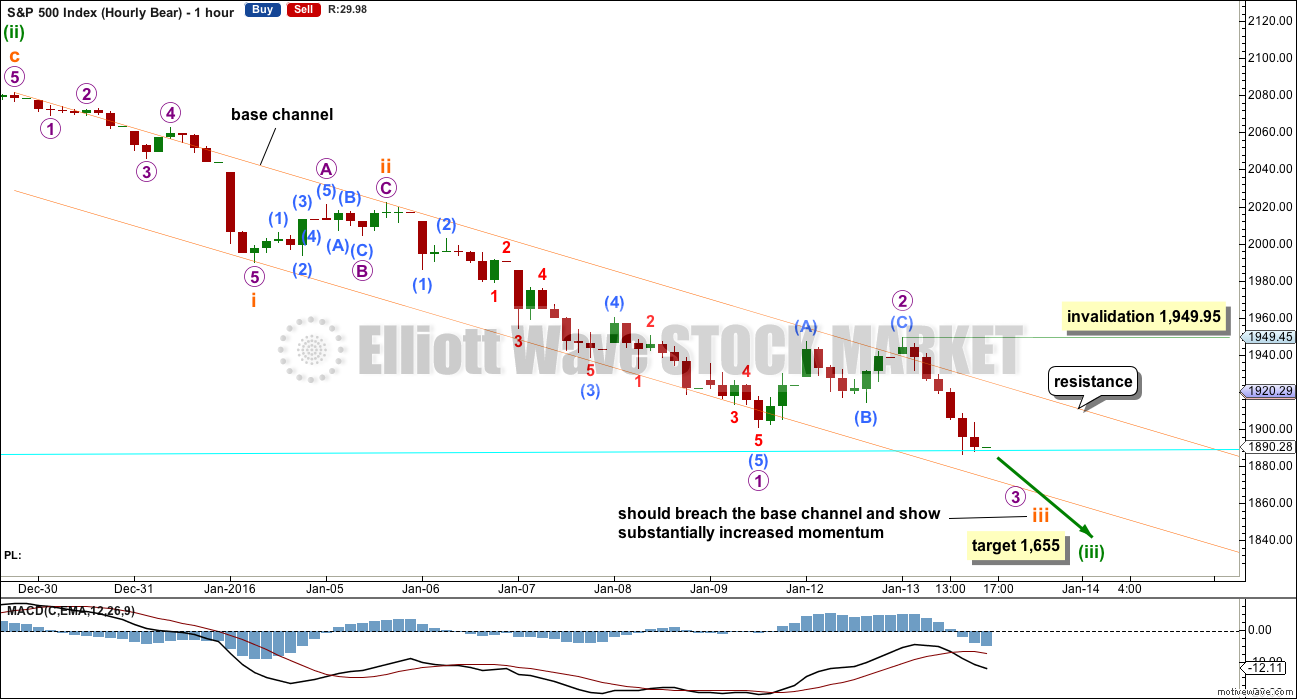
Summary: The trend is definitely down. The middle of a huge third wave is close and has not yet passed. The new target is 1,655. The invalidation point is relatively close by at 1,949.95. Volume continues to support the fall in price. Alternatively, a new high above 1,949.45 would indicate a larger bounce is underway, but this has a low probability.
To see how each of the bull and bear wave counts fit within a larger time frame see the Grand Supercycle Analysis.
To see detail of the bull market from 2009 to the all time high on weekly charts, click here.
Last published monthly charts can be seen here.
If I was asked to pick a winner (which I am reluctant to do) I would say the bear wave count has a higher probability. It is better supported by regular technical analysis at the monthly chart level, it fits the Grand Supercycle analysis better, and it has overall the “right look”.
New updates to this analysis are in bold.
BULL ELLIOTT WAVE COUNT
DAILY CHART – COMBINATION OR FLAT
Click chart to enlarge.
This wave count is bullish at Super Cycle degree.
Cycle wave IV may not move into cycle wave I price territory below 1,370.58. If this bull wave count is invalidated by downwards movement, then the bear wave count shall be fully confirmed.
Cycle wave II was a shallow 0.41 zigzag lasting three months. Cycle wave IV should exhibit alternation in structure and maybe also alternation in depth. Cycle wave IV may be a flat, combination or triangle. The two daily charts look at these three possibilities.
Cycle wave IV may end within the price range of the fourth wave of one lesser degree. Because of the good Fibonacci ratio for primary wave 3 and the perfect subdivisions within it, I am confident that primary wave 4 has its range from 1,730 to 1,647.
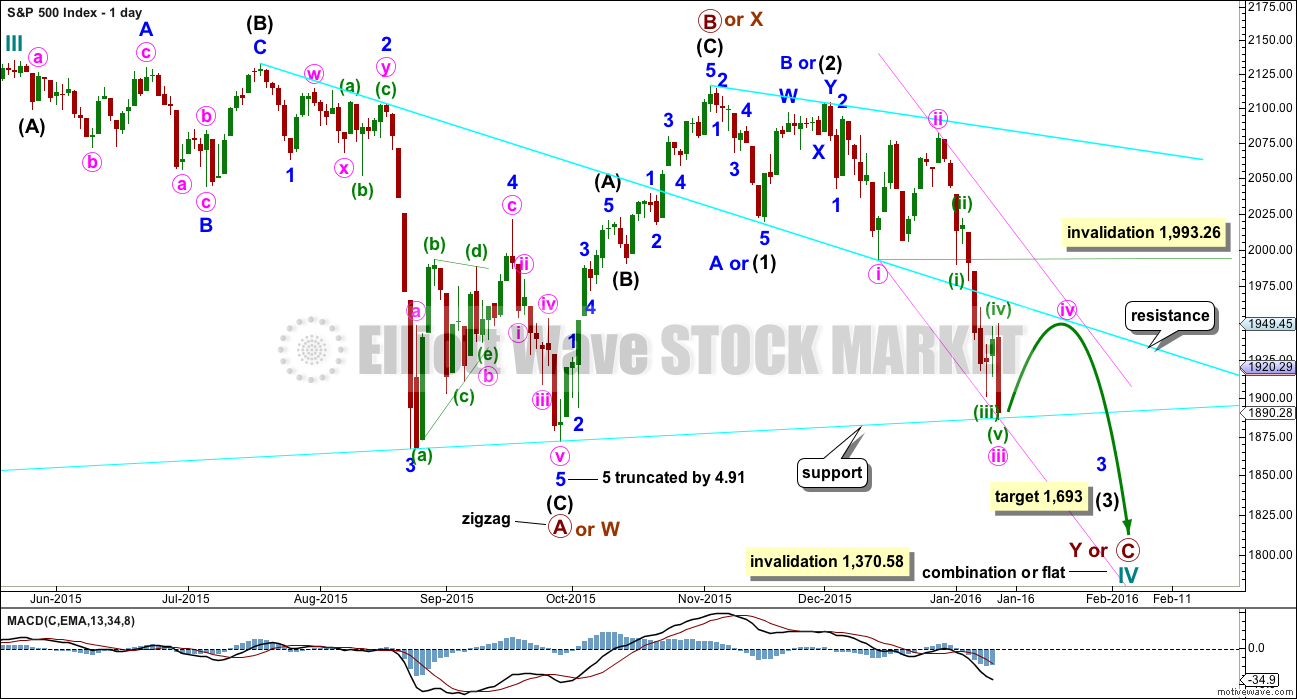
If a zigzag is complete at the last major low as labelled, then cycle wave IV may be unfolding as a flat, combination or triangle.
Primary wave C should subdivide as a five and primary wave Y should begin with a zigzag downwards. This downwards movement is either intermediate waves (1)-(2)-(3) of an impulse for primary wave C or minor waves A-B-C of a zigzag for intermediate wave (A). Both these ideas need to see a five down complete towards the target, so at this stage there is no divergence in expectations regarding targets or direction.
Primary wave A or W lasted three months. Primary wave C or Y may be expected to also last about three months.
Within the new downwards wave of primary wave C or Y, a first and second wave, or A and B wave, is now complete. Intermediate wave (2) or minor wave B lasted a Fibonacci 13 days exactly. At 1,693 intermediate wave (3) would reach 4.236 the length of intermediate wave (1).
The middle may have passed a few days ago within intermediate wave (3), but this has a lower probability than the scenario presented with the bear wave count. This idea is presented to consider all possibilities.
It is possible that minute wave iii is a complete five wave impulse. This has a low probability and should only be used if it is confirmed with a new high above 1,949.45. There would be no Fibonacci ratio between minute waves i and iii.
Minute wave iv may not move into minute wave i price territory above 1,993.26.
Price is finding support at the lower cyan trend line which is drawn from the October 2014 lows to the August 2015 lows.
DAILY CHART – TRIANGLE
Click chart to enlarge.
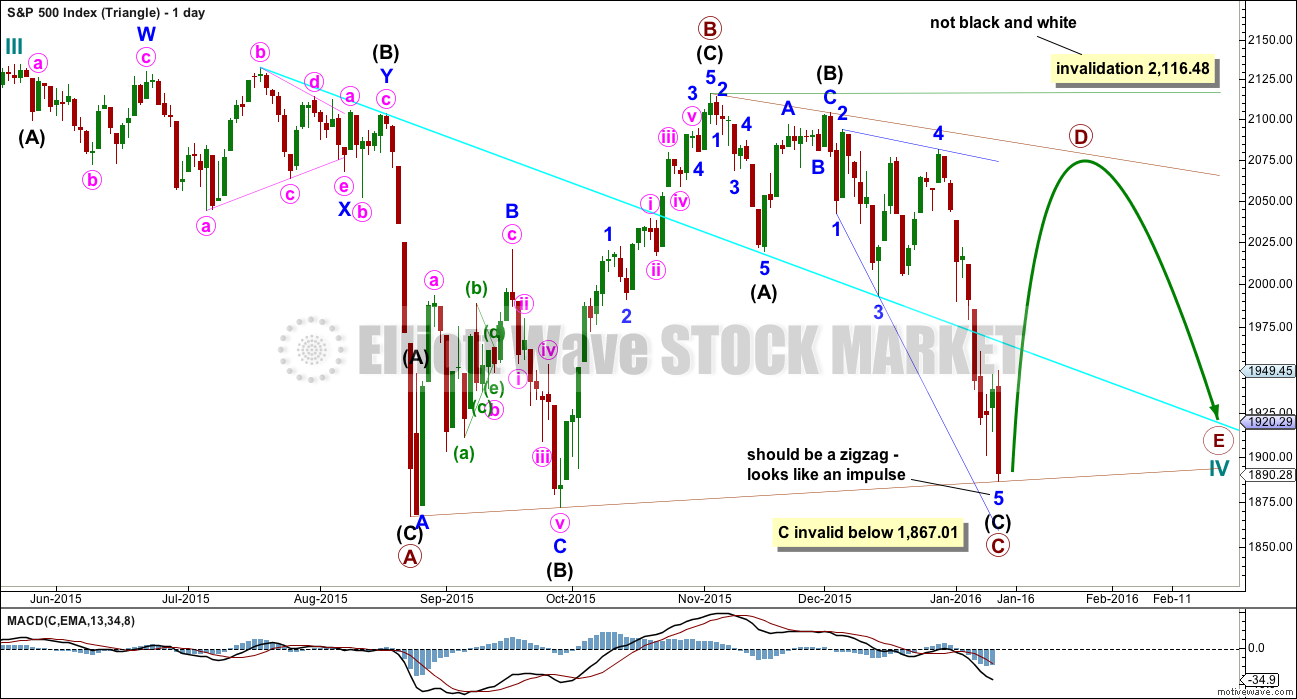
Cycle wave IV may unfold as a shallow triangle. This would provide alternation with the 0.41 zigzag of cycle wave II.
The triangle may be either a regular contracting or regular barrier triangle. An expanding triangle would also be technically possible, but as they are the rarest of all Elliott wave structures I would only chart and consider it if it shows itself to be true. Prior to that, the probability is too low for consideration.
Primary wave B would be a complete zigzag. The subdivisions all fit and now it has a clearer three wave look to it.
Primary wave C should unfold downwards as a single or double zigzag. So far it may be a single zigzag, with intermediate wave (C) an ending expanding diagonal. All the subwaves must subdivide as zigzags within an ending diagonal. This fifth wave does not look like a zigzag but instead subdivides as and looks like an impulse.
Primary wave C may not move below the end of primary wave A at 1,867.01. This invalidation point is black and white for both a contracting and barrier triangle.
Primary wave C may now be a complete zigzag. Primary wave D upwards should unfold as a single or double zigzag. For a contracting triangle, primary wave D may not move beyond the end of primary wave B above 2,116.48. For a barrier triangle, primary wave D should end about the same level as primary wave B at 2,116.48. The triangle would remain valid as long as the B-D trend line remains essentially flat. This invalidation point is not black and white. This is the only Elliot wave rule with any grey area.
Thereafter, primary wave E downwards may not move beyond the end of primary wave C.
The whole structure moves sideways in an ever decreasing range. The purpose of triangles is to take up time and move price sideways. Price exits the triangle in the same direction that it entered, in this case up. When the triangle is complete, then the bull market would be expected to resume. This triangle should take several months yet to complete.
HOURLY CHART
Click chart to enlarge.
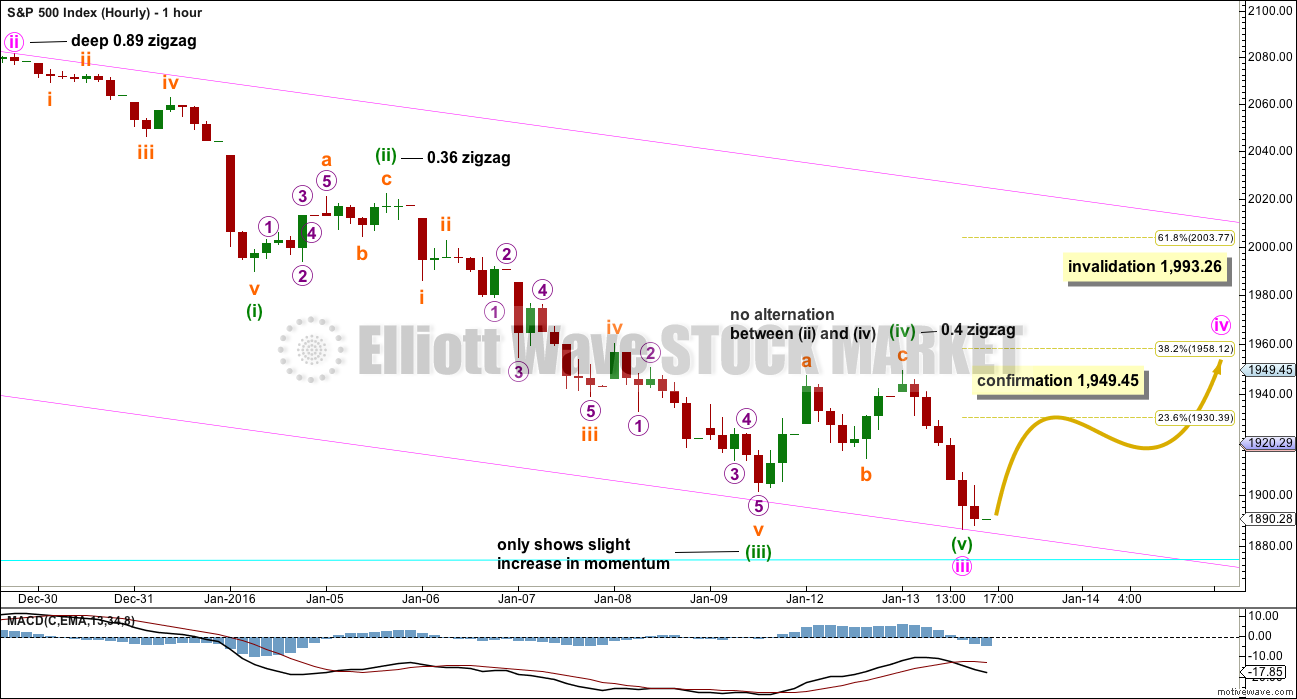
This hourly chart follows on directly from the labelling of the main daily chart.
Minute wave iii may be over as an impulse. Minute wave iii does show an increase in momentum beyond that seen for minute wave i on the daily chart.
On the hourly chart, there are a few problems with this wave count which reduce its probability:
1. There is no alternation in either structure or depth between minuette waves (ii) and (iv), both are shallow zigzags.
2. Minuette wave (iii) shows only a slight increase in momentum on the hourly chart beyond that seen for minuette wave (i).
3. Minuette wave (iii) did not breach a base channel drawn about minuette waves (i) and (ii) (no longer shown for reasons of clarity in the chart).
4. There are no Fibonacci ratios between minuette waves (i), (iii) and (v).
5. There is no Fibonacci ratio between minute waves i and iii.
It is technically possible that this idea is correct. Alternation is a guideline, not a rule, and momentum is a guide and not a rule. This idea is presented to consider all possibilities, so that we are prepared for the unexpected.
This idea requires a new high above 1,949.45 for confirmation.
If that happens, then the upwards movement may be minute wave iv. It should last about two to three weeks. It should exhibit alternation with minute wave ii. It should be shallow, so most likely ending about the 0.382 Fibonacci ratio at 1,958. It would most likely a flat, combination or triangle.
If it is an expanded flat or running triangle, then it may include a new price extreme beyond its start. There is no lower invalidation point for this reason for this wave count.
BEAR ELLIOTT WAVE COUNT
DAILY CHART
Click chart to enlarge.
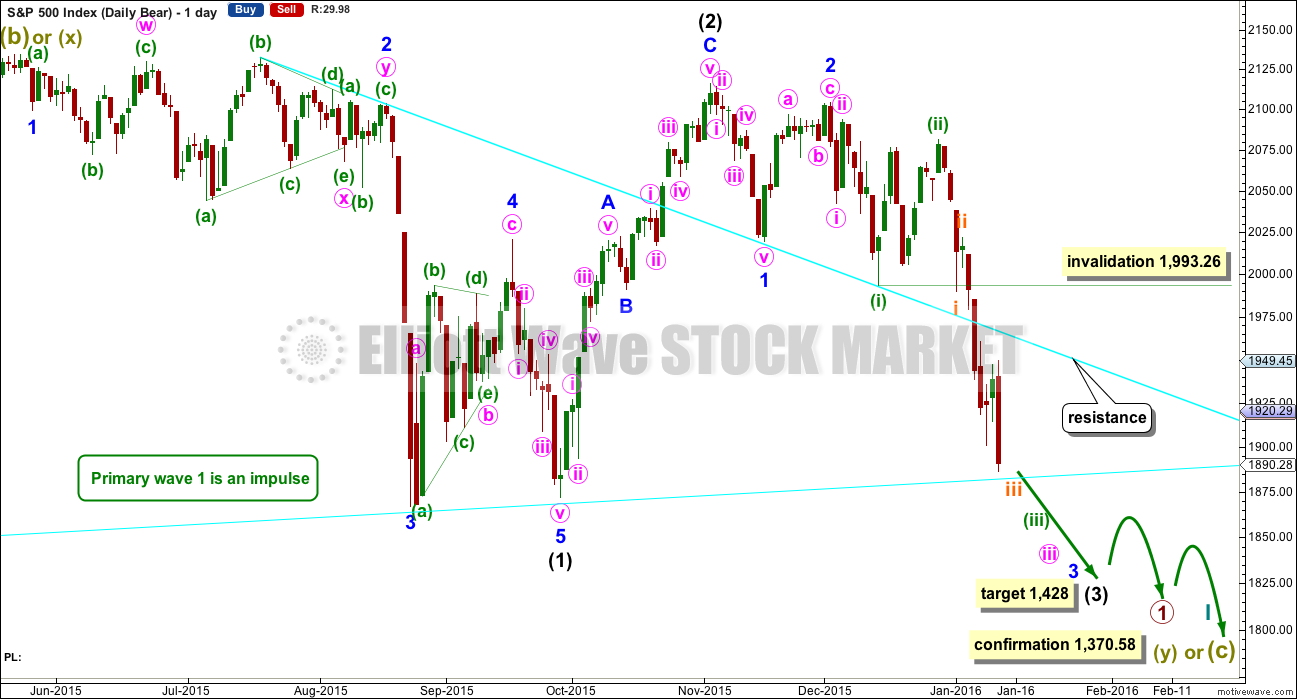
This bear wave count fits better than the bull with the even larger picture, super cycle analysis found here. It is also well supported by regular technical analysis at the monthly chart level.
Importantly, there is no lower invalidation point for this wave count. That means there is no lower limit to this bear market.
The downwards movement labelled intermediate wave (1) looks like a five. If minor wave 2 is seen as a double flat with a triangle for wave X within it, then the subdivisions all fit nicely.
Ratios within intermediate wave (1) are: minor wave 3 is 7.13 points short of 6.854 the length of minor wave 1, and minor wave 5 is just 2.82 points longer than 0.618 the length of minor wave 3. These excellent Fibonacci ratios add some support to this wave count.
Intermediate wave (2) was a very deep 0.93 zigzag. Because intermediate wave (2) was so deep the best Fibonacci ratio to apply for the target of intermediate wave (3) is 2.618 which gives a target at 1,428. If intermediate wave (3) ends below this target, then the degree of labelling within this downwards movement may be moved up one degree; this may be primary wave 3 now unfolding and in its early stages.
Because minuette wave (ii) was a deep correction of minuette wave (i), it would be expected that the correction of minuette wave (iv), when it arrives, should be shallow against minuette wave (iii). Minuette wave (iv) may not move into minuette wave (i) price territory above 1,993.26.
HOURLY CHART
Click chart to enlarge.
The subdivisions on the hourly chart for both wave counts are the same, but here the degree of labelling within the impulse of micro wave 1 is moved down one degree.
Instead of the end subminuette wave iii this may be only another first and second wave complete.
Because micro wave 2 ends with a small overshoot of the base channel about subminuette waves i and ii, it should be over there.
Within micro wave 3, no second wave correction may move beyond the start of its first wave above 1,949.95.
At 1,655 minuette wave (iii) would reach 4.236 the length of minuette wave (i).
This wave count requires a further increase in downwards momentum. The base channel about subminuette waves i and ii should be breached to the downside. When that is done price should find resistance at the lower edge of the channel.
The lower cyan line is copied over from the daily chart. Price found some support at the end of Wednesday’s session there. If price breaks through this line tomorrow, then look for a throwback to the line. If price behaves like that, then it may offer a perfect entry point to join the trend.
This wave count expects price is not yet near the strongest part of this third wave down. It expects a huge downwards movement over the next couple of weeks. These waves are not exhibiting Fibonacci durations, so an expectation of when it may end would be a vague guess only. I am not prepared to do that. The trend is down. Expect surprises to the downside.
If this wave count is wrong and the scenario presented for the first hourly chart is right, then the first indication would be a breach of the base channel.
TECHNICAL ANALYSIS
DAILY CHART

Click chart to enlarge. Chart courtesy of StockCharts.com.
Again, a strong downwards day on an increase in volume supports the bear wave count.
ADX is clear, the market is definitely trending. This is obvious by price action. ATR agrees as it is increasing.
On Balance Volume again led the way. It found resistance and bounced off the lower cyan trend line. OBV works well with trend lines.
OBV shows divergence with price today. Price made a new low but OBV did not. This is a bullish signal, but to date I have not found divergence between price and OBV to be a reliable signal.
RSI is again reaching into oversold territory, but this can be extreme for some time and be oversold yet the market can continue to fall over 100 points. RSI shows no divergence with price today.
Stochastics is oversold and shows weak bullish divergence today with price. Again, this signal is a weak warning; it is not always very reliable.
The two weak bullish signals and the cyan trend line offering support on the daily Elliott wave counts are the reason for the short term bullish scenario presented in the first hourly chart.
DOW THEORY
For the bear wave count I am waiting for Dow Theory to confirm a market crash. I am choosing to use the S&P500, Dow Industrials, Dow Transportation, Nasdaq and I’ll add the Russell 2000 index. Major swing lows are noted below. So far the Industrials, Transportation and Russell 2000 have made new major swing lows. None of these indices have made new highs.
At this stage, if the S&P500 and Nasdaq also make new major swing lows, then Dow Theory would confirm a major new bear market. At that stage, my only wave count would be the bear wave count.
The lows below are from October 2014. These lows were the last secondary correction within the primary trend which was the bull market from 2009.
S&P500: 1,821.61
Nasdaq: 4,117.84
DJT: 7,700.49 – this price point was breached.
DJIA: 15,855.12 – this price point was breached.
Russell 2000: 1,343.51 – this price point was breached.
This analysis is published @ 12:06 a.m. EST on 14th January, 2016.
A notice for members: I was advised yesterday by the MTA that I’ve been awarded CMT.
So now it’s official. You have a recognised qualified person doing your analysis 🙂
Congrats!
Which study guides did you use? or books to study?
A lot.
The ones I would recommend you may have already.
My favourites:
“Technical Analysis of Stock Trends” by Edwards, Magee and Bassetti.
“Technical Analysis” by Kirkpatrick and Dahlqvist.
“The Definitive Guile to Point and Figure” by Du Plessis.
“Japanese Candlestick Charting Techniques” by Nison.
And of course, not on the CMT reading list but one of the best ever “Reminiscences of a Stock Operator”.
ditto thanks!
Congratulations. It is a major accomplishment. Are you going to change the banner of your web page to reflect such a prestigious award!
Yes indeed.
Congratulation Lara and thank you for your guidance in these turbulent times.
And so the two ideas diverge: if this is a fourth wave bounce we should see choppy overlapping upwards movement for a correction to last 5 or 8 days to about 1,953.
But more likely the middle of a huge third wave is still ahead. While price remains below the upper edge of the base channel on the hourly bear count watch out. Expect surprises to the downside. This thing could rocket off very fast indeed. Mid term target 1,655. Invalidation point 1,949.95.
Agree…thinking the same kind of thing
wait me too!
I am thinking if this turns out to be a sub-micro two correction ( I don’t recall ever seeing one this deep) this may be a feature of the new bearish environment where everything moves faster and harder, but not necessarily for longer, it may be worth considering more liberal stops for moves against the trend…just thinking out loud…
Upside hedges starting to really pop…UVXY beating a more vigorous retreat as we head towards the close…looks like a bit more upside in the cards to end the weekend. Will hold hedges until at least tomorrow…not sure what to do about the week-end yet. I guess we will have better perspective after tonight’s update and tomorrow’s action.
Have a great evening everyone! 🙂
It looks to me that the upper channel line on the bear hourly count has been penetrated to the upside with at least one hourly candlestick above and not touching the line. This is indicative of a correction to the main trend. I don’t have hedges but I did take a long position this morning when the SPX was at 1903. I may close it today because I hate to give back hard earned profits. If not today, I will definitely close the longs tomorrow and wait for the signal to go short again.
As of 3:30 PM spx 1930, I am out
I agree.
Either this is a warning that the scenario on the bear is wrong and the bull is right…
Or that base channel isn’t working.
On the bear I’ll redraw the channel as a best fit. That base channel does not contain all this movement, the start has overshoots. If you draw a new channel to contain those overshoots then it fits.
For the S&P sometimes those base channels don’t work. (for Gold too sometimes they don’t work). They’re a guide, not a rule. Because they often work (not always) when they’re breached then the probability of the count reduces.
The price point for invalidation will not be moved from 1,949.95.
I agree. I’m having a hard time finding an entry point and holding a short in this market.
I’ve had more wins than losses, but the losses are teaching me that in this market I need to have more patience with my position. I need to set the stop further away and I need to endure the pain of a negative position at the beginning for longer.
This market is very different to the currencies I normally trade. The volatility and sharp corrections are really difficult!
Boy is that the truth. In hindsight, it does look as if a final fifth down started yesterday and completed this morning with a strong reversal- very typical of fifth waves. UVXY did put in a reasonably sized red candle by the close and a second close below upper BB- generally a reliable sign of at least a temporary bottom. The question at hand is how high the bounce. The absence of strongly increasing downside momentum on these third waves is indeed a bit of a mystery. The failure of the possible fifth to extend to compensate is even more of a puzzle.
The wave count for the bull will not change. This bounce is minute iv on that count. Expectations for duration a Fibonacci 5 or 8 days. Depth should be shallow, the 0.382 ratio is at 1,953.
I am still going to judge that one as having a lower probability. The lack of alternation within this last wave down between the possible second and fourth waves is a big warning that it’s probably wrong.
For the bear I would not want to see minuette (iii) over yet. It is just not long or strong enough. But obviously we have another bounce.
Now I know this may be unpopular but for EW reasons I’m going to hold onto that count. This bounce today is going to be labelled submicro (2). Thats a really low degree, and its showing up on the daily chart. But I’m going to hold to that count for these reasons:
1. It avoids the problem in the first idea of a lack of alternation between a second and fourth wave. Both of those corrections are seen as second wave corrections. Both can be zigzags and that’s okay.
2. Price is finding resistance at the upper edge of the base channel. That line is holding. While it holds this idea will have a higher probability than the first idea.
3. Third waves very often start like this. This one has a deep start, but it’s still the start if this idea is correct. Every single time this happens it confuses us and makes us think the third wave won’t show up, and then it does. These waves aren’t overlapping but they still fit first and second better than the middle of the third being over.
One learns something new everyday. Today I learned not to let what I thought was not the “right look” for the micro two, trump the more important containment of the channel. Thanks for the update Lara. Voice of experience much appreciated.
One last thing..
🙂
Volatility (UVXY) seems very restrained given the size of this SPX up move.
That’s because medium and longer term traders are using these upward corrections to accumulate positions. The trend in VIX and UVXY is STILL up. It may also be saying that this corrective move up may not last as long as minuette two did when it started Dec 14. UVXY did put in a big red candle that day- it still may do so today…we’ll see…I expect Lara will give us some targets for this possible upward four correction..
Minuette two up was a pretty good sized zig-zag and lasted a couple weeks. The next low down could line up with the next penetration of the UVXY B band around mid Feb based on the pattern the last three months. This time we actually had four penetrations before the big reversal today.
I have decided to head to the beach to go swimming now. See you all later…
Keep it going and dont forget we are in a “DOWN TREND”
1-6 days up doesnt bother me a bit…
Me neither…although this much anticipated big third down is proving quite elusive indeed! 🙂
Hello, new here.
Hoping I am in the right place to learn and become a better swing trader.
Ali
Hi Ali!
Welcome aboard. So nice to have you with us along for the (sometimes turbulent!) ride… 🙂
hi Ali
i am just about to sign off again.
Welcome to TEAM AWESOME!
Please ask questions. We love to answer them!
I am a position and swing trader!
you can call me ACE!
hi Ali
For starters – remember a couple rules:
1. Buy Low
2. Sell High
3. Never Lose Money
4. Dont forget rule #3
Thanks,
ace
great call by Jack! so far…
Thank you options…is happening like the way I imagined it would…
This is the deadcat bounce we were supposed to have yesterday. We were a little to early on that deadcat bounce because the wave structure at the time was not complete. Now the wave structure is complete, so is time for that deadcat bounce. I am not comfortable with the bearish count that we have right now…with this deadcat bounce I hope to see a little adjustment in the bearish wave count. As always IMHO.
i am comfortable as a swing trader the view is we are in a DOWN TREND.
to me i dont trade day in day out as it doesnt do me justice.
it doesnt bother me the least if price moves slightly against me on a position trade.
that is why i gave up day trading to hard to do and very unpredictable.
the other day we had reversed up and then down yesterday not worth it….
Options – see in a bear market a trader could be a bear and of course the trend could be down (as it is supposed to be) and the trader could still lose his or her pants…trading a bear is not like trading a bull…getting the trend right alone is not sufficient
Now – I can tell you, I am not a day trader
Is no telling how long/far this deadcat bounce is gonna move. I would have to get some guidance on that.
ok what is your style if you dont mind me asking?
Ace – I try to catch the higher degree waves (in Elliott Wave) and try to ride them to the end. I try not to worry about lower degree (noise). Now if someone mistake a higher degree correction for noise…obviously that is gonna cost them.
In particular, I like to catch the higher degree 3rd waves. If you catch’em right that is the one wave that is gonna make you money.
Hi Jack – For us newbies, can you please provide more details on why “getting the trend right alone is not sufficient” in a bear market?
Thank you!
In a nutshell, in a bear market, sell offs are (very) steep & fast and corrections are (very) steep & fast. So, a day late into the game or a day to early could mount to a lot of losses.
You can call me “ACE”
Medium and longer term bearish positions (which is where most of us probably should be) will not be affected by today’s whiplash and I would guess no one, including me, is bailing out of those as a result of today’s market action. Short term trades are the ones that take a hit when this kind of sudden move occurs because they generally have much tighter stops and the banksters know it. That the trend is still down we can all agree.
This is the biggest green candle we have had, however, since Dec 29 when the current move down started…
I think you are right. This candle looks to me too big to be part of a micro degree correction. Not sure how high it will go but I think it could go up awhile. I think I am going to hold onto upside hedges for a bit.
playing with fire just saying… not worth the risk reward and commission….
Verne
Volume down. they can grind it 🙁
Not sure what to make of it options. It does look impulsive up off the lows. Hard to tell so far if the move back down is three waves or not…
You can call me “ACE”
Also dont back peddle here from your extreme bearish outlook yesterday. I wouldn’t bother going long. I know the fibs and targets on the upside well and still i took a chance yesterday and made a few points wasn’t worth it.
be safe matey!
Yep…not exactly a high volume reversal is it? Another cautionary note no doubt…
Options you may be right. I think the banksters stampeded a bunch of us out of short positions ahead of the big smash down.
Be careful brother. I am here to learn and give back my experience to you guys!
THE MARKET IS LOOSING ALTITUDE!
We could chop chop chop.
the worst price action…
hi
All “Day Traders”
Be real careful here. I don’t trust these moves up for +1%-3% even for 1 or 2 days – continuation of a move doesn’t guarantee it can keep going up and up. No guarantees in the market even with BULLISH CANDLES…
This is the way ….. ha ha ha
Shalom
avnerilan
good call!
shabt shalom to you good man – options2014 (After today)…
Chazak u’varuch
Hi
All
OIL IS MOVING LOWER.
ART CASHIN IS SO GOOD 🙂
THIS IS CRAZY!
THESE MOVES UP ARE EXACTLY DEAD CAT BOUNCES….
verne
super fade possibly…
update your outlook 🙂
I could be wrong, and the move could be part of an upward correction. I am not sure how it would be labelled for the bear count. The invalidation point was 1949.95 so it could be another big second wave; would that be sub-micro? I think we have to just be prepared for these kinds of violent moves as the bear takes hold.
yep
My good friend ART CASHIN is probably the brightest out there.
OIL MOVES MARKETS!
A stark reminder of the banksters’ power to juice markets in the short term. Does not change the ultimate outcome or the major trend; can do great damage in the short term to the unprepared…looks like the whiplash is already fading…let’s see if it a three wave correction…invalidation point for bear still at 1950.00
short cover
Not Much more of this I can take :-((
BE STRONG PARESH!
i know its hard but hang in there and drink tea it helps 🙂
Was not quick enough have had to cover all my shorts and now am sitting on the fence with positions both ways. Yes it it goes down then I will clear the Longs at a loss but then if it bounces back up I am pretty screwed
Tea is needed and biscuits
I know the bansters are devious but if today was a shake-out move and not a true reversal, it’s been awhile since I have seen one this violent. There have been quite a few over the years at what appeared to be edge of cliff conditions in the market, but the one today was quite dramatic…I’m still not sure what to make of it…
I have to admit that manic move up today was quite unexpected. That was an unbelievable cash dump out of nowhere. Could be another protracted battle for the DJI 16000 and SPX 1900 pivots. On the sidelines for now with near term positions. Long and mid term bearish still very much intact.
2000 or 1950 anyone?
This is a classic bankster abmush folks. Stand aside and let it play out. Its probably going higher.
So glad I hesitated.
depends on the products you trade.
I’m glad you did too.
Strong intra-day reversal underway. Out of remaining short positions.
Indeed very tricky. You keep jumping in and out you could be playing with fire on missing the BIG move down imo.
My quotes changed to fast with my broker.
i did rotate out to wait but i think this will dump into feb the latest…
my original view may still stand SPX 1990 3 days from now 😉
I am not really a bull or bear just a trader….
so….
It looks like minuette three actually ended this morning (intra-day reversals are typical) and now we are in a correction for minuette four up for a week or two.
my estimate is max 3-4 days possibly 5 at most.
how can this run into 2 weeks when we are ripping so fast like today?
The speed of the reversal does make it a bit suspicious. I would have expected some kind of hammer, doji, or even a bullish engulfing candle to signal the turn around.
nymo -98 was a good enough clue, save it
No question in my mind what happened this morning was specifically intended to stop out a lot of short positions and I am sure they succeeded. I will admit the run-up was quite startling and I probably should have waited for the invalidation point before bailing. Live and learn. We will see where this goes. I do think the trend is still down, short term gyrations notwithstanding. The move has all the hallmarks of an intra-day reversal so better safe than sorry IMHO…
EXACTLY!
From yesterday’s high at ~1903 to today’s low at ~ 1878 we have five waves down. Perhaps we are starting another corrective wave upwards. At the moment SPX is at 1900 or 22 points above the low.
Lara wrote:
“The lower cyan line is copied over from the daily chart. Price found some support at the end of Wednesday’s session there. If price breaks through this line tomorrow, then look for a throwback to the line. If price behaves like that, then it may offer a perfect entry point to join the trend.”
We have now penetrated that lower cyan trend line (approximately 1889). Looking for a throwback / backtest as a good entry point to short the market.
Awesome call by Lara. Right on the money…futures did not go nuclear overnight…maybe tomorrow…?
exactly, why do you think I am here ?
I came to seek knowledge from the worlds brightest minds!
🙂
There is the throwback. Why am I hesitant?
Now at 10:20 AM SPX had gone above the throwback line and I am still hesitating.
hang in there
I’m confident in this decline….
imo
T2108 Hit low 9s this morning
UVXY saying we are not quite done yet, bankster futures shenanigans notwithstanding…frankly, I was actually expecting to see a gap down opening…risk remains to the downside IMHO
Between two trend lines…………
I have been watching gold
Banksters at work. They must think that nobody is looking at what’s going on in Europe. I’ll consider it over 1950.00
So a bounce back from 1867 to 1950 or 2000 before the next sell off?
Only two possibilities as far as I can see. Either we continue a minuette four correction today lasting a meandering two weeks or so, or we take out the August lows with a vengeance, and probably keep going….1950 will tell all…
you mean 1850 or 1950?
For minuette four to be in play, we need to take out 1950 to the upside according to the wave count…
looks like the bull count is panning out with green wave (V) finishing and pink (IV) starting soon – shame!
Hi Lara,
Is the username for the iphone App the same as for the main site?
The App is not accepting my username.
Thank you Lara for continually posting both the bull and the bear wave count possibilities while they are both still viable. Having an open mind about all possible wave counts is one of the best features of your website!
Ah yes! That seemingly quixotic, but nonetheless delectable quintuplet of thirds!
We have been thwarted so often in the past in our breathless anticipation of its arrival, have we not?
Here’s the deal- agonizing delay notwithstanding, when you look at some of the other indices (RUT, DJT), especially the monthly charts, it is clear that DJI and SPX have been playing catch-up for the last few months. Considering where those other indices are, and the rarefied air of our current positions from the next strong areas of support…SOMETHING’S GOTTA GIVE!!
🙂
I so hope you are right Verne 🙂
Its been a painful few years and need to load up the wagon and ride this wave
Thanks all for all your analysis it really does help
Most Welcome! Lara does a great job of keeping us all on the right side of the larger trend. She’s the best!! 🙂
I noticed a few of the “other guys” are FINALLY putting bearish counts on their waves…where on earth have they been..??!!