
Downwards movement continues as expected towards targets.
Summary: A downwards trend is still in place. The preferred bear wave count expects a big third wave is now close to the middle. The target for the next short term interruption to the trend is at 1,919. The invalidation point may now be moved down to 2,022.92; the upcoming fourth wave correction may not move into first wave price territory. The mid term target for this big third wave to end remains at 1,428.
To see how each of the bull and bear wave counts fit within a larger time frame see the Grand Supercycle Analysis.
To see detail of the bull market from 2009 to the all time high on weekly charts, click here.
Last published monthly charts can be seen here.
If I was asked to pick a winner (which I am reluctant to do) I would say the bear wave count has a higher probability. It is better supported by regular technical analysis at the monthly chart level, it fits the Grand Supercycle analysis better, and it has overall the “right look”.
New updates to this analysis are in bold.
BULL ELLIOTT WAVE COUNT
DAILY CHART – COMBINATION OR FLAT
Click chart to enlarge.
This wave count is bullish at Super Cycle degree.
Cycle wave IV may not move into cycle wave I price territory below 1,370.58. If this bull wave count is invalidated by downwards movement, then the bear wave count shall be fully confirmed.
Cycle wave II was a shallow 0.41 zigzag lasting three months. Cycle wave IV should exhibit alternation in structure and maybe also alternation in depth. Cycle wave IV may be a flat, combination or triangle. The two daily charts look at these three possibilities.
Cycle wave IV may end within the price range of the fourth wave of one lesser degree. Because of the good Fibonacci ratio for primary wave 3 and the perfect subdivisions within it, I am confident that primary wave 4 has its range from 1,730 to 1,647.
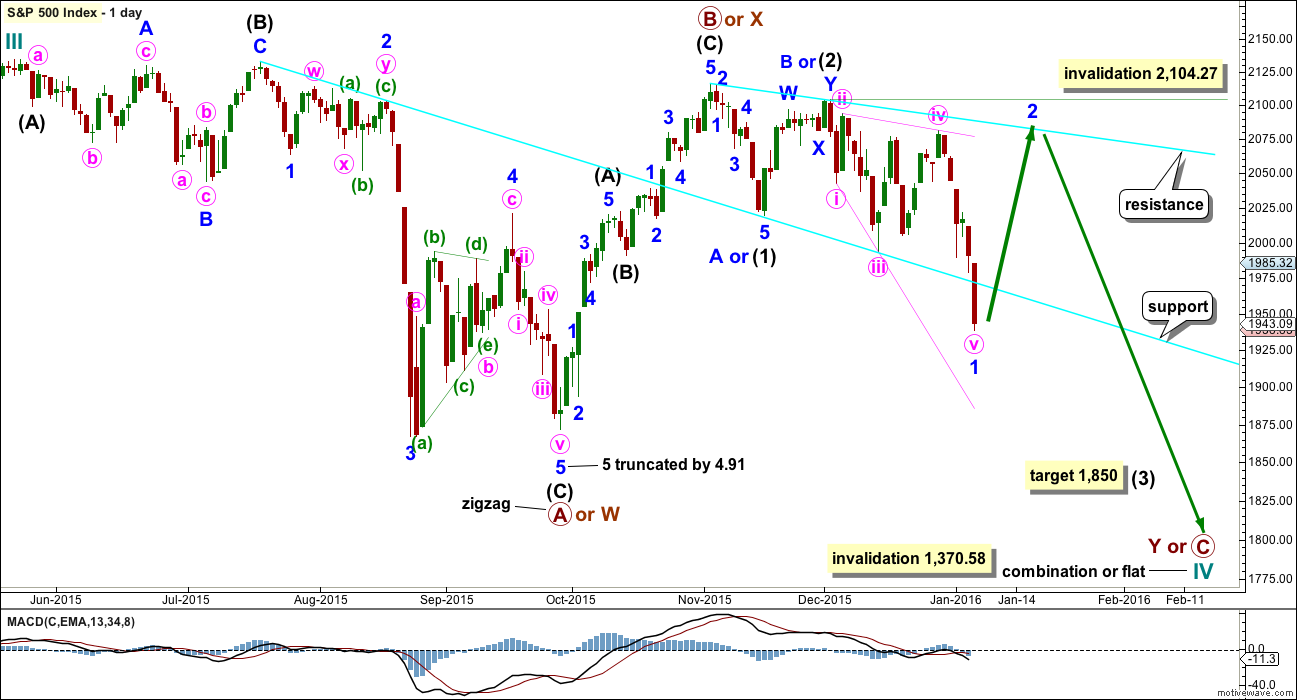
If a zigzag is complete at the last major low as labelled, then cycle wave IV may be unfolding as a flat, combination or triangle.
Primary wave C should subdivide as a five and primary wave Y should begin with a zigzag downwards. This downwards movement is either intermediate waves (1)-(2)-(3) of an impulse for primary wave C or minor waves A-B-C of a zigzag for intermediate wave (A). Both these ideas need to see a five down complete towards the target, so at this stage there is no divergence in expectations regarding targets or direction.
Primary wave A or W lasted three months. Primary wave C or Y may be expected to also last about three months.
Within the new downwards wave of primary wave C or Y, a first and second wave, or A and B wave, is now complete. Intermediate wave (2) or minor wave B lasted a Fibonacci 13 days exactly. At 1,850 intermediate wave (3) or minor wave C would reach 2.618 the length of intermediate wave (1). At this stage, this will be the sole target for this third (or C) wave to end as it fits better with more short term targets calculated at the hourly chart level.
There may now be a complete downwards first wave leading expanding diagonal. It is my judgement that this idea at this stage has a lower probability than the other idea presented with the daily bear wave count; both ideas work in the same way for bull and bear wave counts.
If price moves above 1,979.05 in the next one or two days, then this idea will be used for both bull and bear wave counts. If a leading diagonal is complete, then it should be followed by a very deep second wave correction which may not move beyond the start of the first wave above 2,104.27.
DAILY CHART – TRIANGLE
Click chart to enlarge.
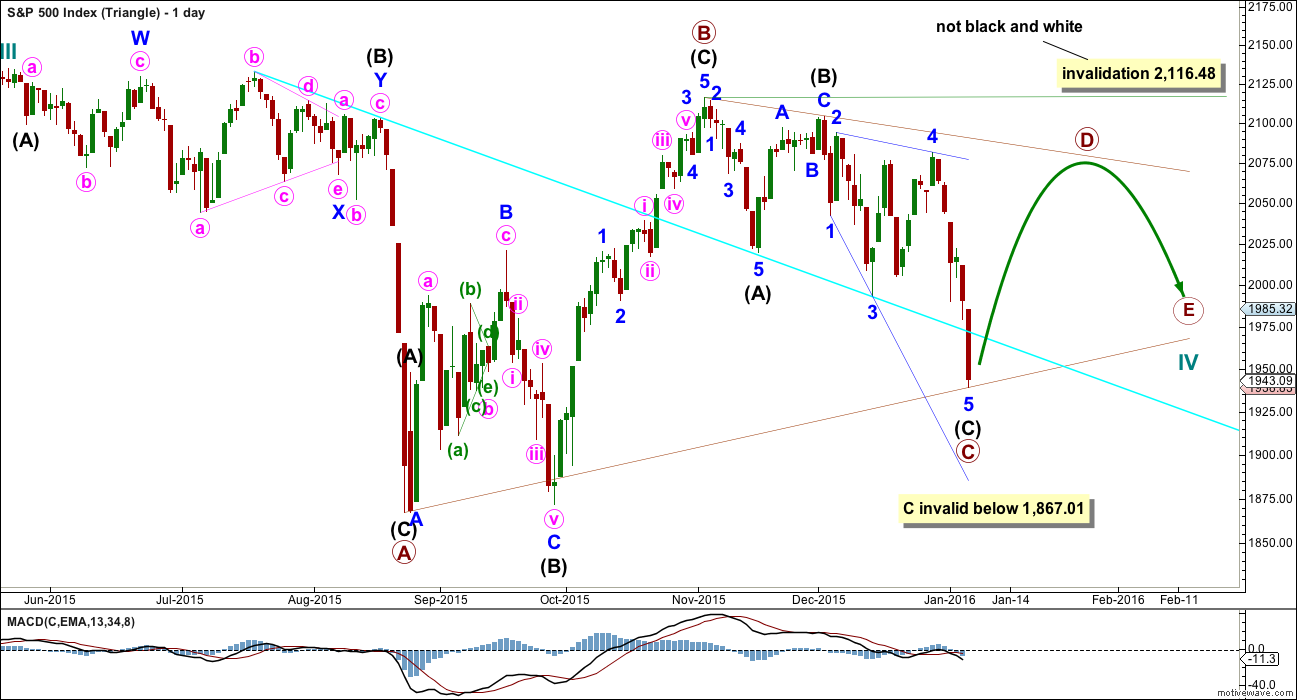
Cycle wave IV may unfold as a shallow triangle. This would provide alternation with the 0.41 zigzag of cycle wave II.
The triangle may be either a regular contracting or regular barrier triangle. An expanding triangle would also be technically possible, but as they are the rarest of all Elliott wave structures I would only chart and consider it if it shows itself to be true. Prior to that, the probability is too low for consideration.
Primary wave B would be a complete zigzag. The subdivisions all fit and now it has a clearer three wave look to it.
Primary wave C should unfold downwards as a single or double zigzag. So far it may be a single zigzag, with intermediate wave (C) unfolding as an ending expanding diagonal. At 1,947 intermediate wave (C) would reach 1.618 the length of intermediate wave (A).
Primary wave C may not move below the end of primary wave A at 1,867.01. This invalidation point is black and white for both a contracting and barrier triangle.
Primary wave C may now be a complete zigzag. Primary wave D upwards should unfold as a single or double zigzag. For a contracting triangle, primary wave D may not move beyond the end of primary wave B above 2,116.48. For a barrier triangle, primary wave D should end about the same level as primary wave B at 2,116.48. The triangle would remain valid as long as the B-D trend line remains essentially flat. This invalidation point is not black and white. This is the only Elliot wave rule with any grey area.
Thereafter, primary wave E downwards may not move beyond the end of primary wave C.
The whole structure moves sideways in an ever decreasing range. The purpose of triangles is to take up time and move price sideways. Price exits the triangle in the same direction that it entered, in this case up. When the triangle is complete, then the bull market would be expected to resume. This triangle should take several months yet to complete.
HOURLY CHART
Click chart to enlarge.
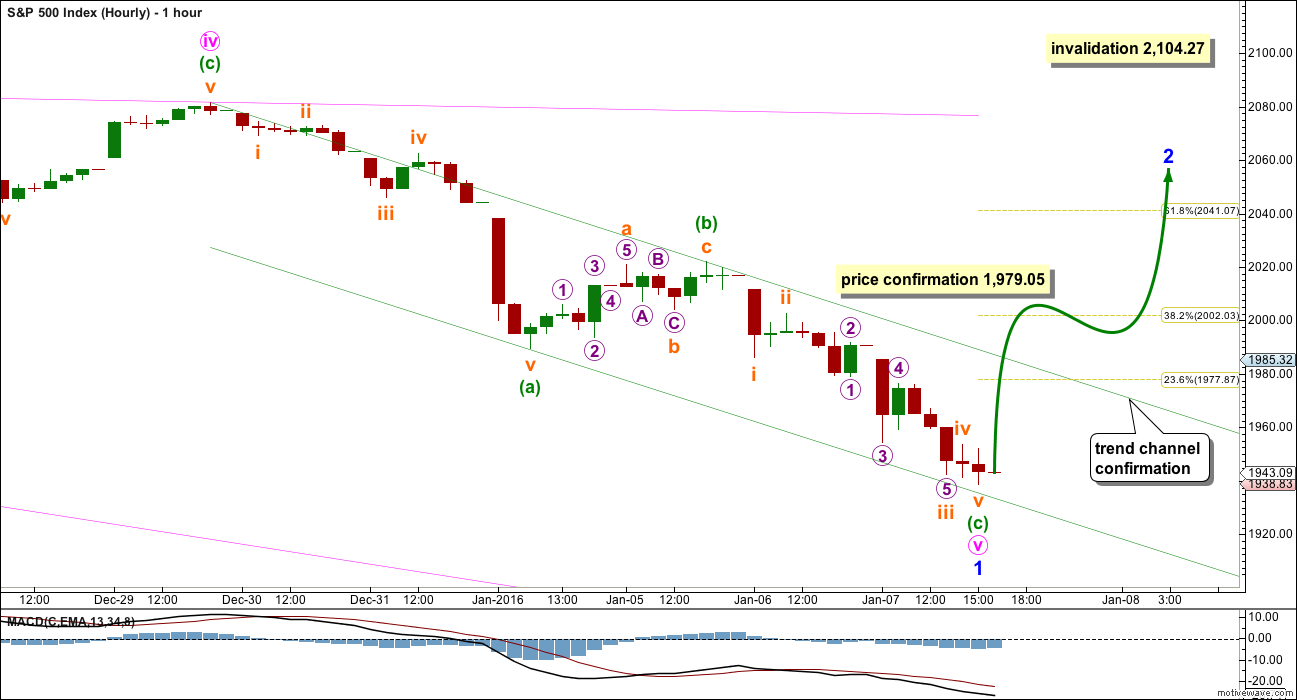
This hourly chart follows on directly from the labelling of the main daily chart.
The zigzag for minute wave v may now be seen as complete, although it does not have a very clear three wave look on the daily chart. I would have expected the B wave within it to be more time consuming.
Minuette wave (c) has no Fibonacci ratio to minuette wave (a) and is shorter by 8.77 points.
Ratios within minuette wave (c) are: subminuette wave iii is 3.89 points longer than 1.618 the length of subminuette wave i, and subminuette wave v is 1.15 points longer than 0.382 the length of subminuette wave i.
If price continues lower when markets open tomorrow, then the ratio between subminuette waves v and i will be lost. Subminuette wave v would reach equality with subminuette wave i at 1,918.
At this stage, there is no confirmation of a trend change. Earliest indication that this idea may be correct would come with a breach of the parallel channel about the zigzag of minute wave v. This wave count requires a new high above 1,979.05. At that stage, the idea of a series of overlapping first and second waves would be invalidated. The idea presented with the bear hourly wave count should be favoured while price remains below 1,979.05.
BULLISH ALTERNATE WAVE COUNT
This wave count is now invalidated by price. More confidence may now be had that the S&P500 is in a bear market at least short / mid term.
BEAR ELLIOTT WAVE COUNT
DAILY CHART
Click chart to enlarge.
This bear wave count fits better than the bull with the even larger picture, super cycle analysis found here. It is also well supported by regular technical analysis at the monthly chart level.
Importantly, there is no lower invalidation point for this wave count. That means there is no lower limit to this bear market.
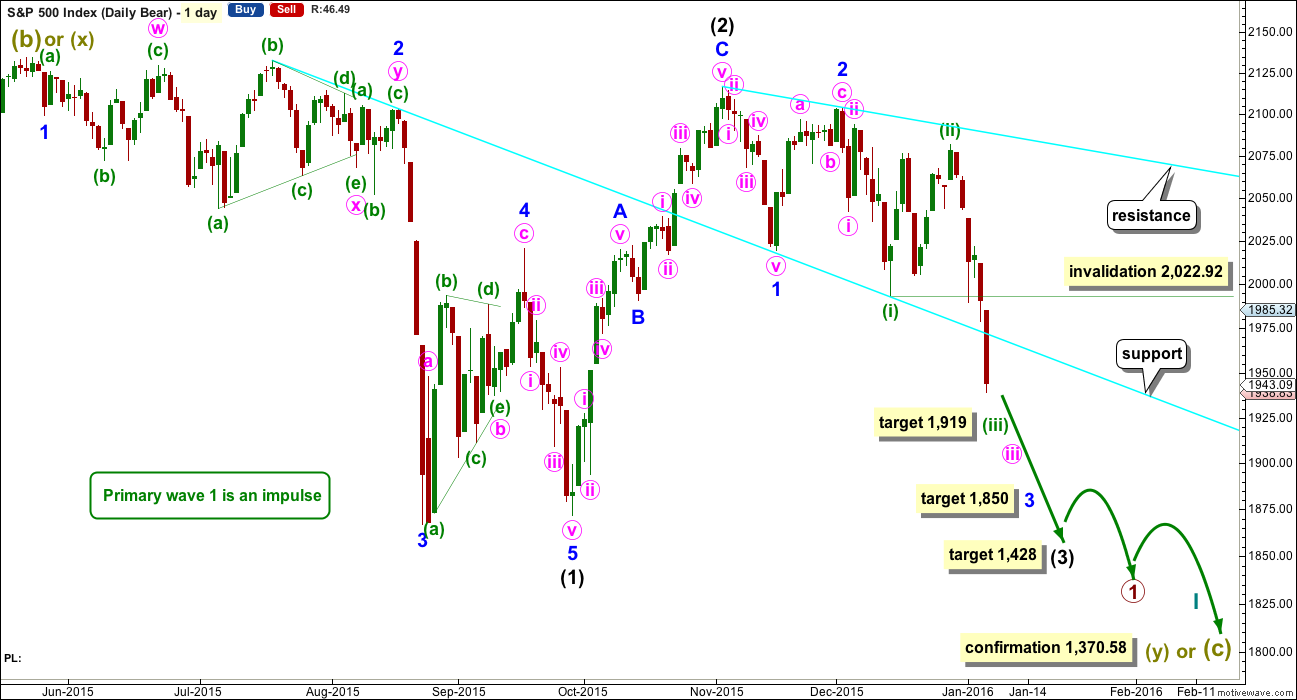
The downwards movement labelled intermediate wave (1) looks like a five. If minor wave 2 is seen as a double flat with a triangle for wave X within it, then the subdivisions all fit nicely.
Ratios within intermediate wave (1) are: minor wave 3 is 7.13 points short of 6.854 the length of minor wave 1, and minor wave 5 is just 2.82 points longer than 0.618 the length of minor wave 3. These excellent Fibonacci ratios add some support to this wave count.
Intermediate wave (2) was a very deep 0.93 zigzag. Because intermediate wave (2) was so deep the best Fibonacci ratio to apply for the target of intermediate wave (3) is 2.618 which gives a target at 1,428. If intermediate wave (3) ends below this target, then the degree of labelling within this downwards movement may be moved up one degree; this may be primary wave 3 now unfolding and in its early stages.
Within intermediate wave (3), minor waves 1 and 2 are complete. The upwards movement for minor wave 2 does have a strong three wave look to it at the daily chart level. Minor wave 2 was another deep correction at 0.87 of minor wave 1. At 1,850 minor wave 3 would reach 2.618 the length of minor wave 1. If price falls through this first target, then the next Fibonacci ratio in the sequence is 4.236 which would be reached at 1,693. If minor wave 3 is very extended, then the degree of labelling for all downwards movement from the all time high will be moved up one degree.
It is still possible (but still less likely) that primary wave 1 is unfolding as a leading diagonal. I will keep that chart up to date and will publish it if and when it begins to diverge from the idea presented here. For now I want to keep the number of charts published more manageable.
A line from the ends of intermediate wave (2) to minor wave 2 is drawn. This line may show where any further upwards movement finds resistance.
For the bear wave count today I am discarding the alternate idea published yesterday because it no longer has the right look.
Because downwards movement over the last two days is strong and supported well by volume, it looks most likely that a third wave down is unfolding. The target for minuette wave (iii) remains at 1,919 where it would reach 1.618 the length of minuette wave (i). If price reaches this first target and just keeps on falling, or if it gets there and the structure for minuette wave (iii) is incomplete, then the next target is the next Fibonacci ratio in the sequence. At 1,818 minuette wave (iii) would reach 2.618 the length of minuette wave (i). This lower target would necessitate a recalculation of targets at higher degrees also.
Because minuette wave (ii) was a deep correction of minuette wave (i), it would be expected that the correction of minuette wave (iv), when it arrives, should be shallow against minuette wave (iii). Minuette wave (iv) may not move into minuette wave (i) price territory above 2,022.92.
HOURLY CHART
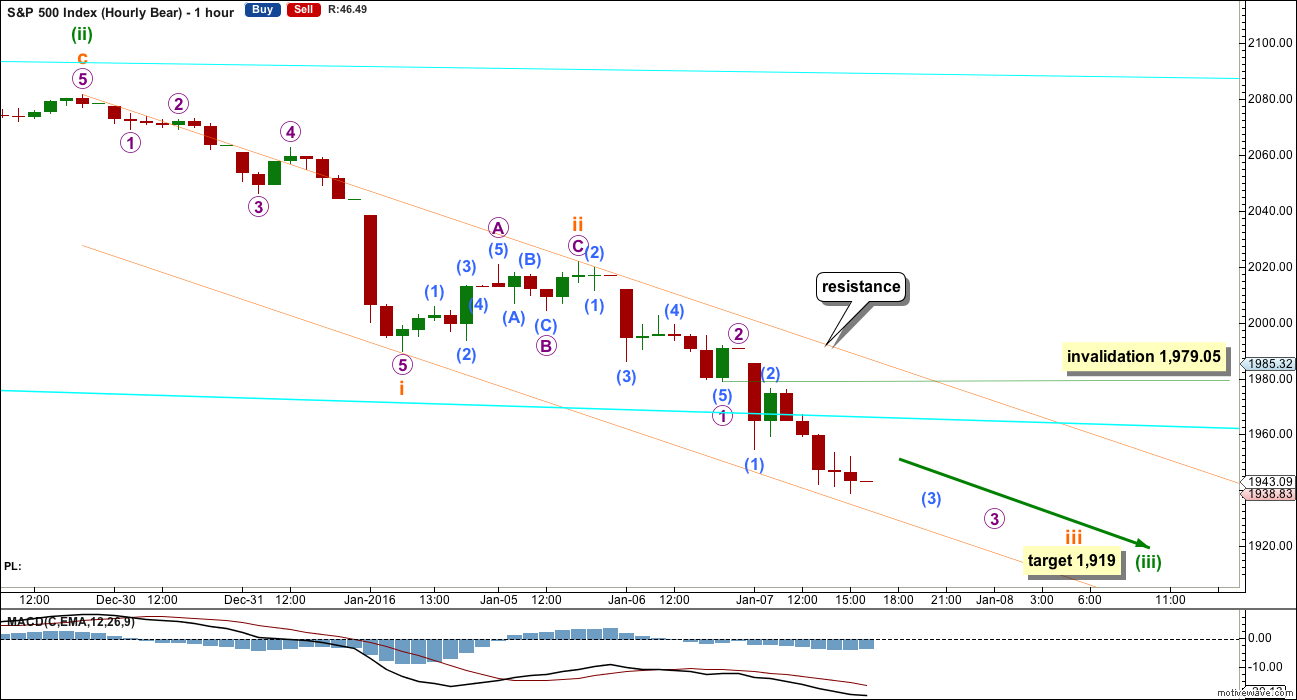
Click chart to enlarge.
The orange channel drawn about this third wave is a base channel drawn about subminuette waves i and ii. Subminuette wave iii should break below the lower edge, and once below that trend line it should find resistance there. At this stage, the lower edge of the base channel is providing support. Because price has not yet broken below the base channel, and because so far subminuette wave iii has not passed equality in length with subminuette wave i, it is my judgement that the middle of this third wave is still not over.
Along the way down, upwards corrections should find resistance at the upper edge of the base channel. If that trend line does not provide resistance, then that shall be first warning that price may bounce a lot higher as per the scenario presented with the daily bull and hourly bull wave counts above.
The cyan lines are copied over from the daily chart. The lower cyan line was about where price found some support before breaking through. It may now be about where some resistance should be seen for any upwards corrections.
There are now seven first and second wave corrections within this wave count. The middle of the third wave is very close and may pass tomorrow. Thereafter, a series of small brief shallow fourth wave corrections should unfold along the way down. They should all be over quickly and should not show up on the daily chart as any green candlesticks or doji.
When micro wave 4 arrives, then it may not move into micro wave 1 price territory above 1,979.05.
This wave count expects further downwards movement and may also expect some further increase in downwards momentum. MACD does show some increase in downwards momentum, but it is still not as strong as the middle of a third wave should be.
Warning: If targets are wrong, they will be too high. Extra targets provided should be used, if price keeps falling through the first targets.
TECHNICAL ANALYSIS
DAILY CHART
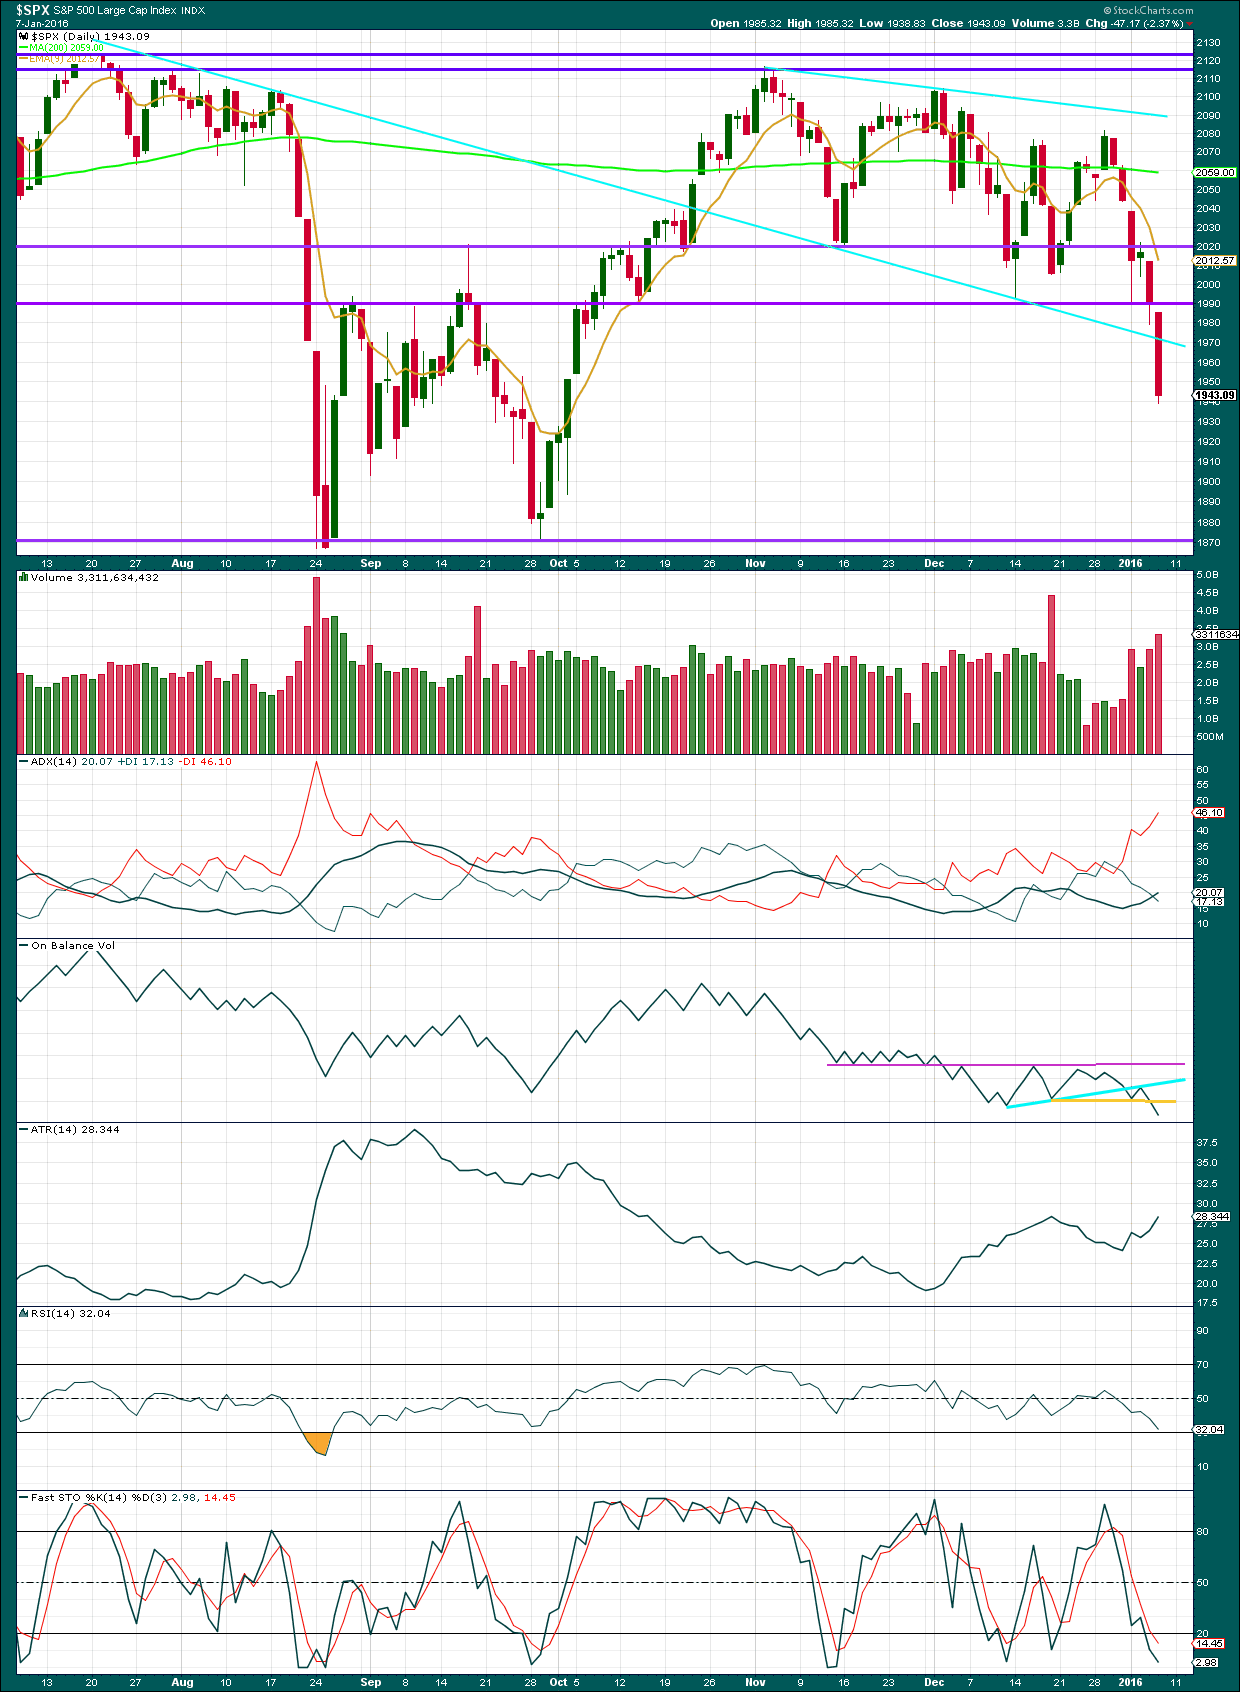
Click chart to enlarge. Chart courtesy of StockCharts.com.
Again, price falls on an increase in volume. The volume profile supports the bear wave count consistently.
The next line to offer support is about 1,870. Classic technical analysis would most likely expect a bounce about there.
ADX is increasing as is ATR. Both are in agreement that the market is trending, which is now very clear by price action.
ADX is still below 20. This trend is still young.
RSI is still not oversold. If the market is trending, RSI can remain extreme for a while at the daily chart level. But any divergence once it reaches oversold should be taken as a strong indication of an end (short or mid term) to downwards movement. During the strong fall in August 2015, on this chart RSI reached oversold on 21st August, yet price fell a further 100 points to the low on 24th August. At the low on 24th August, there was no divergence between price and RSI, so it is not always seen. RSI is often an advance warning of an end to the trend (short to mid term) and divergence between price and RSI is an even stronger warning.
At today’s close, there is no warning from RSI that downwards movement should end here or soon.
Stochastics is oversold, but this oscillator may remain extreme for reasonable periods of time in a trending market. At this stage, it shows no divergence with price.
DOW THEORY
For the bear wave count I am waiting for Dow Theory to confirm a market crash. I am choosing to use the S&P500, Dow Industrials, Dow Transportation, Nasdaq and I’ll add the Russell 2000 index. Major swing lows are noted below. So far the Industrials, Transportation and Russell 2000 have made new major swing lows. None of these indices have made new highs.
At this stage, if the S&P500 and Nasdaq also make new major swing lows, then Dow Theory would confirm a major new bear market. At that stage, my only wave count would be the bear wave count.
S&P500: 1,821.61
Nasdaq: 4,117.84
DJT: 7,700.49 – this price point was breached.
DJIA: 15,855.12 – this price point was breached.
Russell 2000: 1,343.51 – this price point was breached.
This analysis is published about 10:02 p.m. EST.
The small correction on the hourly chart today which creates today’s long upper wick on the daily candlestick would at first glance look like a fourth wave counterpart to subminuette wave ii on the hourly bear chart.
But if it is subminuette wave iv then subminuette wave iii would be shorter at 89.02 points than subminuette wave i which was 91.88 points.
Which is most unlikely. And momentum only slightly increased downwards.
What I think is much more likely is the middle of the third wave is still not over and downwards movement should be expected to still increase further in momentum.
Targets will remain the same. The channel on the hourly chart will remain the same. It still should be breached to the downside.
Next week should continue lower, and at this stage corrections should be brief and shallow. Momentum should increase.
If the hourly bear is correct.
If the hourly bull is correct and we have a second wave correction beginning then it must show itself on Monday / Tuesday. If it does not and price keeps falling I’ll discard the idea.
Just gotta say Lara, EXCELLENT analysis!
You called that 1919 target and that’s EXACTLY where things ended up.
In the words of Master Yoda, “Most impressive Elliott Wave Mojo you have”
Thanks for all your hard work, I’m looking forward to trading your analysis again next week.
Have a great weekend everybody at EWSM
Stuart
Thanks Stuart.
But minuette (iii) isn’t over. The first target is met but the structure is incomplete.
I’ll now use the second target at 1,818.
Awesome….
Move down from 1950.50 is still within a channel so could be corrective (retraced), though it is now too long in the tooth to be ii of c up imho. I’m not committing any further until it at least drops out of the channel.
Maybe it could be about to get going, or could be part of a larger correction.
Lots of messy overlapping, but we are getting lower highs and lower lows so it might be getting ready to fall through the floor
Sounds good to me. Anybody rattled out of short positions by overnight scare?…or did most folk hang tough…? 😀
I hung tough. But I am wondering right now if I should cash in the profits. That is why I asked early your thoughts about holding over the weekend.
Now 1926 on SPX. I guess I will hang tough over the weekend. I wanted total peace of mind though as I watched the NFL playoffs!
Tough call. I
I’m rotating into VIXY for the weekend to reduce exposure, but wouldn’t want to be flat right now.
Could go either way so want to limit risk a little
I am going to stay put but continue to be very watchful Monday and Tuesday. It has been a fun / good week. Have a great weekend.
And if you are in to the NFL (the real football league) root for the Seattle Seahawks.
Maybe we will close at 1919.19 !!!!
My message got interrupted be a disconnected cord, sorry. I too am holding on as I think the strongest movement is just ahead. This is confirmed by UVXY action. What happened overnight was also a real game changer I think.
Of all things, a disconnected cord. I thought I was the only one to fumble with such things.
Another interesting thing about today’s action is that it mirrors the action of the week-end of August 21 during the last sell-off. Market made new lows on Monday 24 of the following week. I think we will see a repeat of this pattern on Monday which means a monster decline on Monday if August lows are to be taken out. It could possibly continue into Tuesday. VIX spiked to a high of 53 the day of the low on Monday which was at the end of the third wave as the fifth was truncated, but UVXY did not make its high of 93 until during the end of the b leg down for the fourth wave correction on September 1. Neither VIX nor UVXY made new highs at the end of the fifth wave probably because of its truncation.
Verne
Yes indeed. Actually back in Aug 2015…
Thur-Fri sold off hard.
Then the massive decline Monday….
History doesn’t repeat but it sure does rhyme…
I did currency for a while but got exhausted before switching over to US Indices…
Funny, I just got this e-mail from FXCM 🙂
Verne,
I need to go back and measure the previous Aug Thur-Fri percentage to this week….
Verne
Good observation by you. Well the numbers are in.
Aug 2015 Thur – Fri around ~5.2%
Jan 2016 Thur – Fri around ~3.5%
My only concern about how much more downward movement we should expect for this leg down is that UVXY is already piercing its upper B band and that is usually a signal that a bottom is near. If this is a third down at intermediate degree, it really should punch clear through the upper band and close above it more persistently than it did for intermediate one back in August. If we see a reversal on Monday it would favor the Bullish count with minor two up beginning then.
What the market does on Monday will be critical to getting some idea of which count is right.
Verne
I was hanging in there like you know of course 🙂
But seriously WHY isn’t the VIX moving up like crazy yet matey?
Residual optimism perhaps. It looks to me like the party is just getting started. Neither VIX nor UVXY is indicating anything even close to capitulation. The fat green candles today suggest the start of the fat portion of the decline. I expect a huge gap up open on Monday and a spike on Tuesday to end the third down. We’ll see.
ES FUTURES KEEP ON FALLING!
I was initially underwater but managed to weave my way in and out of trades into profitability – market is finally going in the right direction for me right now.
Someone still seems to be buying at every small drop down
Banksters. Their idea of a “managed” decline…I like the un-managed (maybe mis-managed?!) kinds best though…we should get that soon!…. 🙂
verne
you know although I have my market challenges with you. Good responses matey!
I sold 1/20th of my position at yesterday’s close and sold 1/10th at today’s close.
Jack
It is a personal choice. Depends on your risk/reward views. A good trader once told me risk management is the key…
I’m hanging in there until the end of the third wave.
I don’t like to day trade, I prefer to hold for at least several days.
What a day so far!
hi
all
Jittery day. I am glad I’m not over reacting to this noise… Hopefully we get some more stable price action in the next hour…
The last 30 minutes games are getting over done here…
Hi folks:
If you have been a victim of the market makers the last few years you are looking at a historic opportunity. This is just in the initial stages. Get positioned a few months out and go fishing….you are very welcome! 🙂
What is that? UVXY?
Yep! Before this is all over, that August high will be nothing but a blip on the chart… 🙂
In all my years of trading. Declines are SHARP and FAST!
This initial wave down +20% should be lightning quick.
I think March will be a surprise….
It is an ETF on the VIX with leverage.
Olga,
Please make sure to read my comment to you about your short term analysis. I would be sorry if you stopped that.
Get on a MAC. Much better for browser based trading…
True story
I had a PC it stalled and crashed on me while I had an order.
I can’t go back to pc yet…
Vern, going short now implies you don’t believe there will be much of an upside correction?
After what the banksters did with futures last night with absolutely no follow-up today…it looks to me like they are out of monetary and psychological bullets so to speak. The market has been giving folk every opportunity to get positioned for what’s coming…it makes little sense to try and get positions after a thousand point decline has ALREADY transpired….I think the strongest portion of the decline is just ahead per Lara’s bearish count, and that the August low WILL fall…just my two cents… 🙂
ohh i can’t wait… such excitement
on deck
earnings next week
fed talk
corporate buy backs starts in feb 🙂
I am sure they are starting to rethink that bit of financial engineering. A lot of those buybacks were done at much higher prices. The companies who did that are all excellent short candidates. The end of free FED money makes the practice far less attractive. The insiders have all used those buybacks to take the money and run. I feel sorry for a lot of folk holding “investment grade” corporate bonds from companies whose stock values are about to take a 80% haircut, and there are plenty of them!
Vern-your two cents more valuable than FEDs two trillion. Thanks
BTW, this morning I essentially shorted the rally by selling some of my bullish positions. For the last several weeks, shorting the rallies has been the correct trade, as is always the case in an established downtrend IMHO…
i agree. i just don’t do weekly options anymore
i do months out
i am still a great student of derivatives
thanks for your contributions – great stuff!
ES Daily: Tricky stuff 1942 is a critical pivot point Red trend line is also critical
Hadn’t seen that – makes sense that it bounced there
hi
all
I took the time to DRAW what I think the candles will look like in 2 weeks on the weekly time frame.
Any comments?
NO JINX!
I pray that this is true!! It would solve a lot the struggles that I have faced this last 3 years. Everything crossed and look forward to raising a glass or two with you if it does
I don’t drink as I am straight edge like Chris Martin. Just pray we all make this short is all I ask!
Cool, I haven’t touched a drop in 11 years
I just never had the desire or the acquired taste. Plus to many calories.
but wow 11 years – now – that is discipline matey!
The weekly and monthly MACD are both pointing down. The shipped has been turned around, so to speak. This is an important signal. This has been a huge turn in a market that has been incessantly going up for six or seven years. But now things are all starting to point downwards.
Whether or not it makes it down like your charts show is the BIG question. It is possible and even reasonable. However, we still have other possible wave counts including the triangle. That is what keeps me hesitant. And Lara is waiting for the modified Dow theory to fully call the bear. She prefers the bear count now and has been right on.
By the way, if my memory serves me right, Lara mentioned some years back, that following the 5 minute counts is not only difficult but exhausting. She did some back then for the sake of the customer. But we see that the hourly counts carry more weight and information.
Thanks for your contributions.
Yeah I agree – I’ll refrain from commenting on lower degree waves going forward so not to cause anyone here any confusion with the bigger picture.
Olga,
Oh, I did not intend for that. I love your very short term comments. Please do not stop because your EW analysis has taught me a lot. The amount of commentary here has increased significantly in the last 6 months of so. I have really enjoyed it and learned a lot. So, please keep the comments coming.
Thanks,
Rodney
Many thanks for your kind comments Rodney.
I try to comment on what is in my mind when I am using EW to get into a position / sell and try to re-enter at a better price. But I am very mindful that someone could misunderstand the degree of wave I am commenting on. I don’t want to make trading for anyone more difficult than it already is!!
I’ll keep posting if I see anything really important intra-day, albeit I think you will make alot more money in this market, by buying and holding based on Lara’s hourly chart invalidations rather than trading in and out on a daily basis.
I’m currrently scalping quite alot as there are still bullish options which need to be invalidated, as you pointed out. I’m hoping to take a position and run with it shortly.
Hey!!! I LIKE your comments! 🙂
Thanks Buddy! 🙂 Likewise
Thank you!
Although there are four ideas at the daily chart level; flat, combination, triangle and the bear, I do prefer the bear. It has the highest probability.
I’m just naturally cautious and it’s a massive call to make.
But that’s the one I’ll trade on, because I expect it’s right and I don’t want to miss the big move down. I want my position set before the big move starts.
They all expect price to go down a bit anyway, except the triangle. And TBH I don’t have enough confidence in that triangle wave count to let it stop me trying to trade this market. It’s just a warning to not let a trend change turn my profit into losses.
Price bounced perfectly from the lower channel of the move down from todays high – this might be just wave b down (from todays high) with wave c up still to go – a rise above 1944.05 should be the first clue.
thanks…
Risen above 1944.05 so where do we go from here?
My comments are on very small degree waves – the trend should still be down even if we make a new high above the earlier one – it should just be a 5 wave scary and fast wave c.
But it needs to get above 1951.16 first – we could still just have a series of 1,2’s, though the last move down from the high todays looks like a 3 wave structure to me
I can already see 5 waves up – unless it is extending, this could be a (rare) running flat correction and if so will not go above 1960.
I think they are more common when the pull of the market is very strong in the direction of the trend (in this case down).
The main thing with all this is that the trend is still down until proven otherwise
if we get a small degree 5 wave structure down now then this up move might be over – or we might just have wave 1 of c done (if so this down move right now will be a 3 wave structure)
if we hit above 1948.32 now – i’ll bail on some of my position and try to re-buy at a better price.
Edit: Stay of execution!! (for now :))
If this is an abc correction – both waves a and b have very clear sub-divisions at one degree lower – that makes me think we might only be in wave ii of c up right now. New lows would invalidate that possibility
UVXY is quite elavated – so the show is not quite over yet. This move needs to go above 1951.46 if it is going to make a new high above the one earlier today
There’s that break of 1943! Die, SPX! Die!
strong words.
i want my years and years of lost investments back from this market too 🙂
Would love it drop of a cliff!! Lets hope so
me too
i think this is showing how WEAK the market is.
Look out below!
hi
all
There is one thing I am still learning about markets.
You have to have conviction in a particular market view.
I like to write it down.
Any other good ideas ?
The market owes you nothing.
You cannot make it pay you anything.
The morning activity : Play the gap
Machines are playing with the weekly pivot on the ES (1942)
TA may currently be mis-focused on human psychology , Machine programming should be the focus
Yeah tell me about it.
The real scary things with these computers is the SPEED and not to mention HFT and DARK POOLS. I wonder what trading will be like in 5 years.
I bet beyond totally crazy! 🙂
verne
i have made so many mistakes buy trying to jump out and jump in.
1 day I had a contract I sold which I made 200%.
I checked the same day and the close was up 500%
So, I am a buy and hold options kind of guy!
See my point!
I do tons of research but it is precision work just to get into a trade ….
I am fully loaded on the short side with the fewest upside hedges I have had for as long as I can recall. The banksters have done their best. Now it’s time to pay the piper. Not much use in watching the choppy back and forth as it can be exhausting. The trend is down, and I am off for a bit of a break from the action…will check in later…good luck to all!
k verne. Will wait for your return matey!
This is getting interesting.
Hard to control your own emotions with these fast market swings!
That is my only complaint with options… PRICE movements 😉
Thanks, Verne, for all you commentary this week. I have a question for you because you seem to have a lot of experience. Will you hold your short positions over the weekend? I know some traders that avoid holding over weekend and would like to hear your thoughts sometime.
Thanks to all who contribute here.
Sorry I missed this query earlier Rodney. I think in another exchange I did mention I kept my positions going into the weekend. UVXY just starting to pierce upper B band. Should blow right through it for a third down at intermediate degree; certainly with equal if not more momentum than it did for intermediate one down last August.
Sold my small short position at a loss – will rebuy full size position if we go under 1943.
This is looking more and more corrective to me – a iii of (iii) up shouldn’t take so long to get going. Lots of overlapping moves.
Will stay disciplined and wait for my buy target to get hit. If this is an abc correction we might only be in wave b
Back in the game – little bit of dry powder just in case we still have wave c up to go
Price testing 1945 @ 15:10 GMT – and it’s looking very likely we will soon see 1935 again.
Good news for the bears….. This will be the third test of 1935 and the third test usually breaks support, opening the door nicely for Lara’s 1920(ish) target.
At which point i will take profits and open a nice bottle of wine…
nice…
About to go negative!!
Lets hope 1943 breaks with conviction
Yes – RUT RED 🙂
hi
all
I am still a student of the MARKET dont get me wrong.
I am just saying – look it is a great decline – I cant trade the bounces its even hard for me.
I am glued on the markets 12 hours a day – so i have come to the conclusion sit tight – its hard but -> no pain – no gain.
hi
all
as I called late yesterday a bounce followed by a cash fade…
lets see if it picks up with intensity.
Yesterday we broke through the downward sloping aqua trend line on Lara’s chart. The expected resistance did not really materialize. We also broke through the gap around 1950 from back in September. Right now we are back-testing these support / resistance points. Again this is healthy for the bear count.
As far as the US jobs report, it is all ‘noise’. The market is ahead of the economy by about 8 months to a year. The market is telling us that the world economy is peaking and will not look so good this summer.
Honestly keep it simple. Don’t over think it – we are going down.
Trying to look for a bounce is almost totally impossible.
STAY FOCUSED…
I write that note to myself everyday. When you read all this notes and blogs about markets it make you question yourself.
Sometimes – i just walk away from the trading desk. I was right more times and changed my mind for no reason.
Remember last August and September when the market moved too fast too far and we got the truncated 5th wave followed by a big rally. Well, the sort of corrections we are seeing on the way down like today, IMO are really healthy for the bear count. With the corrections we keep from getting too oversold.
Agreed – it’s the only way to wear out the bulls (and alot of bears also!).
I’m very happy to go as close to 1979 as possible – risk of a large short position there is 100 times lower. It’s being in no mans land that burns!
Good point and observation Rodney.
Must admit that hadn’t occurred to me – thanks for sharing the insight,
I’m afraid the market makers are onto me…they REFUSED to give back those calls for 20 cents again!
I’ll keep trying… 🙂
leave the order GTC. If you get lucky on a bounce intra day…
And quite rightly so… Dick Turpin did at least wear a mask!!
Hey Paresh: Hope you are hanging in there buddy! 🙂
Managed to regroup and short at 200 + on the Dow. Holding on tight for now
Thank you
Just gone under 1951.85 – which if we are in a new upward impulse would be wave 1 high – means either wave 3 is extending or this move up is just corrective.
We have also fallen back into the up moves base channel.
Falling out the bottom of the base channel, followed by a move now under 1943.52 would prove this move up is corrective.
You think??!!! 🙂 🙂 🙂
I’m still shorting the market (albeit small position until we drop under 1943.52) – can’t quite hear the fat lady singing just yet.
If we have had a series of 1,2’s the pull of the wave 3 should soon show itself in all it’s glory.
We’re still a fair way off invalidation so not getting my feet too wet just yet
Just falling out the base channel – this is now either going to dive right now or shoot upwards in a 3 of 3 up (kinda covering all angles right there!!)
Buying back the cheap 80 UVXY calls I sold yesterday, thank you berry berry much! 🙂
I am taking profits on HALF my upside hedges immediately at the open as the opportunity will probably not last very long. They will be re-added for substantially lower cost at the next leg down. In a down-trend, I have found this works a lot better than stop losses…cheaper too! 🙂
After all, we all KNOW they LOVE to run our stops don’t we?
Why not make em’ pay for the privilege? lol
Does anyone believe the job numbers coming out of the Obama administration?
When you look at where the transports are over the last few months, I would have to conclude that there is a whole lot of LYING going on…I for one am not drinking that kool-aid…and who are the idiots buying US markets on this propaganda??!! Incredible! That is what algo trading looks like folks
200 + on the Dow
Just hope I can hang in to take advantage of the leg down
I don’t believe ANYTHING the US administration says 🙂
It is really so amusing listening to talking heads agonize about the obvious disconnect between such robust numbers and upward revisions, and absolutely no upward pressure on wage growth! The answer has to be obvious to even a blind person!
How many people did they just wipe out
For folk who were not hedged, over-leveraged on the short side, or aware of the gangster cartel in charge of financial markets…probably quite a few sadly… 🙁
This pop is a real gift to folk holding on to some dry powder
Gold channel top in play
PS 15% of SPX stocks trading there 50DMA is a common reversal area: We are at 17%
Beautiful chart John! Do you think the final bottom is just ahead? Looks like a triple bottom setting up.
I have been early in the miners. I am out six months so hopefully not TOO early! 🙂
ps what currency is the chart in? Loonies?
A sobering reminder for all of us that nothing is ever certain, and staying hedged is the only way to survive the machinations of the banksters…it is also amusing that they think that pushing futures up a percent or two is going to undo the carnage of the last week, or change the calculus of the global economic reality. It will be interesting to see how many people drink the kool-aid, and for how long…I don’t know about guys, but I plan on shorting the rally after cashing in my hedges…If you ever doubted the notion of bankster intervention, could there be a clearer example??!!
Greed got the better of me last night. A lot of hard work given back very quickly
When will I ever learn
I think over night trading is the new strategy to screw retail
As the bear takes hold, this kind of desperate machination is going to increase big time…get ready…ALWAYS stay hedged!
I am using hedge windfalls to bolster longer term short positions; we all know how this story ends…
Its’s kinda funny; I jokingly posted about banksters having half a trillion lying around and guess what? They did!! 😀
Looking at the way Europe has faded, and the movement of futures off their highs, I am not even sure this thing is going to open in the green…rats! I was already looking forward to a nice haul from a few of my short term hedges in anticipation of just this sort of thing and I may have been counting my chickens too soon…! Oh well, I’ll take whatever the market gives… 😀
ps If we don’t get some kind of pop at the open folks, prepare for a sea of red, which would be right in line with the wave count.
All is not what it seems Paresh…wait for the open before you despair my friend! 🙂
Thanks you Verne
And Thanks you all to your contribution
Most Welcome! 🙂
Verne
Looks like this might fade a bit 🙂
Jack
Good old HARD ROCK with SLASH!
https://www.youtube.com/watch?v=X1ZRBPA8SK0
Hey man, thank you
np man!
Options2014- I was hoping for more Cœur de Pirate to keep the party going! ?
I know – I love the piano… but these guys are good too:
i am a huge indie rock fan…
https://www.youtube.com/watch?v=ATxs0N_DFTw
thank you Lara!