
The preferred bear Elliott wave count is better supported by classic technical analysis.
Summary: A downwards trend is still in place. The preferred bear wave count expects a big third wave is in the early stages. The final invalidation point is at 2,116.48. The target for this third wave is at 1,428. In the short term, a B wave may move higher tomorrow up to about 2,030. If price continues lower tomorrow, that idea may be discarded below 1,958.46. At that stage, expect surprises to the downside.
To see how each of the bull and bear wave counts fit within a larger time frame see the Grand Supercycle Analysis.
To see detail of the bull market from 2009 to the all time high on weekly charts, click here.
Last published monthly charts can be seen here.
If I was asked to pick a winner (which I am reluctant to do) I would say the bear wave count has a higher probability. It is better supported by regular technical analysis at the monthly chart level, it fits the Grand Supercycle analysis better, and it has overall the “right look”.
New updates to this analysis are in bold.
BULL ELLIOTT WAVE COUNT
DAILY CHART – COMBINATION OR FLAT
Click chart to enlarge.
This wave count is bullish at Super Cycle degree.
Cycle wave IV may not move into cycle wave I price territory below 1,370.58. If this bull wave count is invalidated by downwards movement, then the bear wave count shall be fully confirmed.
Cycle wave II was a shallow 0.41 zigzag lasting three months. Cycle wave IV should exhibit alternation in structure and maybe also alternation in depth. Cycle wave IV may be a flat, combination or triangle. The two daily charts look at these three possibilities.
Cycle wave IV may end within the price range of the fourth wave of one lesser degree. Because of the good Fibonacci ratio for primary wave 3 and the perfect subdivisions within it, I am confident that primary wave 4 has its range from 1,730 to 1,647.
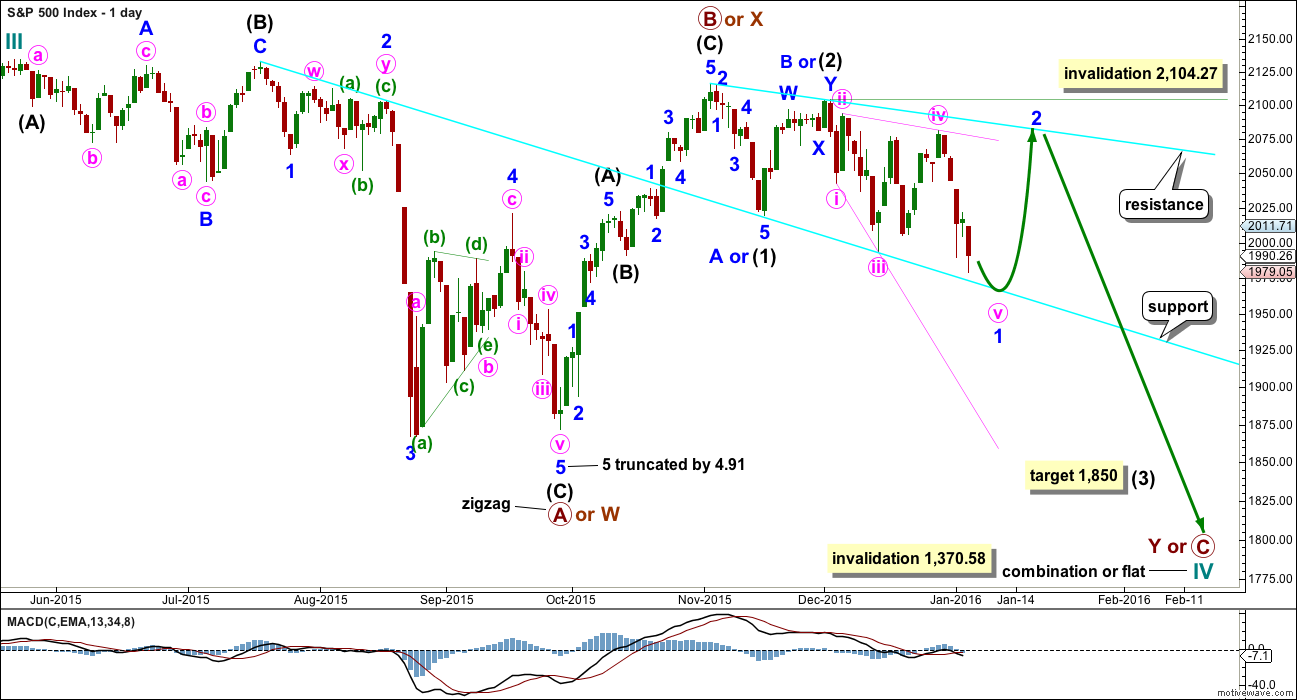
If a zigzag is complete at the last major low as labelled, then cycle wave IV may be unfolding as a flat, combination or triangle.
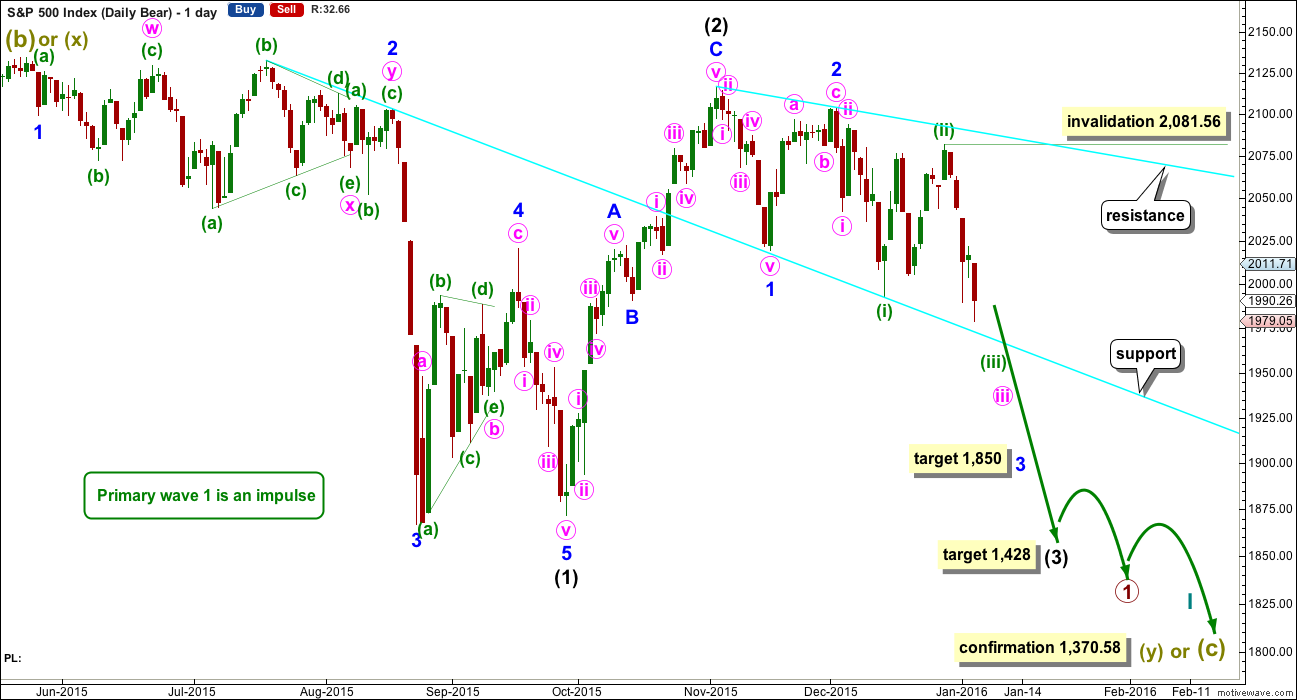
Primary wave C should subdivide as a five and primary wave Y should begin with a zigzag downwards. This downwards movement is either intermediate waves (1)-(2)-(3) of an impulse for primary wave C or minor waves A-B-C of a zigzag for intermediate wave (A). Both these ideas need to see a five down complete towards the target, so at this stage there is no divergence in expectations regarding targets or direction.
Primary wave A or W lasted three months. Primary wave C or Y may be expected to also last about three months.
Within the new downwards wave of primary wave C or Y, a first and second wave, or A and B wave, is now complete. Intermediate wave (2) or minor wave B lasted a Fibonacci 13 days exactly. At 1,850 intermediate wave (3) or minor wave C would reach 2.618 the length of intermediate wave (1). At this stage, this will be the sole target for this third (or C) wave to end as it fits better with more short term targets calculated at the hourly chart level.
No second wave correction may move beyond its start above 2,104.27 within intermediate wave (3) or minor wave C. This invalidation point allows for the possibility that there may be a leading diagonal unfolding for a first wave down. Leading diagonals in first wave positions are often followed by very deep second wave corrections. When the structure of minor wave 1 is complete, then a deep zigzag for minor wave 2 would be expected which may find resistance at the upper cyan trend line.
DAILY CHART – TRIANGLE
Click chart to enlarge.
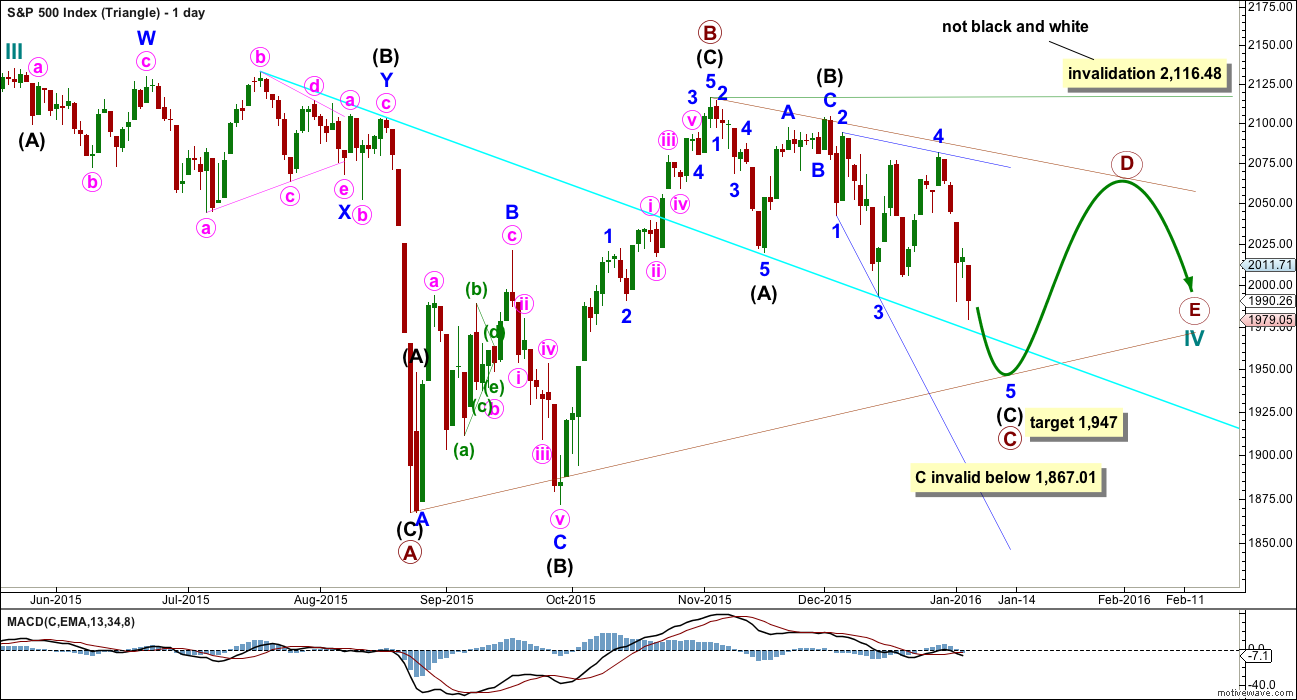
Cycle wave IV may unfold as a shallow triangle. This would provide alternation with the 0.41 zigzag of cycle wave II.
The triangle may be either a regular contracting or regular barrier triangle. An expanding triangle would also be technically possible, but as they are the rarest of all Elliott wave structures I would only chart and consider it if it shows itself to be true. Prior to that, the probability is too low for consideration.
Primary wave B would be a complete zigzag. The subdivisions all fit and now it has a clearer three wave look to it.
Primary wave C should unfold downwards as a single or double zigzag. So far it may be a single zigzag, with intermediate wave (C) unfolding as an ending expanding diagonal. At 1,947 intermediate wave (C) would reach 1.618 the length of intermediate wave (A).
Primary wave C may not move below the end of primary wave A at 1,867.01. This invalidation point is black and white for both a contracting and barrier triangle.
When primary wave C is complete, then primary wave D upwards should unfold as a single or double zigzag. For a contracting triangle, primary wave D may not move beyond the end of primary wave B above 2,116.48. For a barrier triangle, primary wave D should end about the same level as primary wave B at 2,116.48. The triangle would remain valid as long as the B-D trend line remains essentially flat. This invalidation point is not black and white. This is the only Elliot wave rule with any grey area.
Thereafter, primary wave E downwards may not move beyond the end of primary wave C.
The whole structure moves sideways in an ever decreasing range. The purpose of triangles is to take up time and move price sideways. Price exits the triangle in the same direction that it entered, in this case up. When the triangle is complete, then the bull market would be expected to resume. This triangle should take several months yet to complete.
Today, both hourly charts will look at the structure of movement from the swing high on 29th December.
HOURLY CHART
Click chart to enlarge.
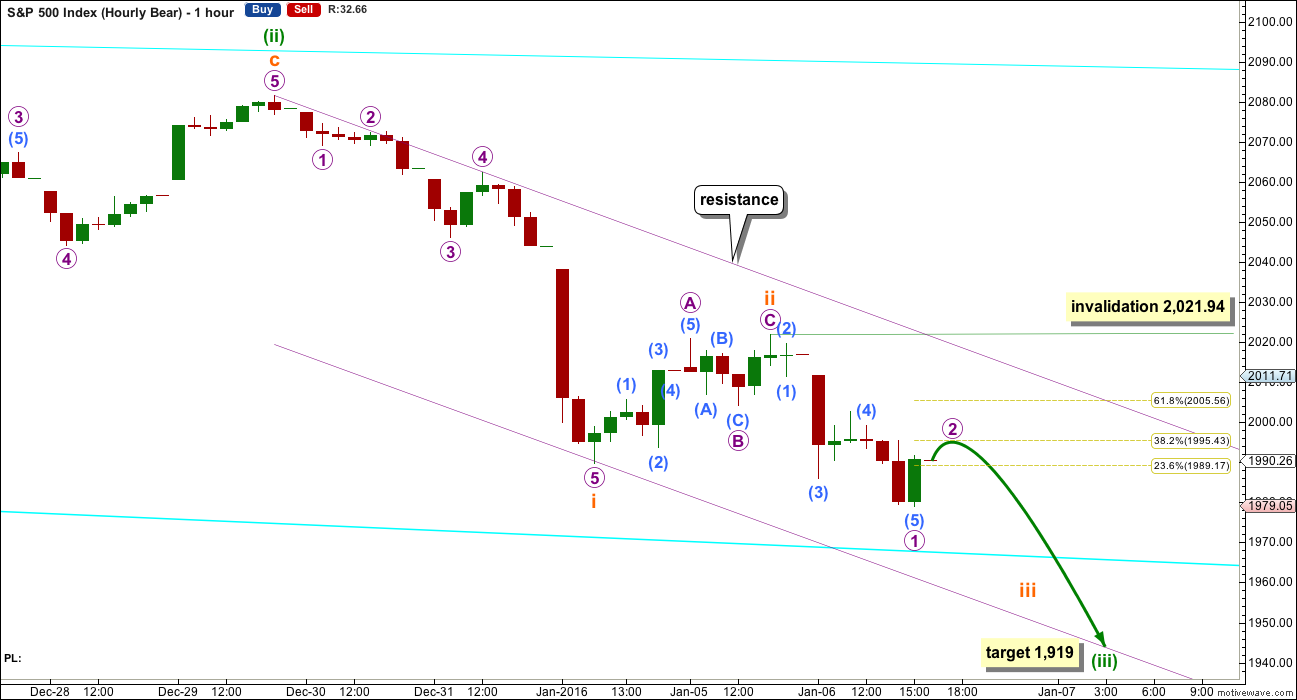
This hourly chart follows on directly from the labelling of the main daily chart.
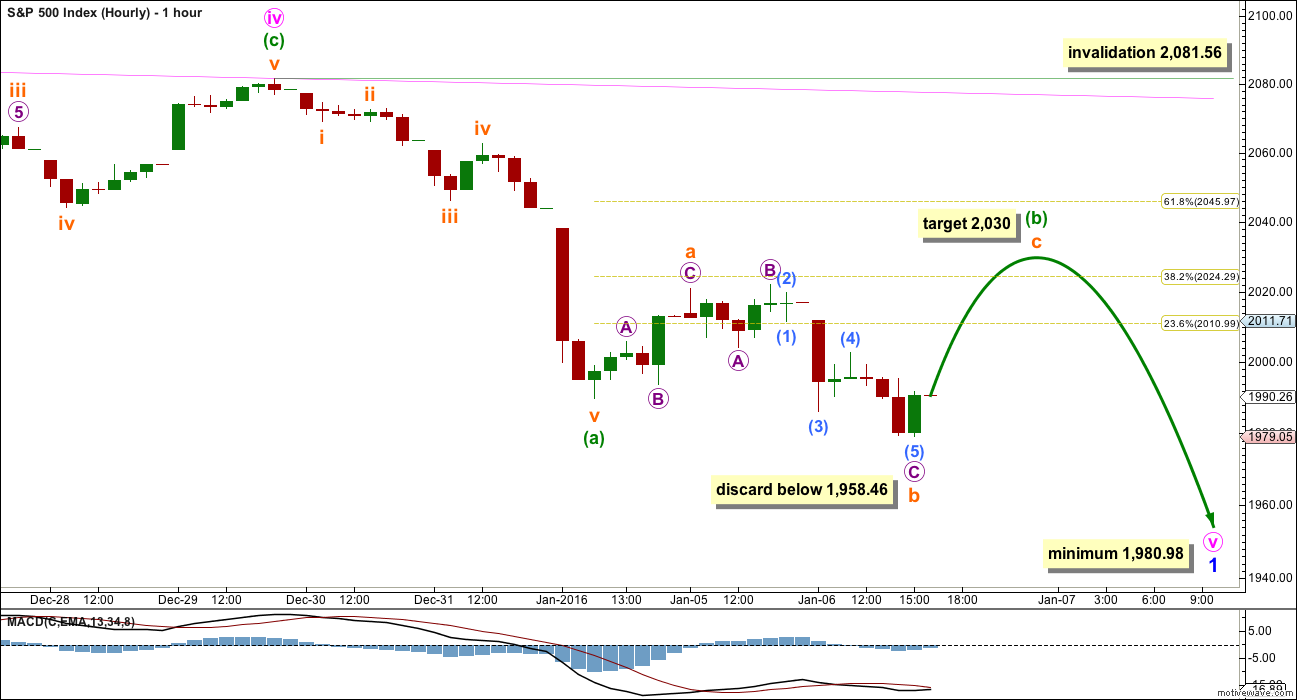
The final fifth wave of the diagonal is underway. It is most likely to subdivide as a zigzag.
Within the zigzag, it would be very unlikely for minuette wave (b) to be over at Tuesday’s high. It would have lasted just one day and be too brief and shallow. What is much more likely for the possible B wave is for it to continue further.
There are 23 possible corrective structures a B wave may take. At this stage, it may be an expanded flat, combination or a running triangle. An expanded flat is more common, so that is how I am labelling it. But if it continues further, the labelling may change as the structure becomes clearer.
Of all Elliott waves, it is B waves which exhibit the greatest variety in form and structure, are the hardest to analyse, and the most difficult to trade. Low degree B waves should not be traded. They are too unpredictable, most especially the small movements within them which go against the trend one degree higher.
If minuette wave (b) is unfolding as an expanded flat as labelled, then within it subminuette wave a subdivides as a three. Subminuette wave b also subdivides as a three and is a 1.34 length of subminuette wave a. This is within the normal length of 1 to 1.38.
There is no maximum length for a B wave within a flat correction, but there is an Elliott wave convention which expects that when the possible B wave reaches 2 times the length of the A wave the probability that a flat is unfolding is so low the idea should be discarded. That price point would be reached at 1,958.46. A new low below this point would mean that minuette wave (b) was over and minuette wave (c) downwards is underway towards the target.
At 2,030 subminuette wave c would reach 1.618 the length of subminuette wave (a).
Minuette wave (b) may not move beyond the start of minuette wave (a) above 2,081.56.
The possible diagonal for minor wave 1 is expanding, so minute wave v must be longer than minute wave iii. Minute wave v must end below 1,980.98. This is a minimum, not a target. When minuette wave (b) can be confirmed as over, then the ratio between minuette waves (a) and (c) may be used to calculate the downwards target.
BULLISH ALTERNATE WAVE COUNT
Click chart to enlarge.
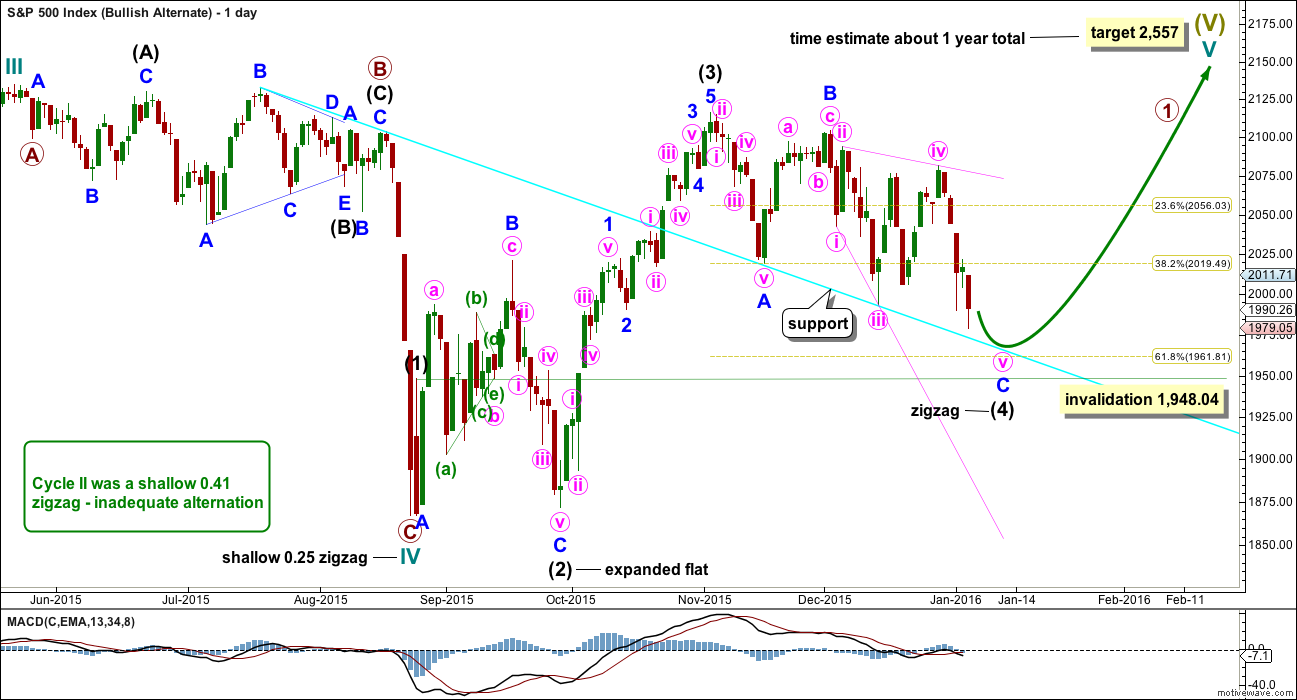
I can again see the possibility that cycle wave IV is over and upwards movement may be the start of cycle wave V.
If cycle wave IV is over, as labelled, then there is inadequate alternation between cycle waves II and IV. Cycle wave II was a shallow 0.41 zigzag. Here, cycle wave IV is a more shallow 0.25 zigzag. Both are the same structure.
If cycle wave V has begun, then primary wave 1 within it may be an incomplete impulse. At 2,557 cycle wave V would reach equality in length with cycle wave I. If it also is the same in duration as cycle wave I, then it may last a year.
Intermediate wave (2) was a deep 0.94 expanded flat within primary wave 1. Intermediate wave (4) would be an incomplete zigzag which would also be relatively deep when it is complete. Minor wave C must complete as a five wave structure downwards, and at this stage it may be an incomplete ending expanding diagonal. Intermediate wave (4) may not move into intermediate wave (1) price territory below 1,948.04.
This wave count does not have any support from regular technical analysis. I do not have any confidence in it. It is presented as a “what if?” only, to consider all possibilities.
BEAR ELLIOTT WAVE COUNT
DAILY CHART
Click chart to enlarge.
This bear wave count fits better than the bull with the even larger picture, super cycle analysis found here. It is also well supported by regular technical analysis at the monthly chart level.
Importantly, there is no lower invalidation point for this wave count. That means there is no lower limit to this bear market.
The downwards movement labelled intermediate wave (1) looks like a five. If minor wave 2 is seen as a double flat with a triangle for wave X within it, then the subdivisions all fit nicely.
Ratios within intermediate wave (1) are: minor wave 3 is 7.13 points short of 6.854 the length of minor wave 1, and minor wave 5 is just 2.82 points longer than 0.618 the length of minor wave 3. These excellent Fibonacci ratios add some support to this wave count.
Intermediate wave (2) was a very deep 0.93 zigzag. Because intermediate wave (2) was so deep the best Fibonacci ratio to apply for the target of intermediate wave (3) is 2.618 which gives a target at 1,428. If intermediate wave (3) ends below this target, then the degree of labelling within this downwards movement may be moved up one degree; this may be primary wave 3 now unfolding and in its early stages.
Within intermediate wave (3), minor waves 1 and 2 are complete. The upwards movement for minor wave 2 does have a strong three wave look to it at the daily chart level. Minor wave 2 was another deep correction at 0.87 of minor wave 1. At 1,850 minor wave 3 would reach 2.618 the length of minor wave 1. If price falls through this first target, then the next Fibonacci ratio in the sequence is 4.236 which would be reached at 1,693. If minor wave 3 is very extended, then the degree of labelling for all downwards movement from the all time high will be moved up one degree.
It is still possible (but still less likely) that primary wave 1 is unfolding as a leading diagonal. I will keep that chart up to date and will publish it if and when it begins to diverge from the idea presented here. For now I want to keep the number of charts published more manageable.
A line from the ends of intermediate wave (2) to minor wave 2 is drawn. This line may show where any further upwards movement finds resistance.
For the bear wave count today, I have two ideas for downwards movement from the end of intermediate wave (2): either a series of overlapping first and second waves or a leading expanding diagonal. This first chart looks at a series of overlapping first and second waves. The only problem with this idea is the brevity of minute wave ii when compared to minuette wave (ii) one degree lower which lasted ten times the duration.
The idea presented with the bull wave count also works in the same way for the bear wave count: a leading expanding diagonal may have begun at the high labelled minute wave ii.
HOURLY CHART
Click chart to enlarge.
It is possible to see the upwards movement to the high labelled subminuette wave ii as a complete zigzag.
If this idea of a series of overlapping first and second waves is correct, then subminuette wave ii should be over. There would now be a third wave down at five wave degrees. The third wave would now be getting very close to the middle strongest part. There should be enough of a strong downwards pull to force low degree second wave corrections such as subminuette wave ii to be more brief and shallow than normal.
At 1,919 minuette wave (iii) would reach 1.618 the length of minuette wave (i). If this target is wrong, it may not be low enough. The next Fibonacci ratio in the sequence is 2.618 which would be reached at 1,818.
Another first wave for micro wave 1 may now be complete. Micro wave 2 may move slightly higher. The preferred target for it would be the 0.382 Fibonacci ratio about 1,995. It should be over quickly.
This idea expects big surprises to the downside. A strong increase in downwards momentum should unfold over the next few days.
This is not my preferred wave count for short term movement, but the implications are very important. It is entirely viable and members must be mindful of the potential for very strong downwards movement very soon.
If the next three days price action does not see price move very strongly lower, then this idea of overlapping first and second waves may be discarded.
ALTERNATE DAILY CHART
Click chart to enlarge.
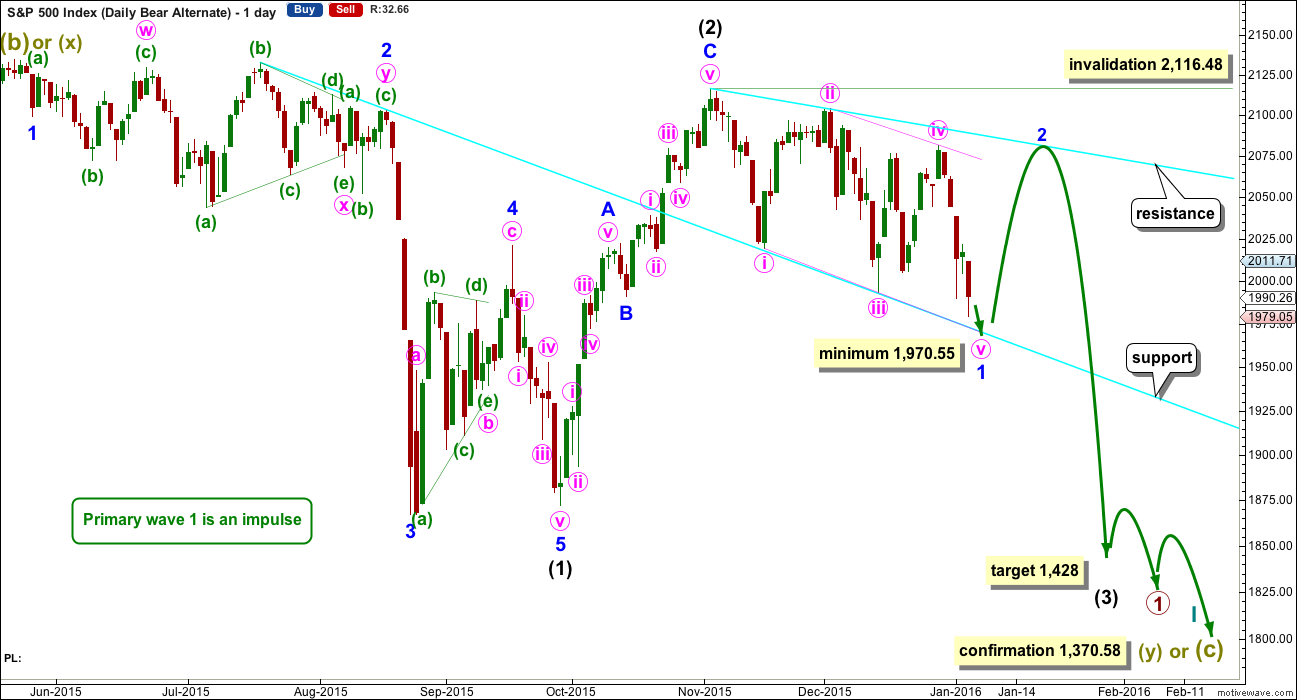
This bear wave count is identical to the first bear daily chart right up to the high labelled intermediate wave (2).
Thereafter, it looks at the possibility that a first wave leading diagonal may be unfolding.
The diagonal would be expanding and may have begun earlier than the chart for the bull daily wave count. Minute wave iii is longer than minute wave i, and minute wave iv is longer than minute wave ii. The trend lines diverge, just.
Minute wave v must be longer than minute wave iii, so it must end below 1,970.55.
Leading diagonals in first wave positions are often followed by very deep second wave corrections. When minor wave 1 may be seen as complete, then minor wave 2 should unfold over a couple of weeks and may find resistance at the upper cyan trend line. It may not move beyond the start of minor wave 1 above 2,116.48.
The target for intermediate wave (3) is also the same, only the pathway along the way down here is seen differently.
In the short term, the structure on the hourly chart is also the same as the first hourly chart. A zigzag downwards for minute wave v would be unfolding. In the short term, minuette wave (b) may not move above the start of minuette wave (a) at 2,081.56.
Once the zigzag downwards is complete, then how high the next bounce goes and how long it lasts may begin to illuminate which of the three ideas for this move since the high on 2nd November (here labelled intermediate wave (2) ) is correct.
TECHNICAL ANALYSIS
DAILY CHART
Click chart to enlarge. Chart courtesy of StockCharts.com.
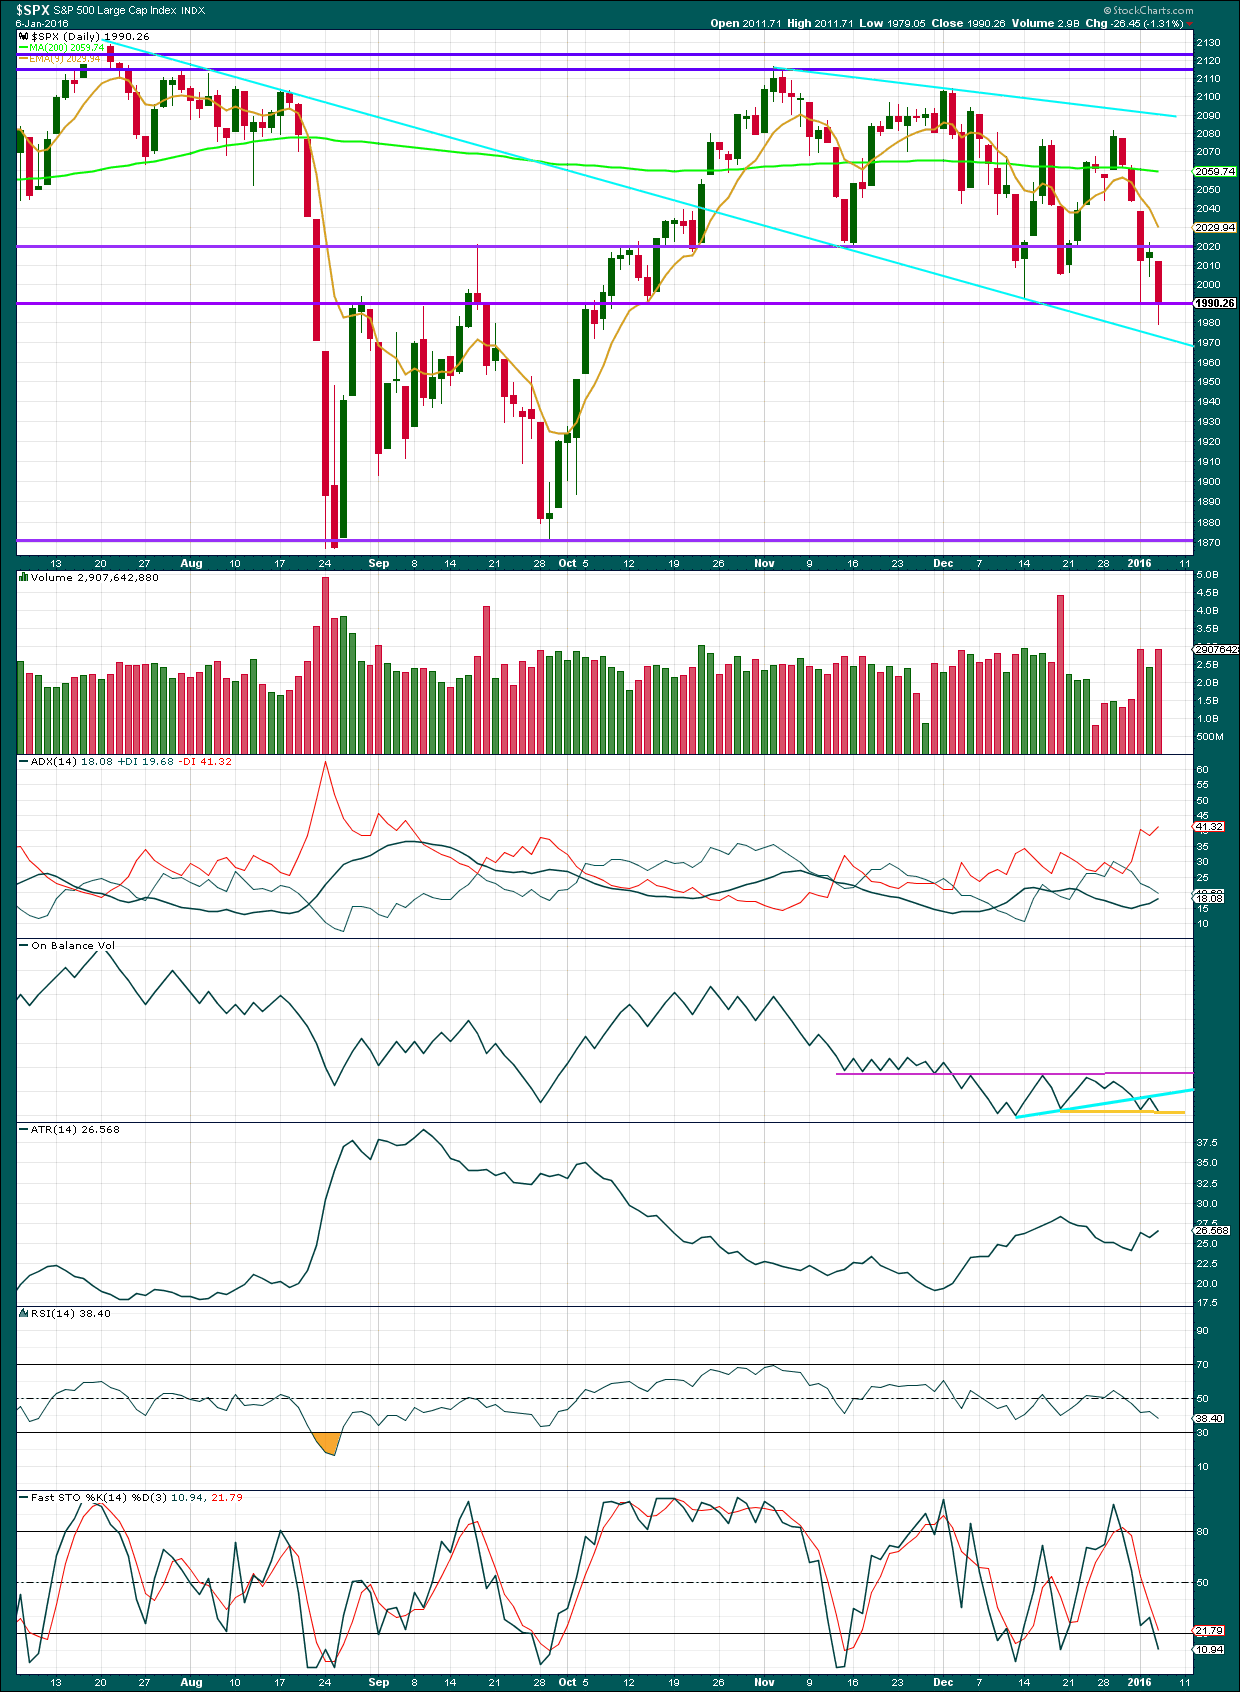
Volume for Wednesday is respectably higher than the prior upwards day. Again, a fall in price is supported by volume although it was not stronger than the last downwards day. Since the high of 3rd November, 2015, there is a series of lower highs and lower lows. Each time price falls volume rises and each time price rises volume falls. This volume and price profile is bearish.
The long lower wick for Wednesday’s candlestick is a little bullish. The bears pushed price comfortably lower but were not able to keep price at lows for the day. The bulls rallied at the end of the session to push price upwards by a third of the daily range. Overall, the candlestick is bearish but with a slight bullish hue. This may be a warning that the first hourly Elliott wave chart could be correct; we may see a green candlestick tomorrow.
Price found support today at the purple horizontal trend line about 1,990, closing close to it. If price manages to close below this line, then I would expect some free fall to the next support line about 1,870. But while price has not closed below 1,990, it must be accepted that a bounce could occur here to the next line of resistance at 2,020.
Both ADX and ATR are in agreement today: there is a trend and it is down.
I have drawn a new very short term trend line on On Balance Volume in yellow. If tomorrow OBV breaks below that line, it would be further bearish indication. So far OBV keeps breaking trend lines to the downside and this is usually a fairly reliable indicator. OBV remains bearish.
Stochastics is now reaching oversold, but in a trending market this oscillator may remain extreme for long periods of time. The best use of it is to look for small divergences to warn of corrections against the trend.
RSI is still close to neutral. There is plenty of room for this market to fall.
DOW THEORY
For the bear wave count I am waiting for Dow Theory to confirm a market crash. I am choosing to use the S&P500, Dow Industrials, Dow Transportation, Nasdaq and I’ll add the Russell 2000 index. Major swing lows are noted below. So far the Industrials, Transportation and Russell 2000 have made new major swing lows. None of these indices have made new highs.
At this stage, if the S&P500 and Nasdaq also make new major swing lows, then Dow Theory would confirm a major new bear market. At that stage, my only wave count would be the bear wave count.
S&P500: 1,821.61
Nasdaq: 4,117.84
DJT: 7,700.49 – this price point was breached.
DJIA: 15,855.12 – this price point was breached.
Russell 2000: 1,343.51 – this price point was breached.
This analysis is published about 07:04 p.m. EST.
Verne
Notice how busted the BOLLINGER BAND IS JUST LIKE LAST AUG BEFORE THE FLASH CRASH.
Or
We could just be going up into the REPORT TOMORROW TO REVERSE?
Or
take it up 1-3 days upto 2,000 then pull the rug?
Take your pick and trade safe 😉
Since EWT is ultimately a measure of sentiment, how high the rally goes short term will be really great insight in seeing how well the banksters have managed to affect it in the short term. Only the most clue-less would believe just because futures jump overnight suddenly happy days are here again, notwithstanding the persistent bullishness of the masses as reflected in the relatively restrained move in volatility. I am going on record that this “rally” is going nowhere and I predict it will get nowhere near 2000. Europe is already fading.
DON’T LET THE BANKSTERS BAMBOOZLE YOU FOLKS! 🙂
ok lets see..
It would appear the Chinese are taking a page out of the FED’s playbook, and judging from the reaction of US futures, in co-ordination with them. This is truly amazing.
At the same time they loudly trumpet the cessation of their “circuit breaker” policy for today’s market open, they apparently at the same time pump in tens of billions into the market pushing it up over two per cent to “magically” achieve success for the new policy,
WOW! IS THIS GOING TO WORK???!!!
It had better. If their retail investors don’t buy it, the Chinese markets are going to really blow up.
We clearly have our erstwhile FED banksters working in close co-operation with this latest round of market manipulation.
IT WILL STILL END BADLY!!!
This is the kind of thing that has me wondering if we are ALREADY in primary wave territory…
An awful lot of stops were run for after hours traders in short positions…incredible!!!
If it is true that the markets can be manipulated, then what the CCP is doing with the Chinese market should work.
After all, the CCP is the closest to a God of markets there ever will be.
They can write the rules to suit themselves, have a large portion of funds in their stock market invested in that market and under their control, they can create as much $$ as they like and put it wherever they like. They have a strong control over that market.
And yet… everything they have done so far is overall not working.
I can buy the idea that markets can be manipulated short term, and for small movements. But not for the primary degree trend.
I’m just not buying it.
And neither is the Shanghai composite to date.
IF we are right and IF my main bear wave count is right, then these markets should continue to free fall.
IF that happens… then I would just love to see the argument that “all the markets are manipulated all the time” in terms of the primary degree trend of markets, finally and completely laid to rest.
I believe in Lara!
Please don’t.
Believe in yourself.
Do your own due diligence. Use my EW analysis as just one tool in your decision making tool kit.
I am most uncomfortable with people relying too heavily on me.
I know you do your own analysis, it’s just the sentiment expressed in your comment which makes me most uncomfortable.
*Edit to add: if I’ve misunderstood your comment please let me know.
oh sorry – I was saying basically my view is reinforced with your research!
I also expressed a few weeks back that i think it is almost impossible to manipulate the US Equities market.
so I believe in it!
I don’t disagree at all. You are absolutely right about the Chinese- its not as if they have not been trying and it did not stop the current melt-down. I am just pointing out the absurdity of the attempt. My comment that “it had better work” was thinly veiled sarcasm! What they are clearly trying to do at this stage is manipulate SENTIMENT (of the gullible)-ultimately, it will not change the outcome of this bear market IMHO, short term machinations notwithstanding – I am shorting the rally 🙂
It is all part of the BIG DECLINE! a 1-3 day bounce even up to 2,000 won’t make me change my MIND!
I am riding this WAVE up/sideways/down. It is PAINFUL but no pain – no gain!
The preferred wave count today really should be the hourly bear presented here; a series of 1-2, 1-2 now moving to the middle of 3.
And it’s not there yet.
If that is correct then tomorrow should continue lower.
If volume today is high and RSI does not reach oversold, expect tomorrow to continue down. I’m going to hold my short position tomorrow.
Price has only not broken below a base channel about subminuette i and ii. So to have a textbook look this downwards movement may increase in momentum tomorrow to do that.
Hourly bear chart updated here.
Next support line on my classic TA chart is about 1,870
Thanks Lara for the intraday update.
You may soon be able to make that huge bear market call that you have been presenting for the last several weeks and months.
I sure hope so. It would reduce the number of charts I’m managing to a more reasonable amount.
Many thanks 🙂
Huge block purchases of DJI and SPX futures. Up over 1% Banksters have declared war on the bears!!!!
On the NYSE:
On-Balance volume should be hugely negative today as well as a big increase in total volume. Declining issues outpace advancing by almost 7 to 1. New highs are 18 to 469 new lows. This is a broad market sell off with strong momentum.
Yep. It’s looking very bearish indeed!
On Balance Volume has been a great indicator for this market. It just keeps breaking any trend lines I can find on it… downwards.
And price follows 🙂
My uvxy 80 calls are still rocking and rolling…no reversal signal so far…unloading half at 70 cents just to be safe…I think we get that spike tomorrow…
Congrats – great trade! I’m hoping you’re wrong as I will miss out, but at the same time hope it works out for you 🙂
Anyone taking money from the bankers is a good cause in my book.
I am playing with house money as I got em’ for 20 cents, This market behaves very UNpredictably so who knows if that spike will come. Both VIX and UVXY printing fat red candles on the five minute chart.
I’ve heard people love the smell of money – but HOUSE money – that there is a whole different level of beauty
I’m 33% back in the game following Lara’s update. No point paying a subscription unless you listen to it!!
i generally exit positions far too early – so have no doubt Lara is on the money
That was a very prudent move Olga. Kudos to Lara for that heads up. I was leaning that way but coming from her spurred me to act on the courage of my convictions so to speak. Sure glad I boosted my short exposure. DOW futures already down 400. A sweet UVXY short is shaping up quite nicely…look for that blast through the upper BB tomorrow or Monday. I just LOVE third waves!!!
I sure hope I’m right.
I’m holding my short too… so I’m putting my money where my mouth is 🙂
I’ll move my stop down to just above the invalidation point on the hourly chart to protect some profit. That makes me happy.
I had no doubt but you can’t say fairer than that.
With over an hour to go, it looks as if we may be getting that intra-day reversal. Let’s see how much of today’s decline gets retraced toward the close. If this is an interim bottom, even though VIX just at upper BB, it generally goes a bit higher and closes red the actual day of reversal…of course that COULD still happen today…we need to stay above 1940 for the bullish case 🙂
Small degree move down to recent new low (1941) looked like 3 waves (b wave) – so again this move up should be a (fast scary) c wave (so corrective). But I am now being VERY cautious.
This is an example when a 5 up might not be a reversal (but it still might be!!)
If we have a series of 1-2’s and now 3’s, we should expect a series of 4-5’s before we get a sustainable upward correction.
With 50 minutes to go, it looks like we have just completed an a-b-c (5-3-5) correction and are beginning the next wave down from 1953. If so, we may close at the low of the day.
My (limited) counting, counts 5 waves down for wave c of the diag – so I’m being MEGA cautious.
Nearly out of my positions – will probably sell all at days end and see here we are tomorrow.
If we gap down again tmorrow I will not be a happy bunny.
Looks like we hit a bottom in a final fifth down. If we have we should climb toward the close and see futures go North…
Whoa – someone lit the gas! New lows or a wave 2???
If it was the start of a new upward trend it should not have made a new low as three waves I think…we still need five up to get things going..
Absolutely (unless ending diag – which it is not) – but stranger things have happened in my experience.
I try not to argue EW intricacies with a rapidly deteriorating position!!
This current move down (currently) looks like a good 5 wave down contender (poss in iv now)
wave 1 inval of this poss small degree wave 5 down 1950 – it’s failed to get there as yet!
Wave iv taking its time (poss extending??)
Lara is sure to kick my butt for over analysing waves on 1 min chart!!! 🙂
I forgot about the diagonal as I am oh so bearish! 🙂
This is why i love holding credit spreads as you can see what the market makers are thinking in real time. My calls have now backed off to 68 cents and I am keeping a sharp eye..
Got to admit that my knowledge of options and spreads is very limited. I’m fairly plain vanilla
i find trading hard enough without buying stuff I don’t really understand!!
New lows as expected – I’ve been taking profits into this. Though we still at least should see a 5 down before a reversal
This new low to 1938.73 still looks like a 3 down to me at very small degree
ok this now has my attention!! I’ve now only got a tiny position – but getting twitchy
Above 1953 and I’ll bail – await some dust to settle.
i can now count a very small degree 5 up from the lows – but it still could be a wave c
Just seen Laras update – I think I should reconsider!!
Exactly the reason this site it worth its weight in gold
Following Laras update now 33% back into some UVXY and VIXY positions.
Nobody has a crystal ball but also nobody knows EW as well as Lara imho. If it works out it does, if it doesn’t then I’ll lick my wounds and fight on!!
I sure did! Was able to execute a few after-hours additional trades on the short side…
No worries. Those UVXY and VIXY position will explode to the upside tomorrow. We have yet to see a truly fat green candlestick during this decline and that is absolutely amazing. It could be a ways down yet as we generally get several big green candles during this kind of sell off…
Did you see a five up already? I don’t see a high up from today’s low of 1941.27
Depending on what happens tomorrow, I imagine Lara will also start to take another look at what degree of decline we may be looking at.
If we are in a leading diagonal we should see an interim bottom tomorrow. UVXY just penetrating upper band. If it makes a slight new high and prints a red candle tomorrow we bounce from these levels. If it is third, the BB bands explode and all H-e double toothpicks breaks loose..
Please see my comments just below – we might be close to a reversal. Than again I could be completely wrong.
All in good faith – just dont want anyone (inc me) to miss it!!
I’ve lightened up my position just in case!!
Usually these kinds of reversals after such a steep decline happen intra-day. It will be interesting to see what futures do overnight. I agree with your take on the diagonal wave relationships; if the the diagonal is in play we really should get a bounce just about here…the days with long lower wicks were head fakes; I wonder if an absence of a wick to day is of opposite significance…we could wake up to stratospheric futures tomorrow from this unpredictable market…
Agreed – trading has been pretty good so I’m totally paranoid about the market taking profits back.
If this is a diagonal it will play perfectly into my hands – for that reason alone I am very sceptical it will play out – but you never know.
To lock and load on a big move up would be the icing on the cake.
I am still sitting on the buy side of a few few hedges from some bearish call spreads…if they start to pop that would be a good clue a reversal was under way…I’ll let you know the minute they ignite… 🙂
After reading Lara’s update comments I actually added a few short positions. Let’s hope we keep heading lower…I think at least last August lows should be in this wave’s sights…
One of the bullish alternates is now invalidated with a move below wave 1 high @ around 1948 (the count Lara had little confidence in). Another piece of the jigsaw in place. We could still be in a Bullish triangle
The cards are starting to stack in the Bears favour
And we are below the lower of the two downward sloping Aqua trend lines. That was potential support that did not materialize. I guess this demonstrates the power of the current waves. I wonder if Lara can surf this one!
Are you kidding? She can surf ANYTHING! 🙂
Yep Yep Yep! I am feeling VERY bearish… 🙂
Chris Kimble is reporting something I had noticed, namely transports plunging through a triple bottom. He’s reporting that they are also breaking down through a 20 yr channel. I suspect the senior indices will follow transports in at the very least taking out the August lows before we see a meaningful reversal. When that assault on those lows begin it should be pretty momentous…
RUT is also below the August – September lows and not far from October 2014.
Yes Sir!
Hi Lara,
This morning’s low is 1954.47 below 1,958.46. Can we say minuette Wave (b) was over? If so, what is target of minuette Wave (c)? Do you have any more comment on the structure of minuette Wave (c)?
Thanks.
Apologies – I realise that was not aimed at me, but it is a very interesting question. imho b must be over as it has now gone too low – but we now have a 5 down for proposed c so the wave 5 zig zag could be complete. c = a at about 1931 by my calculations.
If we bounce around 1931 I’ll be lightening my volatility trades and keeping an eye on a poss reversal.
I’m travelling currently so tech analysis from my mobile is a bit sketchy
For this poss c of 5 (diagonal down), I calc that wave 5 will equal wave one at about 1940 – just below where we are currently. I’m keeping an eye out for a reversal for sure!!
Index continues to fly a series of bear flags.
What happens when China runs out of monetary reserves?
They have been burning through their stash at an astonishing rate.
guess they are……. day long flags
If the pattern holds, we should drift down past this morning’s lows and then reverse for partial re-tracement into the close. The way this thing is going it seems to me we need futures down overnight a few hundred points for that final VIX spike to conclude this leg down.
Evidence I think of ongoing CB intervention. This is not good…not good at all. It keeps the market from finding its necessary bottom prior to starting any kind of sustainable rally and really screws up the price discovery process. If they keep doing this, we are eventually going to see futures down a hundred points or more. VIX and UVXY saying no one too worried…yet….
China has announced that they are suspending their circuit breakers. They realize what you have said in that the market must determine the bottom not the manipulators. Will the US manipulators do the same?
However, since EW measures the psychology of the market, should it not also encompass the manipulators as well?
I had quite a discussion with the guys at EWI and they contend that the theory accounts for the psychology of the interventionists as well. I think at the least it makes for more complex wave forms, if not affecting wave target prices. It is a very good question and I am not sure I have a good answer.
The Chinese have made a smart call and we should see a lasting bottom over there quite soon.
Lets see if this line is in play ES HR
PS , we are in the last 1/2 HR of euro market trading
Vern–would you give more explanation of a possible 10X trade?
“The 10X trade should be here in about a week.”
I sent you an e-mail a while back with all the details Davey. I guess you must have forgotten. It is essentially a short of volatility at interim market bottoms.
For educational purposes only, I bought a ton of Jan expiration UVXY 80 calls a few days ago for 20 cents and they are probably going to go to a buck or two. At the interim bottom they would make an excellent candidate for put options…I generally look at the BB bands for UVXY to get an idea of when a bottom is approaching…for educational purposes only… 😀 😀
Vern–Yes you did and thanks, your UVXY strategy is fascinating and I hope you keep us all updated as you implement. Don’t know if I will attempt but would certainly like to observe a pro in action.
You answered my question with “interim market bottoms”. I was wondering if you intended to apply your UVXY strategy to mid-size or major wave. I will guess that playing smaller waves requires considerable experience and skill.
UVXY upper BB band penetration can happen at practically any degree wave decline and is generally a good shorting opportunity. You are quite right in that most people loose money trying to trade UVXY as they don’t have a reliable, proven approach. What I have shared is 90% of one way of doing it successfully. Most welcome! 🙂
I do not want to rain on anyone’s parade, but the leading diagonal counts are still valid. The minimum targets have been met. Like many or most of you, I am short. But I am concerned about a large 2nd wave or D wave of a triangle moving towards 2075. What are the clues that this will not happen? We are really oversold and ripe for a strong rebound.
Thanks
Move up currently looks corrective to me – is still within a channel and the first wave up within it looks like 3 wave.
A 5 up 3 down at higher degree would be the first shot zcross the bow. If we break out of the base channel of todays move up then caution is advised (wave 3’s usually break out the base channel).
Lara has pointed out that the S&P does not always channel well so the above is not really black and white.
If this is wave c of an abc off the lows today, then (i) of c is at about 1966.74 – thats my first buy point – my second is at 1959.46 where possible wave b up terminates. This could by an entire correction or just wave a
I agree. We need an impulse up off the bottom to signal a trend reversal. I am also not seeing the kind of fear that signals an interim bottom. I am in fact quite surprised at how restrained volatility has been considering the size of the decline so far.
Looks like Lara’s bear count is unfolding. The charts look identical to the August decline but double the size. WOW I can’t believe we are truly witnessing this. Congrats to all who shorted with confidence and thank you Lara for your work here.
Morning. Taking profit for now at 1940
Not sure if we will get a minor bounce before selling intensifies any further but content for now and happy to sit out.
Hopefully will not miss out :-}
10:50 AM Euro time HR ES
ES Daily 10:56 AM Euro time
Tomorrow morning is probably going to frighten a lot of people. What a sell off.
Just a day or two a very well-know Wharton economics professor was blathering on about DOW 25,000.00 this year. Men like this CANNOT possibly be that stupid…or can they??!!
Central banks continuing to aggressively buy the decline and so delaying capitulation selling. Still not enough fear in the market; not by a long shot. I guess it will take 100 point down days in the SPX and 1000 down days in DJI to get the job done…the long lower wick the last three days have been misleading and false signs of a bottom. They even had me convinced…I think we are just getting started to the downside…
I hope not I’ve covered! See China have stop with the halt mechanism
Pattern is becoming quite clear. Strong impulse down with aggressive central bank buying and sideways meandering the rest of the day while shorts cover and longs pile in in anticipation of a bounce…rinse, repeat. The banksters have decided on a managed decline as opposed to a catastrophic crash down. End result is the same, it just may take a little longer; at least until the crowd figures that out and all head for the exits simultaneously… the is far too little fear in this market … 🙂
10:00 AM Euro time
Europe is going get hammered, its going be a great day for the bears and my FTSE position 🙂
All
Futures getting pushed lower big time!
Global SELL OFF NOW IN PROGRESS IMO…
Weekly on target!
Options2014, I am waiting for the French song of the day…where is it..
Jack
Bonjour –
Francis – Cœur de Pirate
https://www.youtube.com/watch?v=DcVAcnyF7Vc&list=RDCD6W_tuQUM8&index=14
Thank you
I play acoustic guitar now… with pedals and pick up speakers. Sounds amazing. I am big 80s fan!
Unless the banksters have about a half a trillion lying around that they do not mind parting with to keep these ailing markets afloat, it would appear that the scenario of a series of first and second waves is being indicated by the swoon in futures. Lara did warn us about this possibility and it sure looks like a quintuplet of third waves down is waiting in the wings…volatility should head for the outer rim…
verne
1700 in 6 days?
I think we are certainly going to smash through the August lows…
Verne
Can you share your wave count on the ES futures so I can learn please?
although TA is my strong background – i want to learn more elliot wave matey!
I am basing it on Lara’s bear chart which shows a micro three, of a subminuette three, of a minute three, of a minor three, of an intermediate three unfolding to the downside. The somnolent lack of fear in this market I mentioned is indeed about to change. The 10X trade should be here in about a week. I am afraid this is going to get a lot uglier than most people anticipate. Central banks can rig and manipulate the markets as long as the predominant human emotion is GREED….they are no match for the human emotion of FEAR…!
Wait until primary three shows up if you think this is bad…
Actually, I forgot the wave at minuette degree so we have a SEXTUPLET of third waves at micro, subminuette, minuette, minor, minute, and intermediate degrees.
The nexus between bear markets and plagues continues. An outbreak of bubonic plague has occurred in Madagascar. It would seem that the Black Death has visited more than the financial markets..
What a suprise we gapped down again!!!
Glad I kept hold of VIXY (far too small position – but at least picked up a few crumbs). Sold my position of UVXY yesterday – travelling today so can’t keep a close eye on it.
I’ve got a feeling the market will start to move fast and not look back, but there is a very remote chance we could still be about to bounce hard upwards. Don’t want to be caught buying volatility just before a significant bounce – the wrong side of UVXY is the best way I know to wipe out profits.
Hopefully we’ll get a bounce but will more likely have to scale into a position as we get closer to invalidations. Time should be on the bears side now.
Verne,
Yes – Here we go again. China down BIG SSEC -7%
Nice candles 🙂
Verne
JUST WOW -20 handles..
-100 point down day 🙂
NICE!!!
Verne,
Path of decline.
Should be a straight shot down. Probably bounce/grind at 1850 before slamming down to 1700 🙂
No JINX!
DOW futures sinking…
ES keeps on sinking back almost near days session lows. China currency updates…
Verne
Futures popped a little up and now dropping -9 handles 😉
I am on it…
Keep the focus strong….
Thanks Lara!