
An upwards day was not expected.
Price breached the near by invalidation point on the hourly chart.
Summary: A downwards trend is still expected to be in place while price remains below 2,093.84. The middle of a big third wave down is still expected to begin sooner rather than later and the target remains the same at 1,850.
To see how each of the bull and bear wave counts fit within a larger time frame see the Grand Supercycle Analysis.
To see last analysis of weekly and monthly charts click here.
If I was asked to pick a winner (which I am reluctant to do) I would say the bear wave count has a higher probability. It is better supported by regular technical analysis at the monthly chart level, it fits the Grand Supercycle analysis better, and it has overall the “right look”.
New updates to this analysis are in bold.
BULL ELLIOTT WAVE COUNT
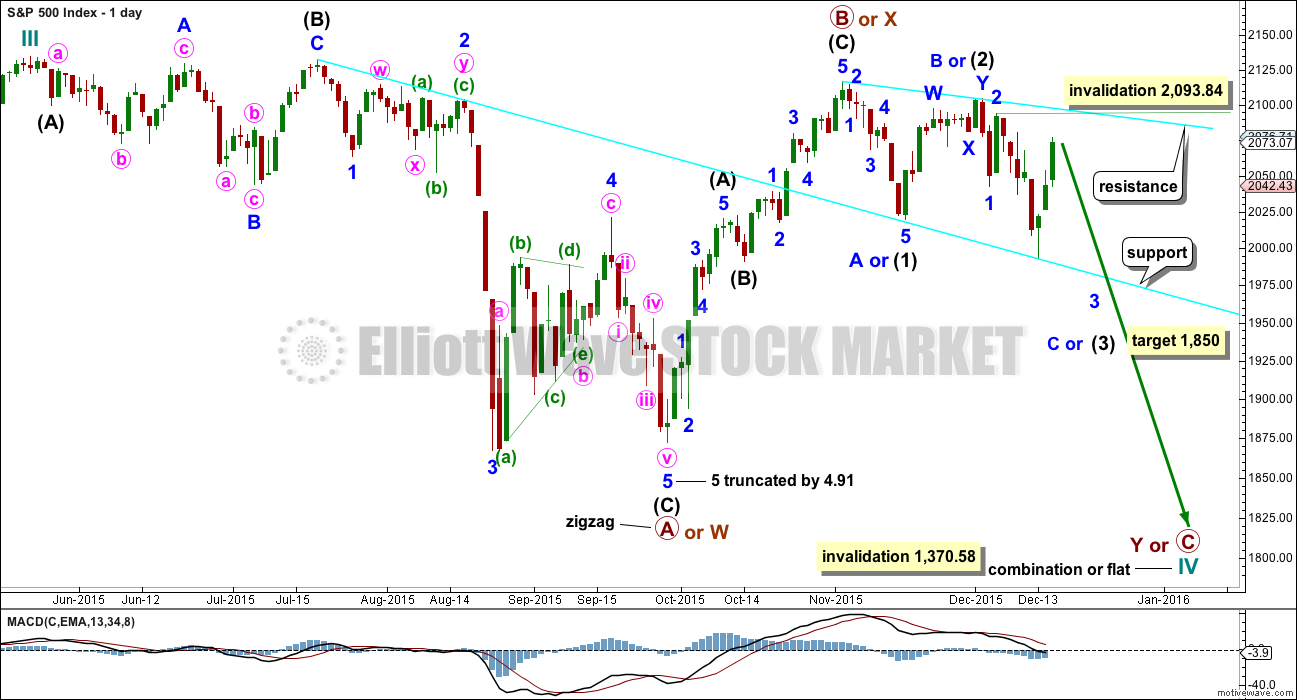
DAILY CHART – COMBINATION OR FLAT
Click chart to enlarge.
Cycle wave IV should exhibit alternation to cycle wave II.
Cycle wave II was a shallow 0.41 zigzag lasting three months. Cycle wave IV should exhibit alternation in structure and maybe also alternation in depth. Cycle wave IV may end when price comes to touch the lower edge of the teal channel which is drawn about super cycle wave V using Elliott’s technique (see this channel on weekly and monthly charts).
Cycle wave IV may end within the price range of the fourth wave of one lesser degree. Because of the good Fibonacci ratio for primary wave 3 and the perfect subdivisions within it, I am confident that primary wave 4 has its range from 1,730 to 1,647.
If a zigzag is complete at the last major low as labelled, then cycle wave IV may be unfolding as a flat, combination or triangle.
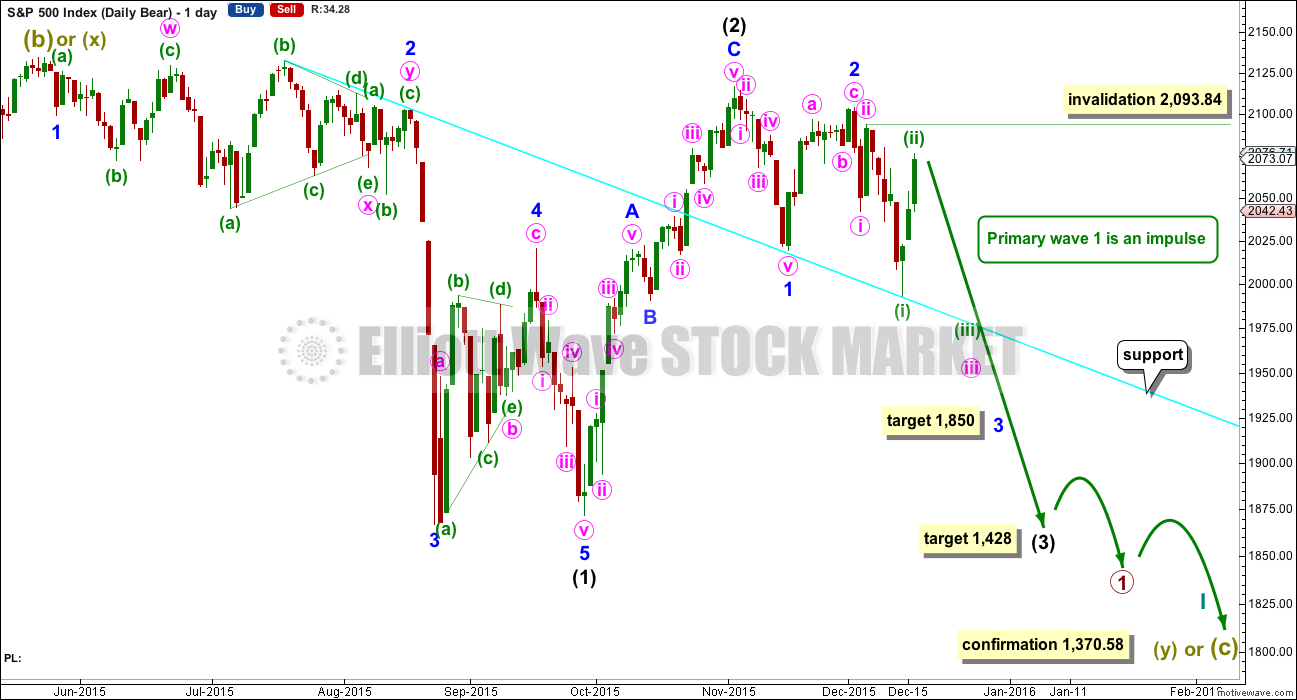
Primary wave C should subdivide as a five and primary wave Y should begin with a zigzag downwards. This downwards movement is either intermediate waves (1)-(2)-(3) of an impulse for primary wave C or minor waves A-B-C of a zigzag for intermediate wave (A). Both these ideas need to see a five down complete towards the target, so at this stage there is no divergence in expectations regarding targets or direction.
Primary wave A or W lasted three months. Primary wave C or Y may be expected to also last about three months.
Within the new downwards wave of primary wave C or Y, a first and second wave, or A and B wave, is now complete. Intermediate wave (2) or minor wave B lasted a Fibonacci 13 days exactly. At 1,850 intermediate wave (3) or minor wave C would reach 2.618 the length of intermediate wave (1). At this stage, this will be the sole target for this third (or C) wave to end as it fits better with more short term targets calculated at the hourly chart level.
No second wave correction may move beyond the start of its first wave above 2,093.84 within minor wave 3.
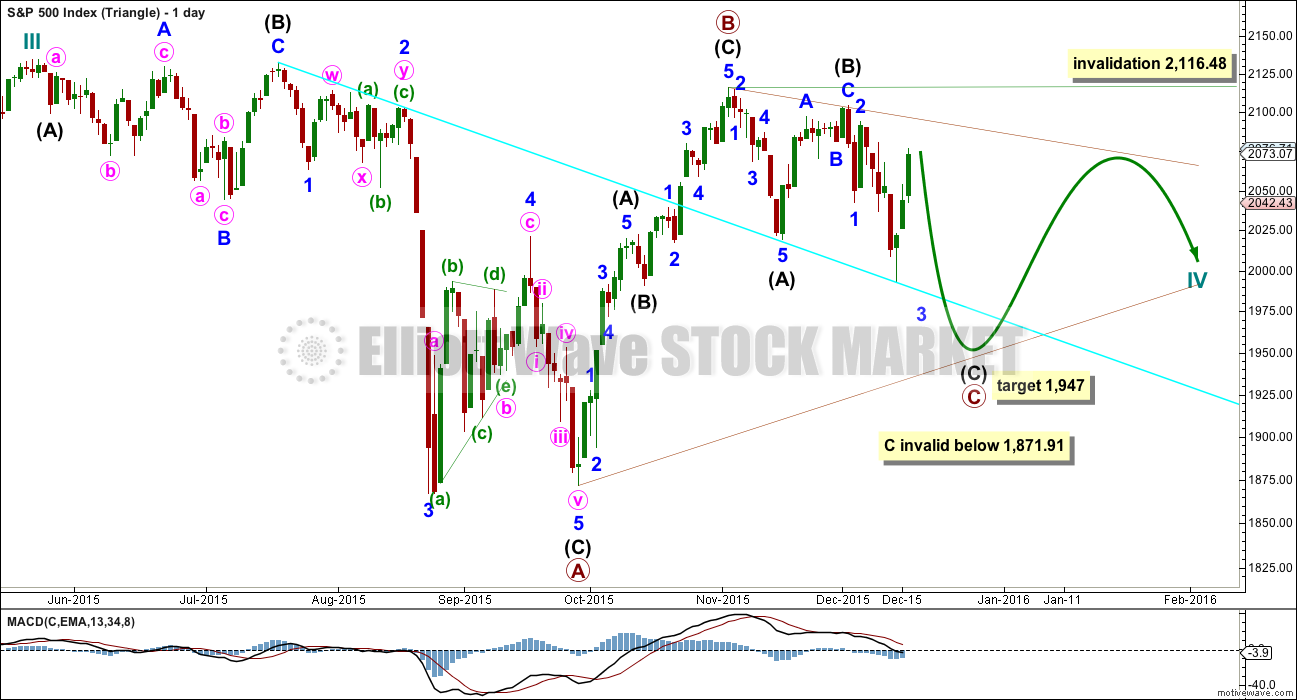
DAILY CHART – TRIANGLE
Click chart to enlarge.
Cycle wave IV may unfold as a shallow triangle. This would provide alternation with the 0.41 zigzag of cycle wave II.
Primary wave B may be a complete zigzag. Primary wave C downwards may be underway and within it intermediate waves (A) and (B) are complete.
The whole structure moves sideways in an ever decreasing range. The purpose of triangles is to take up time and move price sideways. A possible time expectation for this idea may be a total Fibonacci eight or thirteen months, with thirteen more likely. So far cycle wave IV has lasted six months.
The target for primary wave C to end is 1,947 where intermediate wave (C) would reach 1.618 the length of intermediate wave (A).
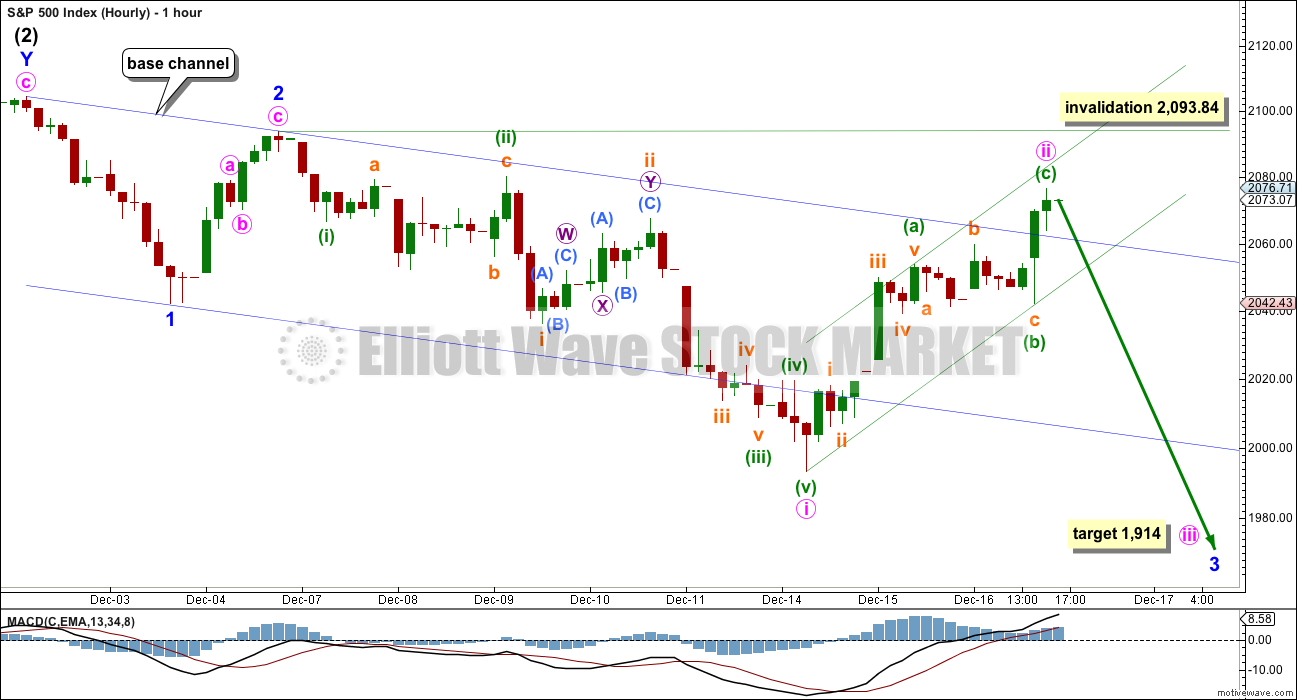
HOURLY CHART
Click chart to enlarge.
Hourly charts again are the same. Upwards movement for both is expected to be a second wave correction, which looks complete at the hourly and five minute chart level.
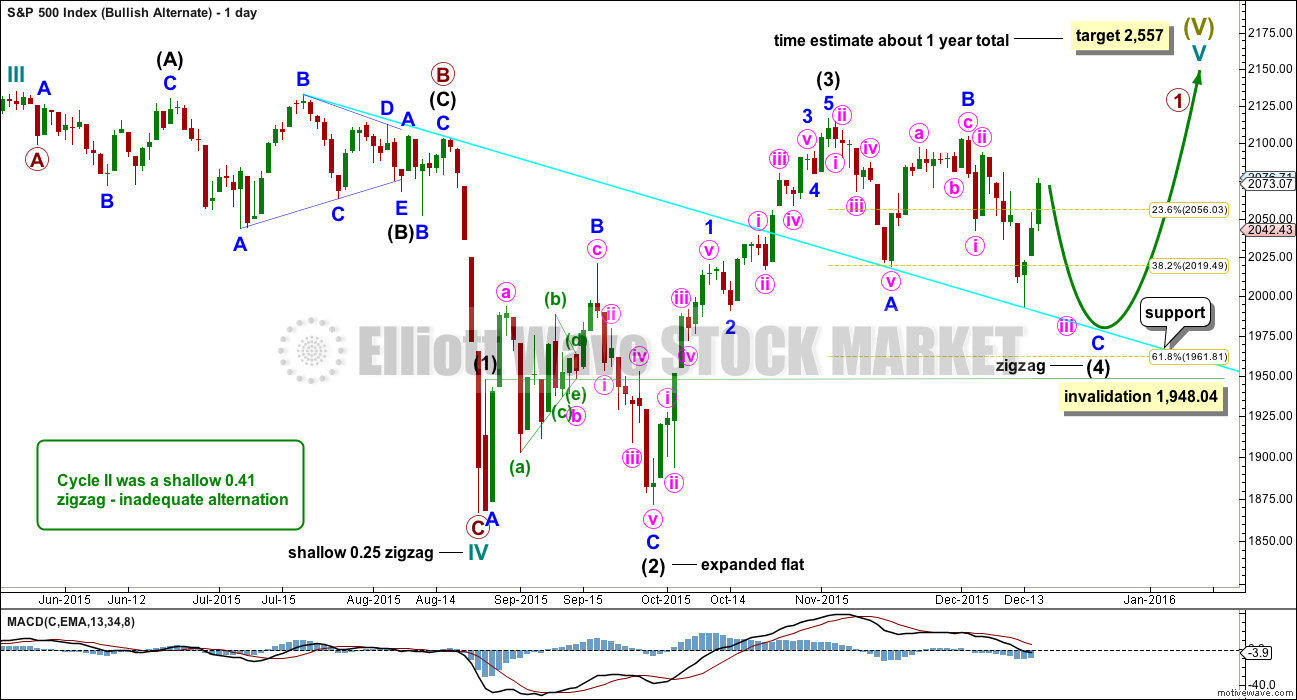
BULLISH ALTERNATE WAVE COUNT
Click chart to enlarge.
I can again see the possibility that cycle wave IV is over and upwards movement may be the start of cycle wave V.
If cycle wave IV is over, as labelled, then there is inadequate alternation between cycle waves II and IV. Cycle wave II was a shallow 0.41 zigzag. Here, cycle wave IV is a more shallow 0.25 zigzag. Both are the same structure.
If cycle wave V has begun, then primary wave 1 within it may be an incomplete impulse. At 2,557 cycle wave V would reach equality in length with cycle wave I. If it also is the same in duration as cycle wave I, then it may last a year.
Intermediate wave (2) was a deep 0.94 expanded flat within primary wave 1. Intermediate wave (4) would be an incomplete zigzag which would also be relatively deep when it is complete. Minor wave C must complete as a five wave impulse downwards. Intermediate wave (4) may not move into intermediate wave (1) price territory below 1,948.04.
This wave count does not have any support from regular technical analysis. I do not have any confidence in it. It is presented as a “what if?” only, to consider all possibilities.
BEAR ELLIOTT WAVE COUNT
DAILY CHART
Click chart to enlarge.
This bear wave count has a better fit at Grand Super Cycle degree and is better supported by regular technical analysis at the monthly chart level. But it is a huge call to make, so I present it second, after a more bullish wave count, and until all other options have been eliminated.
There are two ideas presented in this chart: a huge flat correction or a double flat / double combination. The huge flat is more likely. They more commonly have deep B waves than combinations have deep X waves (in my experience).
A huge flat correction would be labelled super cycle (a)-(b)-(c). It now expects a huge super cycle wave (c) to move substantially below the end of (a) at 666.79. C waves can behave like third waves. This idea expects a devastating bear market, and a huge crash to be much bigger than the last two bear markets on the monthly bear chart.
The second idea is a combination which would be labelled super cycle (w)-(x)-(y). The second structure for super cycle wave (y) would be a huge sideways repeat of super cycle wave (a) for a double flat, or a quicker zigzag for a double combination. It is also possible (least likely) that price could drift sideways in big movements for over 10 years for a huge triangle for super cycle wave (y).
The downwards movement labelled intermediate wave (1) looks like a five. If minor wave 2 is seen as a double zigzag with a triangle for wave X within it, then the subdivisions all fit nicely.
Ratios within intermediate wave (1) are: minor wave 3 is 7.13 points short of 6.854 the length of minor wave 1, and minor wave 5 is just 2.81 points longer than 0.618 the length of minor wave 3. These excellent Fibonacci ratios add some support to this wave count.
Intermediate wave (2) was a very deep 0.93 zigzag (it will also subdivide as a double zigzag). Because intermediate wave (2) was so deep the best Fibonacci ratio to apply for the target of intermediate wave (3) is 2.618 which gives a target at 1,428. If intermediate wave (3) ends below this target, then the degree of labelling within this downwards movement may be moved up one degree; this may be primary wave 3 now unfolding and in its early stages.
Within intermediate wave (3), minor waves 1 and 2 are complete. The upwards movement for minor wave 2 does have a strong three wave look to it at the daily chart level. Minor wave 2 was another deep correction at 0.87 of minor wave 1. At 1,850 minor wave 3 would reach 2.618 the length of minor wave 1. If price falls through this first target, then the next Fibonacci ratio in the sequence is 4.236 which would be reached at 1,693. If minor wave 3 is very extended, then the degree of labelling for all downwards movement from the all time high will be moved up one degree.
It is still possible (but still less likely) that primary wave 1 is unfolding as a leading diagonal. I will keep that chart up to date and will publish it if and when it begins to diverge from the idea presented here. For now I want to keep the number of charts published more manageable.
The upwards sloping cyan trend line from yesterday’s daily chart did not show where price found resistance, so it is removed. A new line from the ends of intermediate wave (2) to minor wave 2 is drawn. This line may show where any further upwards movement finds resistance.
The invalidation point on the daily chart will now be the same as the hourly. Minuette wave (ii) may not move beyond the start of minuette wave (i) above 2,093.84.
HOURLY CHART
Click chart to enlarge.
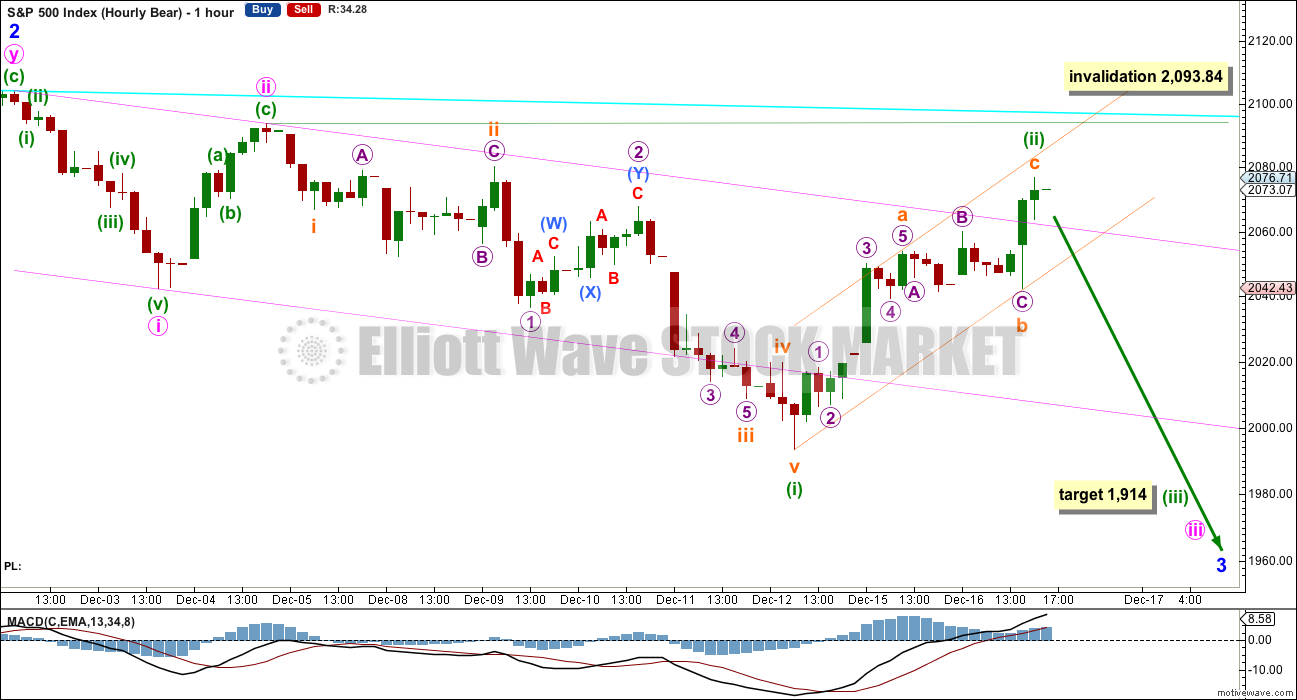
The base channel about minor waves 1 and 2 is breached by a full hourly candlestick. Base channels often work, but not always.
Yesterday’s labelling of downwards movement as a series of four overlapping first and second waves was invalidated. It may be that it is only two overlapping first and second waves. There is a series of small overlapping corrections at the end of minuette wave (i) which may have been fourth wave counterparts to prior second wave corrections. The duration of the fourth waves is shorter than the second waves which give the impulse an atypical look, but sometimes the S&P does this. This is what makes it particularly difficult to analyse correctly because the proportions are not always very good.
The subdivisions all fit on the five minute chart level.
If minuette wave (ii) extends higher, then it should find resistance at the new cyan trend line copied over from the daily chart.
Draw a channel about minuette wave (ii) using Elliott’s technique for a correction: draw the first trend line from the start of subminuette wave a to the end of subminuette wave b, then place a parallel copy on the end of subminuette wave a. When this small orange channel is clearly breached by downwards movement that should indicate the end of this correction and the resumption of a downwards trend.
At 1,914 minuette wave (iii) would reach 1.618 the length of minuette wave (i). If this target is passed, the next Fibonacci ratio is 2.618 which would be reached at 1,813.
Minuette wave (ii) may not move beyond the start of minuette wave (i) above 2,093.84.
TECHNICAL ANALYSIS
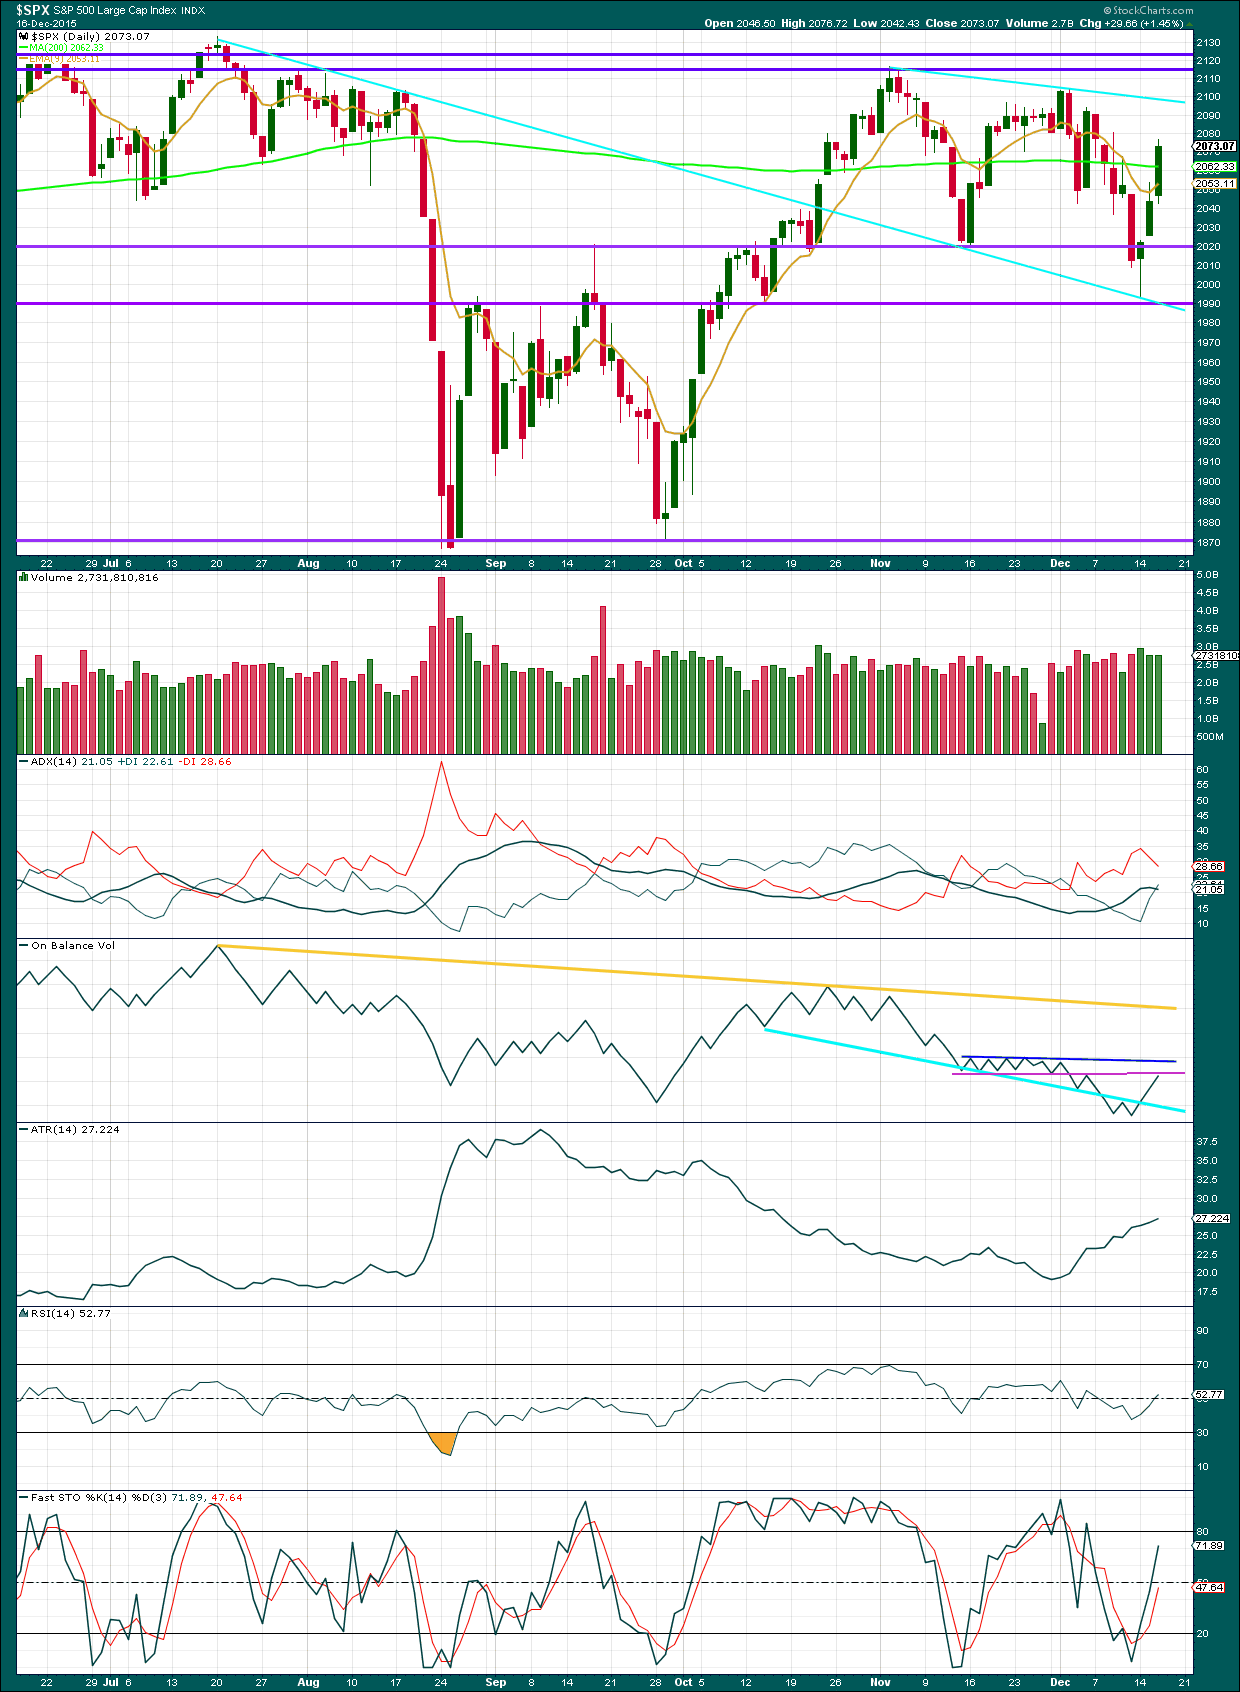
Click chart to enlarge. Chart courtesy of StockCharts.com.
Three days in a row of upwards movement on declining volume supports the wave count. However, today volume is only slightly lower than the prior upwards day. While it cannot be said that this upwards movement in price was supported by volume neither can it be said that volume is clearly declining because it is not.
It is very clearly a downwards day which has strongest volume during all movement since the August low. This offers some small support to the bearish Elliott wave count.
Neither the 200 day moving average nor the 9 day EMA provided resistance. On Balance Volume has though. It has come up to touch its pink trend line again. This trend line is almost horizontal and repeatedly tested, although it is not very long held. It should offer reasonable resistance, which may help to indicate that upwards movement should end here.
Today ADX is flattening off indicating the market is consolidating and not trending. ATR disagrees as it continues to increase. ADX may be indicating an interruption to a downwards trend. With the -DX line still above the +DX line, if ADX again turns upwards, a downwards trend would again be indicated.
RSI is neutral. If there is a downwards trend in place, then there is plenty of room for this market to fall.
Stochastics has returned from oversold.
DOW THEORY
For the bear wave count I am waiting for Dow Theory to confirm a market crash. I am choosing to use the S&P500, Dow Industrials, Dow Transportation, Nasdaq and I’ll add the Russell 2000 index. Major swing lows are noted below. So far the Industrials, Transportation and Russell 2000 have made new major swing lows. None of these indices have made new highs.
At this stage, if the S&P500 and Nasdaq also make new major swing lows, then Dow Theory would confirm a major new bear market. At that stage, my only wave count would be the bear wave count.
S&P500: 1,821.61
Nasdaq: 4,117.84
DJT: 7,700.49 – this price point was breached.
DJIA: 15,855.12 – this price point was breached.
Russell 2000: 1,343.51 – this price point was breached.
This analysis is published about 06:41 p.m. EST.
Hi
Lara
Would these price points look like a good count on your side ?
A. We pull back here 5-10 points. Oh say 2060.
B. We break over 2093.
C. We head to around 2133.
D. It terminates.
No. It makes no sense in Elliott wave terms.
I have a new alternate that I’ll publish as an update which allows for some more upwards movement above 2,093.84. But the pathway is not what you’re outlining here.
K so then back to 2116 – 2120 possibly ? Just like the original view ?
Anyway there could be a deviation to Elliot rules ?
What if markets price action don’t make sense in euphoria state and do go past 2133 and do terminate after that like in year 2000 with a spike at the highs ?
The alternate bear wave count published as an update allows for lots of choppy overlapping movement.
But we have another bearish engulfing candlestick pattern today.
That’s three in a row at each of the last three swing highs.
The main wave count remains bearish.