
Downwards movement is showing increased momentum as expected.
I have a new bullish Elliott wave count.
Summary: A third wave down is underway and the structure remains incomplete. I expect a further increase in downwards momentum. The target remains at 1,850.
To see how each of the bull and bear wave counts fit within a larger time frame see the Grand Supercycle Analysis.
To see last analysis of weekly and monthly charts click here.
If I was asked to pick a winner (which I am reluctant to do) I would say the bear wave count has a higher probability. It is better supported by regular technical analysis at the monthly chart level, it fits the Grand Supercycle analysis better, and it has overall the “right look”.
New updates to this analysis are in bold.
BULL ELLIOTT WAVE COUNT
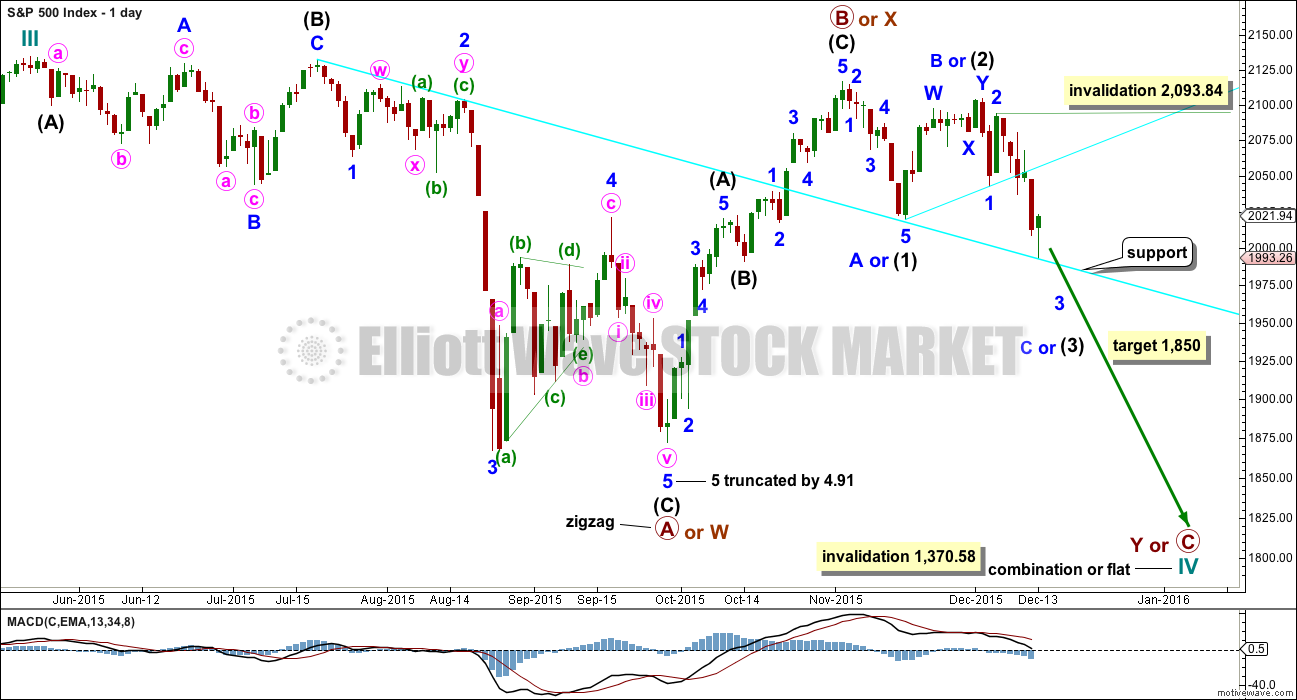
DAILY CHART – COMBINATION OR FLAT
Click chart to enlarge.
Cycle wave IV should exhibit alternation to cycle wave II.
Cycle wave II was a shallow 0.41 zigzag lasting three months. Cycle wave IV should exhibit alternation in structure and maybe also alternation in depth. Cycle wave IV may end when price comes to touch the lower edge of the teal channel which is drawn about super cycle wave V using Elliott’s technique (see this channel on weekly and monthly charts).
Cycle wave IV may end within the price range of the fourth wave of one lesser degree. Because of the good Fibonacci ratio for primary wave 3 and the perfect subdivisions within it, I am confident that primary wave 4 has its range from 1,730 to 1,647.
If a zigzag is complete at the last major low as labelled, then cycle wave IV may be unfolding as a flat, combination or triangle.
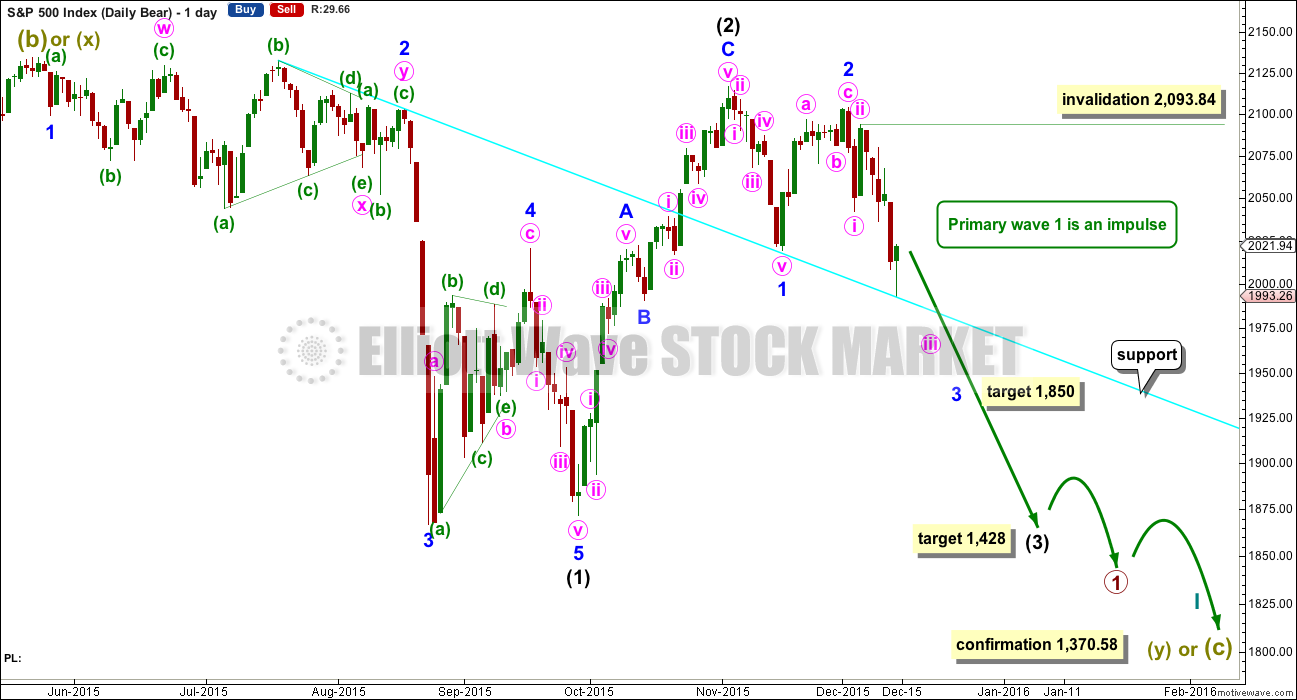
The wave count is changed today to again see primary wave B or X as a zigzag completed earlier. Primary wave C should subdivide as a five and primary wave Y should begin with a zigzag downwards. This downwards movement is either intermediate waves (1)-(2)-(3) of an impulse for primary wave C or minor waves A-B-C of a zigzag for intermediate wave (A). Both these ideas need to see a five down complete towards the target, so at this stage there is no divergence in expectations regarding targets or direction.
Primary wave A or W lasted three months. Primary wave Y or C may be expected to also last about three months.
Within the new downwards wave of primary wave C or Y, a first and second wave, or A and B wave, is now complete. Intermediate wave (2) or minor wave B lasted a Fibonacci 13 days exactly. At 1,850 intermediate wave (3) or minor wave C would reach 2.618 the length of intermediate wave (1). At this stage, this will be the sole target for this third (or C) wave to end as it fits better with more short term targets calculated at the hourly chart level.
No second wave correction may move beyond the start of its first wave above 2,093.84 within minor wave 3.
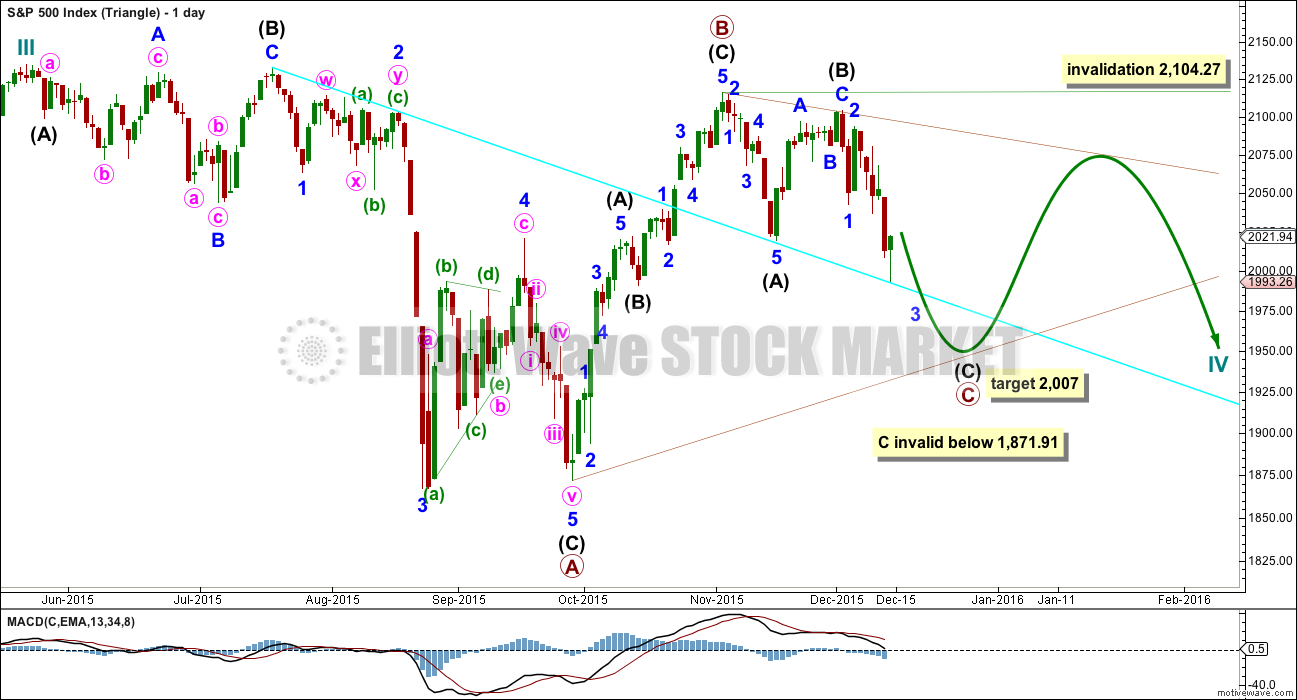
DAILY CHART – TRIANGLE
Click chart to enlarge.
Cycle wave IV may unfold as a shallow triangle. This would provide alternation with the 0.41 zigzag of cycle wave II.
Primary wave B may be a complete zigzag. Primary wave C downwards may be underway and within it intermediate waves (A) and (B) are complete.
The whole structure moves sideways in an ever decreasing range. The purpose of triangles is to take up time and move price sideways. A possible time expectation for this idea may be a total Fibonacci eight or thirteen months, with thirteen more likely. So far cycle wave IV has lasted six months.
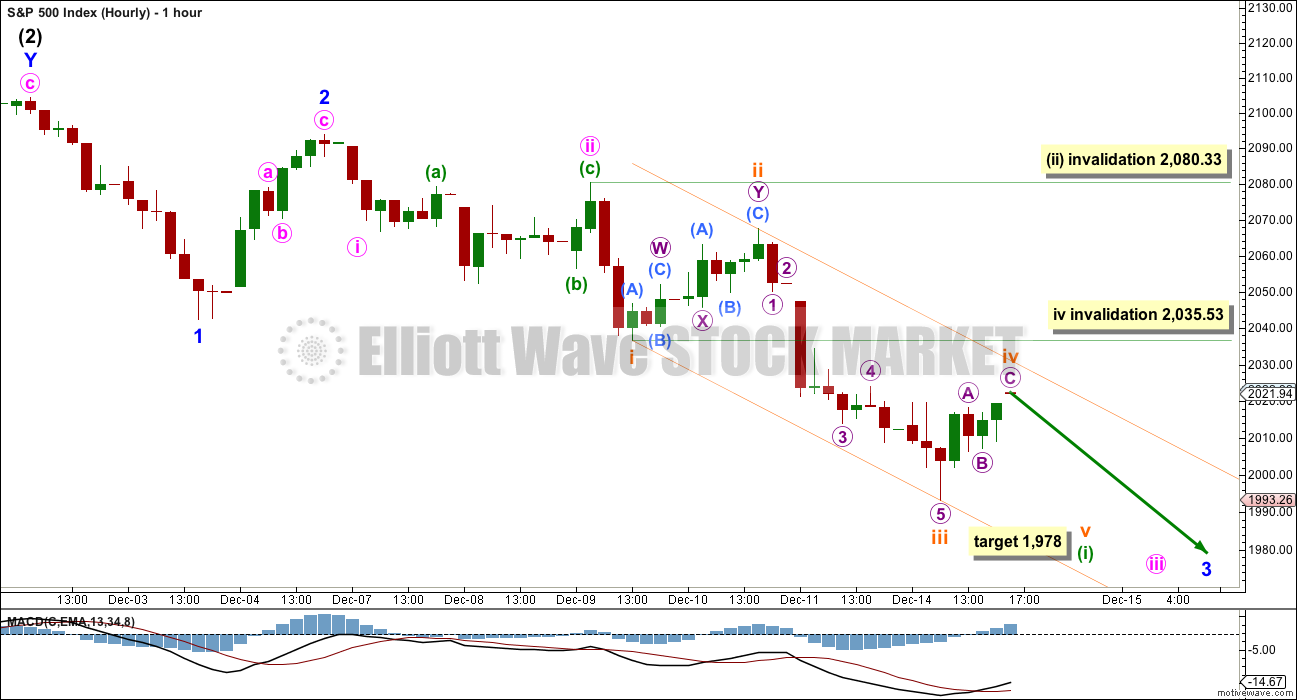
HOURLY CHART
Click chart to enlarge.
The hourly wave counts will again be different today. I will use them to show two different ways to label this unfolding impulse.
So far the structure cannot be seen as complete. It needs to keep moving lower, so that intermediate wave (3) is far enough below the end of intermediate wave (1) to allow room for upwards movement for the following correction of intermediate wave (4) to unfold and remain below intermediate wave (1) price territory.
Minor waves 1 and 2 are complete so far within intermediate wave (3). Minor wave 3 is incomplete.
Minute waves i and ii are complete within minor wave 3.
Within minute wave iii, only minuette wave (i) may be close to completion. When it is done the following correction for minuette wave (ii) may not move beyond the start of minuette wave (i) above 2,080.33.
Minuette wave (i) is unfolding as an impulse. Subminuette waves i through to iv may be complete within minuette wave (i). Subminuette wave iii was 3.52 points longer than 1.618 the length of subminuette wave i.
There is some alternation between subminuette waves ii and iv, but it is not perfect. Subminuette wave ii was a deep 0.71 double zigzag. Subminuette wave iv is a shallow 0.39 single zigzag so far.
The orange channel is drawn about the impulse of minuette wave (i) using Elliott’s technique. The first trend line is drawn from the ends of subminuette waves i to iii, then a parallel copy is placed on the end of subminuette wave ii. So far subminuette wave iv is contained within this channel. If it moves higher when markets open tomorrow, then it may find resistance at the upper edge of this channel.
At 1,978 subminuette wave v would reach equality in length with subminuette wave i.
Subminuette wave iv may not move into subminuette wave i price territory above 2,035.53.
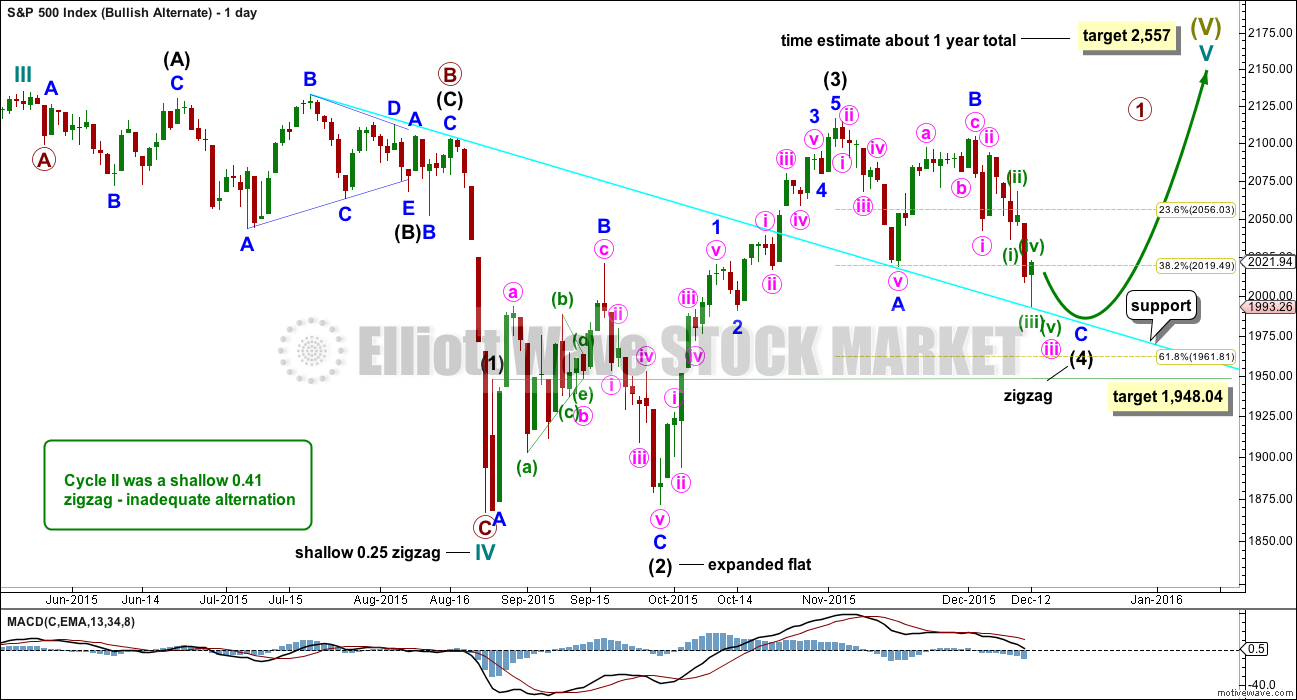
BULLISH ALTERNATE WAVE COUNT
Click chart to enlarge.
I can again see the possibility that cycle wave IV is over and upwards movement may be the start of cycle wave V.
If cycle wave IV is over, as labelled, then there is inadequate alternation between cycle waves II and IV. Cycle wave II was a shallow 0.41 zigzag. Here, cycle wave IV is a more shallow 0.25 zigzag. Both are the same structure.
If cycle wave V begins there, then primary wave 1 within it may be an incomplete impulse. At 2,557 cycle wave V would reach equality in length with cycle wave I. If it also is the same in duration as cycle wave I, then it may last a year.
Intermediate wave (2) was a deep 0.94 expanded flat within primary wave 1. Intermediate wave (4) would be an incomplete zigzag which would also be relatively deep when it is complete. Minor wave C must complete as a five wave impulse downwards. Intermediate wave (4) may not move into intermediate wave (1) price territory below 1,948.04.
This wave count does not have any support from regular technical analysis. I do not have any confidence in it. It is presented as a “what if?” only, to consider all possibilities.
BEAR ELLIOTT WAVE COUNT
DAILY CHART
Click chart to enlarge.
This bear wave count has a better fit at Grand Super Cycle degree and is better supported by regular technical analysis at the monthly chart level. But it is a huge call to make, so I present it second, after a more bullish wave count, and until all other options have been eliminated.
There are two ideas presented in this chart: a huge flat correction or a double flat / double combination. The huge flat is more likely. They more commonly have deep B waves than combinations have deep X waves (in my experience).
A huge flat correction would be labelled super cycle (a)-(b)-(c). It now expects a huge super cycle wave (c) to move substantially below the end of (a) at 666.79. C waves can behave like third waves. This idea expects a devastating bear market, and a huge crash to be much bigger than the last two bear markets on the monthly bear chart.
The second idea is a combination which would be labelled super cycle (w)-(x)-(y). The second structure for super cycle wave (y) would be a huge sideways repeat of super cycle wave (a) for a double flat, or a quicker zigzag for a double combination. It is also possible (least likely) that price could drift sideways in big movements for over 10 years for a huge triangle for super cycle wave (y).
The downwards movement labelled intermediate wave (1) looks like a five. If minor wave 2 is seen as a double zigzag with a triangle for wave X within it, then the subdivisions all fit nicely.
Ratios within intermediate wave (1) are: minor wave 3 is 7.13 points short of 6.854 the length of minor wave 1, and minor wave 5 is just 2.81 points longer than 0.618 the length of minor wave 3. These excellent Fibonacci ratios add some support to this wave count.
Intermediate wave (2) was a very deep 0.93 zigzag (it will also subdivide as a double zigzag). Because intermediate wave (2) was so deep the best Fibonacci ratio to apply for the target of intermediate wave (3) is 2.618 which gives a target at 1,428. If intermediate wave (3) ends below this target, then the degree of labelling within this downwards movement may be moved up one degree; this may be primary wave 3 now unfolding and in its early stages.
Within intermediate wave (3), minor waves 1 and 2 are complete. The upwards movement for minor wave 2 does have a strong three wave look to it at the daily chart level. Minor wave 2 was another deep correction at 0.87 of minor wave 1. At 1,850 minor wave 3 would reach 2.618 the length of minor wave 1.
It is still possible (but still less likely) that primary wave 1 is unfolding as a leading diagonal. I will keep that chart up to date and will publish it if and when it begins to diverge from the idea presented here. For now I want to keep the number of charts published more manageable.
The cyan trend line has provided support and initiated a bounce as expected. When price breaks below that line, then I would expect downwards momentum to increase.
HOURLY CHART
Click chart to enlarge.
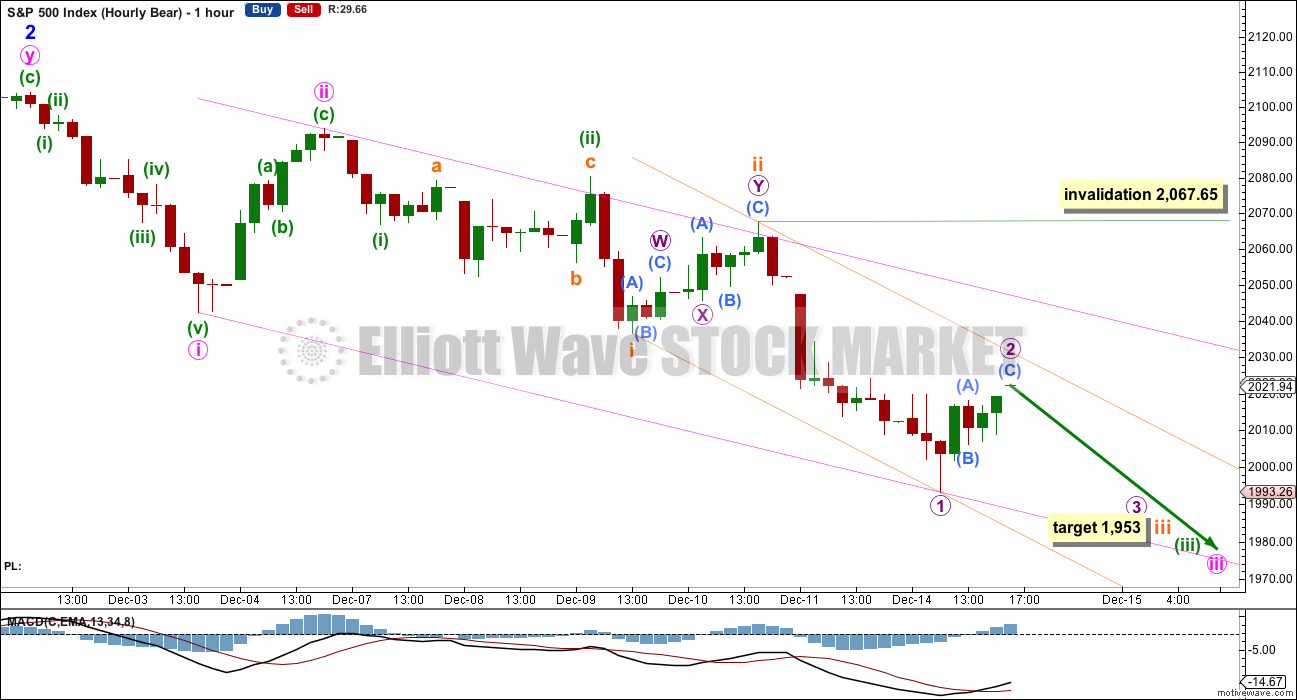
This is a different way to label this impulse unfolding downwards.
There may so far be a series of overlapping first and second waves.
Both ideas at the hourly chart level are equally valid. Both expect further downwards movement. The mid term target at 1,850 is also the same.
If upwards movement for Monday was a second wave and not a fourth wave, then it may not move above the start of the first wave at 2,067.65.
At 1,953 subminuette wave iii would reach 2.618 the length of subminuett wave i. If this target is wrong, it may not be low enough for this bear wave count. The next Fibonacci ratio in the sequence is 4.236 which gives a target at 1,882.
The orange channel is an acceleration channel about subminuette waves i and ii. The pink channel is the same about minute waves i and ii. Keep redrawing these channels as price keeps moving lower. Acceleration channels are drawn from the end of the first wave to the last low, then a parallel copy is placed on the end of the second wave.
Along the way down, upwards corrections may find resistance at the upper edge of each acceleration channel.
TECHNICAL ANALYSIS
Click chart to enlarge. Chart courtesy of StockCharts.com.
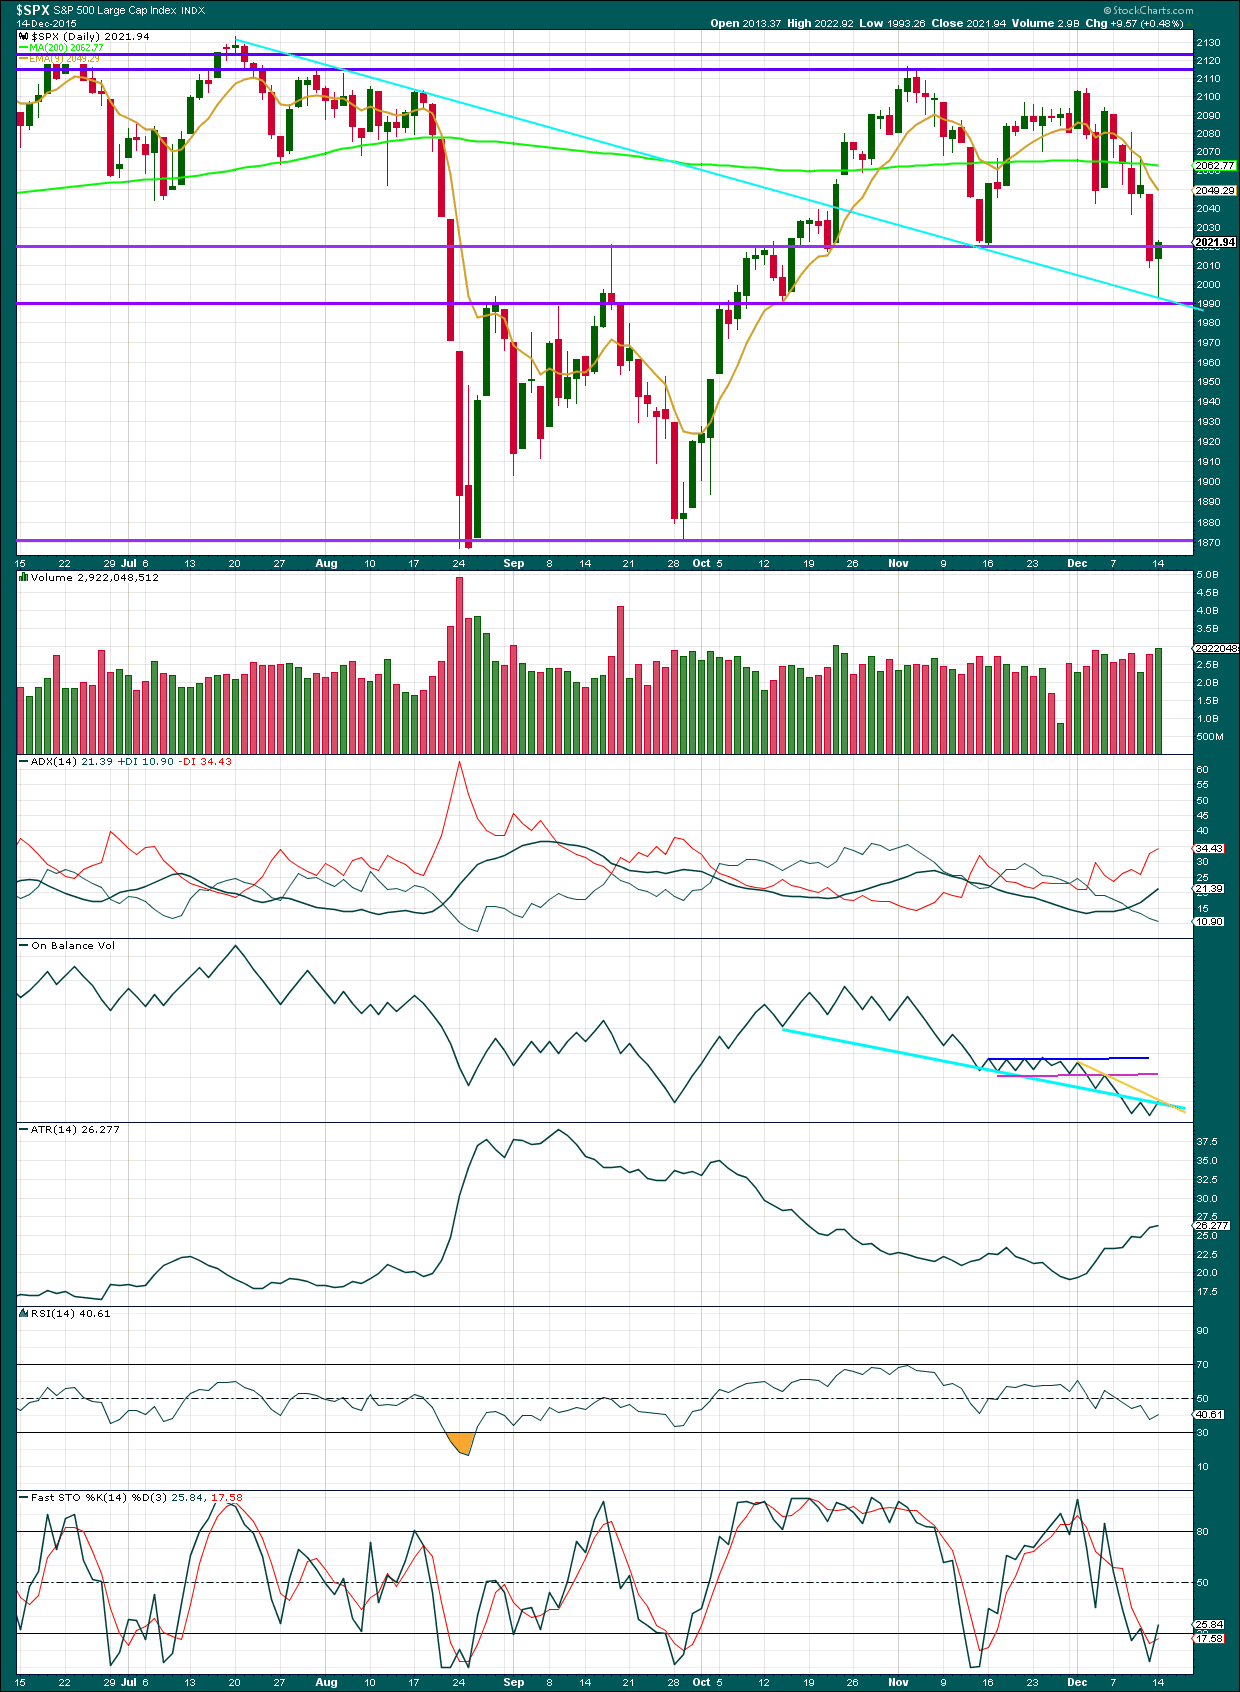
An upwards day with some increase in volume is the most bullish signal from the S&P for some time. However, on its own it is not enough to change the outlook from bearish to bullish. Price found support at the next horizontal trend line about 1,990 today, and at the cyan trend line (copied from the Elliott wave daily charts). It would be reasonable to expect price to find resistance about the horizontal trend line at 2,020.
Price is closing again below the 200 day moving average. ADX indicates a strengthening downwards trend and ATR agrees. It would be wise and safest to accept that there is a downwards trend in place at this time.
On Balance Volume may now find resistance at both the gold and cyan trend lines. This may stop price from moving much higher, if any.
RSI is still not oversold. There is further room for this market to fall.
DOW THEORY
For the bear wave count I am waiting for Dow Theory to confirm a market crash. I am choosing to use the S&P500, Dow Industrials, Dow Transportations, Nasdaq and I’ll add the Russell 2000 index. Major swing lows are noted below. So far the Industrials, Transportations and Russell 2000 have made new major swing lows. None of these indices have made new highs.
At this stage if the S&P500 and Nasdaq also make new major swing lows then Dow Theory would confirm a major new bear market. At that stage my only wave count would be the bear wave count.
S&P500: 1,821.61
Nasdaq: 4,117.84
DJT: 7,700.49 – this price point was breached.
DJIA: 15,855.12 – this price point was breached.
Russell 2000: 1,343.51 – this price point was breached.
This analysis is published about 09:54 p.m. EST.
Nice run. Low volume of 500 million compared to 700 million yesterday. I am am confident that every upside stop-loss for short positions has been taken out today. Taking profits on half of upside hedges.
And it begins….
ES down -1
🙂
hi
All
I am still confident this is a bear market rally and haven’t changed my mind!
3rd of 3rd of 3rd down…if it is…is gonna be…hmm…spectacular!
Tomorrow will be interesting….
Final feed on volume today only slightly lower at almost 700 million.
Volume will be very telling again today. Yesterday’s slight increase in volume may have been the indicator which pointed to a rally today.
If this upwards day comes with a decrease in volume then I would have confidence in the wave count expecting a big fall tomorrow.
But if there is any increase in volume for today I will be very concerned.
The data I’m getting from BarChart apparently comes directly from the exchange. But it does not have any volume data. And so I’m still going to be using StockCharts data for volume analysis. And that is not finalised until about 6:30pm EST.
Volume so far today lower. Yesterday almost 800 million, today less than 500 million
That’s reassuring. Not as low as I’d like, but at least there was not much support for upwards movement.
I’ll be expecting a big drop tomorrow then.
I think so. I will be looking at futures tonight. My guess is it could be flat or just a few points up until tomorrows definitive rate decision.
Thanks a bunch!
Well this is a deep rally isn’t it.
The scenario presented for the hourly bear is the one which I shall use today. This second wave looks so far like a possible double zigzag… another one.
Price is very close to that upwards sloping cyan trend line on the main daily chart (I removed it from the daily bear, but I’ll put it back today), it may find resistance there. If so that allows for a wee bit more upwards movement, and that would give the count of this wave up a corrective count, it would fit as a single zigzag.
Even though this is a deep rally we still have lower lows and lower highs (swing highs I mean, not highs for each day). The trend is still down.
This is what bear markets do. They’re volatile and can have deep rallies. That is the risk with this market if my wave count is correct, its a wild ride, high volatility during the S&P’s bear markets means high risk.
2053.77 gap from Dec 10 filled; by 0.10 points!!! That’s all she wrote…
ES is near highs of the day but VIX futures (XIV) are not
Not a crude trader, nor do I want to be, but since the stock market is intent on thematically trading it…here I go: Crude could be in a 4th wave correction, and if so, this looks like a nice ascending/contracting triangle, with an overthrow. Maybe.
We also tagged a 38.2% retrace, plus ran stiff into resistance at 37.50 area.
Or some type of double zig zag. I don’t know.
It sorta looks like an ending diagonal…if it is, the next move down is gonna be fast
On the sidlines for a while
When crude oil goes negative today…
LOL! How will Europe close?
FTSE is interesting b/c it broke previous resistance yesterday and is having a 1 day wonder rally.
If that rally doesn’t hold for more than a day, then its white space below.
And, *if* the US closes weak today, then that might set things up for another big leg down in the FTSE.
FTSE chart.
Are you in the UK?
States. Been trading futures for 11 years. Use some Elliott and technical analysis for my trading. Mostly swing trading for 1-12 week time-frames.
15 Min SPX found support
Bid on 26.5 calls back above 8.00. I will keep hedge in place and add my final contingent of calls. Best of luck to everyone and here’s hoping Lara has an awesome Xmas holiday and a wonderful time of well-deserved rest and recuperation…SURF’S UP!! 🙂
LOL thank you.
I plan on surfing every day if there are waves. Until my arms turn into noodles and I turn into a fish….
Found resistance
Bid on 26.5 calls up to 7.75
Unless it gets more complicated, wave two up looking like an upward flat…
According to Spring Heeled Jack, today is a “cycle trend day” Wish I understood how they work
TVIX filling it’s gap from Friday, I hope
Bid on my 26.5 UVXY call got down to 7.00 this morning; now creeping back up to 7.25…I will consider a bid of 8.00 or higher to be a reversal signal…they are really juicing the DAX…up over 3%!!
Premium on puts still ridiculous…even for this week’s expirations. Absolutely no one is biting on my “stink” bids. Here’s hoping it pops just a bit higher so we can get some decent entry points….
To make it official, Lara’s 1st hourly count has been invalidated, so we are working with the assumption the 2nd hourly count is in play.
Now we have another embedded wave 2 within a sextuplet 3rd.
The simple answer to all of this couldn’t be clearer. Either the wave count is wrong, OR this is the point of no return to the downside.
Good luck everyone.
For all the previously stated reasons, I am betting on a second wave correction…we should know at the end of the day for certain…if the bulls mean business, they HAVE to retake the 200 DMA…
It’s kind of amusing how these manic rallies are trotted out to stampede market participants during bear markets- they all end the same way. Hard to know how much is manipulation, short covering, or persistent bullish enthusiasm; probably a little bit of all three…”stealing” more puts a few weeks out… 🙂
ES 60 as of 2:51 Euro time Watching the RSI…….
Another alternative…2039 would be the top for March ES.
Confluence of fib retracements too.
Corey: Re Confluence of fibs, How did you set that up?
I simply add the fib retracements from the bottom (yesterday’s low) and use the top of each rally as the start points. There are 4 peaks from Dec. 2.
So right now we are at a confluence of two 50% areas, a 61.8% area and a 76.4 area. Those areas correspond to the top of the channel, and where we broke down on Dec 11.
On the March ES futures, the 61.8% retrace of the recent wave down is right at 2030.
There’s also a upper channel line there too.
Definitely a place to watch for a reversal…and it *should* reverse if this is truly a middle wave 3.
Good luck.
Also notice that 2030 is now resistance from the lows after that huge reversal day last Wednesday.
Nice , I didn’t see the channel, ST indicators are getting over cooked too
March ES? What have I got? tia
Your chart above is March ES, which is the active contract right now.
200 DMA just at about invalidation level for wave two up at 2067.65 . I think it will be challenged before a reversal.
Europe still juiced.
True – 2062 area on 200 DMA, and 2058 area on 50 DMA.
Both below invalidation point.
OIL
ZeroHedge “Russia Sees No Oil Price Recovery In The Coming 7 Years”
Look for VIX and UVXY to start diverging from price action for a clue to end of counter-trend rally…
Europe still up substantially…US futures fading…
Keeping a sharp eye on the bearish 26.5/27 credit spread I sold against my bullish UVXY positions. It is cheap insurance at only 50 dollars of risk per contract. The 27 call bought is showing a profit of 498 and the 26.5 call sold is showing a loss of 628. for a current loss of 130 per contract (ask price) if closed today. UVXY should decline a bit more at the opening (current bid at 33.0) Monitoring the 26.5 call price will tell me when UVXY has bottomed and may be bought to close, allowing me to maintain the 27 strike calls for more upside. At that point a new hedge position at higher strikes can be initiated. FOR EDUCATIONAL PURPOSES ONLY! 😀
The banksters are clearly hard at work. They are buying futures in a co-ordinated fashion to intimidate short positions. The key level is 2067.65 so let your hedges do their work. I will cash in my hedges at the open and reload immediately at higher strikes to maintain protection against further upward movement. This action is bogus, and should be shorted IMHO.
T2108 hit it’s typical bounce /if not reversal level yesterday and filled a gap
So maybe SPX tests Lara’s 2,067.65 invalidation area as a neutral nesting point before the Fed decision
have a great holiday Lara!
Thank you Nick. I plan on surfing until my arms turn into noodles 🙂
Verne
I got to tell you, my only concern is volatility being sucked out of the market before the FED on WED, but that was just a historical fact before meetings. Not sure if it is applicable here but todays close had me second guessing myself 50/50 especially with the closing print of 2021…
Anything is possible; that is why we hedge. I think we are looking at a classic buy the rumour sell the news scenario. Let’s see where we close today…
Remember we saw, and you pointed out, a 17% collapse in the VIX just ahead of the last pop higher…
Well I think my analysis for the Vix gap fill was warranted.
I will do some more work tonight on the potential paths again
I’m taking the day off now
Nothing to see here
Me too…will probably be a wait and see day…enjoy!
The bearish wave count showing today’s end of day upward move as micro 2 of sub-min three comports absolutely perfectly with what UVXY did today. It almost always takes a dive during second wave corrections, and just ahead of a third wave down. So UVXY was telling us that what I thought was a fourth wave was actually a second. It in fact made a new 52 week low at the intermediate two high on Dec and will in all likelihood do so again at the primary two high for the bearish wave count. Masterful analysis as usual Lara. It really helps in putting the pieces of the SPX puzzle together. Europe futures down considerably. US markets should play catch-up tomorrow. A lot of soon-to-be-surprised folk are interpreting the hammer today as an interim bottom. I think Lara has it right on the money.
For my expectation today I had originally thought that it would be limited upside 2020-2030 to only intraday but somehow those ALGOs busted it back into the close 15 minutes – just wild. No worries – i pulled some old chart. Those hammers are not really an indicator of an up turn as well as you mentioned.
Check out 2000.
CVX and Exxon alone accounted for 50 points of the DOW’s rise yesterday as quite a few folk are convinced that oil has bottomed. There is something really fishy about the sky-rocketing futures AHEAD of any official FED pronouncement. I know there are still quite a few bullish participants but these futures levels are ridiculous. The banksters are getting just a little bit laughable…
Thanks!
Really tricky today in the markets….