
Downwards movement is showing increased momentum as expected.
The bullish Elliott wave count is invalidated.
Summary: A third wave down is still in the early stages. The first short term target for the middle of it to end is at 1,997. The second short term target is at 1,953. The mid term target is at 1,850.
To see how each of the bull and bear wave counts fit within a larger time frame see the Grand Supercycle Analysis.
To see last analysis of weekly and monthly charts click here.
If I was asked to pick a winner (which I am reluctant to do) I would say the bear wave count has a higher probability. It is better supported by regular technical analysis at the monthly chart level, it fits the Grand Supercycle analysis better, and it has overall the “right look”.
New updates to this analysis are in bold.
I am using a new data feed. I have switched from using the Google / Yahoo data feed to using a feed via BarChart which comes directly from the exchanges. BarChart data should be more reliable.
BULL ELLIOTT WAVE COUNT
DAILY CHART – COMBINATION OR FLAT
Click chart to enlarge.
Cycle wave IV should exhibit alternation to cycle wave II.
Cycle wave II was a shallow 0.41 zigzag lasting three months. Cycle wave IV should exhibit alternation in structure and maybe also alternation in depth. Cycle wave IV may end when price comes to touch the lower edge of the teal channel which is drawn about super cycle wave V using Elliott’s technique (see this channel on weekly and monthly charts).
Cycle wave IV may end within the price range of the fourth wave of one lesser degree. Because of the good Fibonacci ratio for primary wave 3 and the perfect subdivisions within it, I am confident that primary wave 4 has its range from 1,730 to 1,647.
If a zigzag is complete at the last major low as labelled, then cycle wave IV may be unfolding as a flat, combination or triangle.
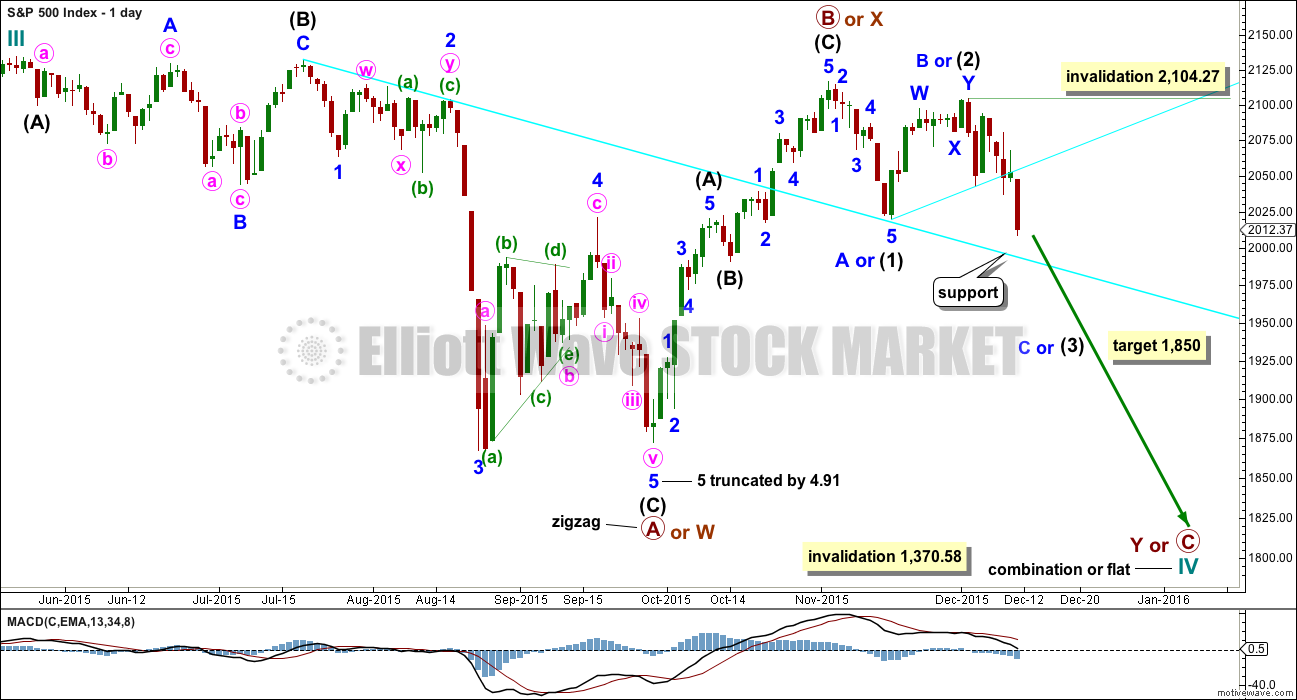
The wave count is changed today to again see primary wave B or X as a zigzag completed earlier. Primary wave C should subdivide as a five and primary wave Y should begin with a zigzag downwards. This downwards movement is either intermediate waves (1)-(2)-(3) of an impulse for primary wave C or minor waves A-B-C of a zigzag for intermediate wave (A). Both these ideas need to see a five down complete towards the target, so at this stage there is no divergence in expectations regarding targets or direction.
Primary wave A or W lasted three months. Primary wave Y or C may be expected to also last about three months.
Within the new downwards wave of primary wave C or Y, a first and second wave, or A and B wave, is now complete. Intermediate wave (2) or minor wave B lasted a Fibonacci 13 days exactly. At 1,850 intermediate wave (3) or minor wave C would reach 2.618 the length of intermediate wave (1). At this stage, this will be the sole target for this third (or C) wave to end as it fits better with more short term targets calculated at the hourly chart level.
No second wave correction may move beyond the start above 2,104.27 within intermediate wave (3) or minor wave C.
DAILY CHART – TRIANGLE
Click chart to enlarge.
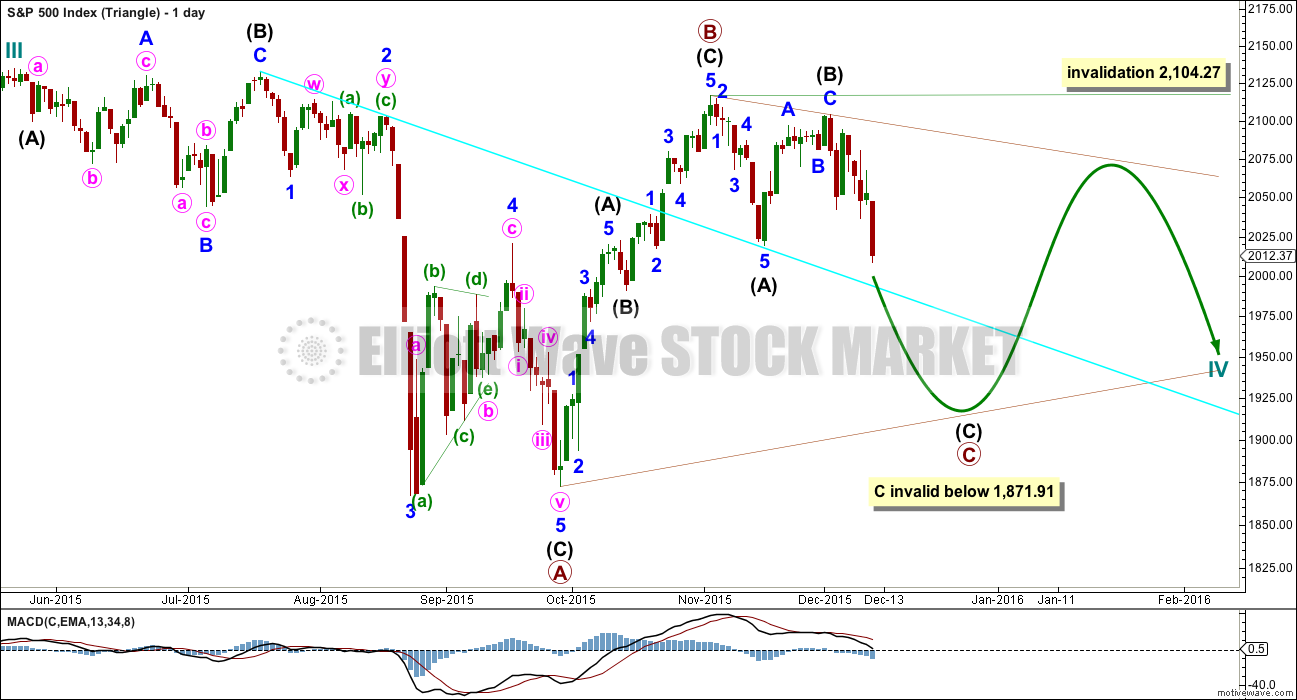
Cycle wave IV may unfold as a shallow triangle. This would provide alternation with the 0.41 zigzag of cycle wave II.
Primary wave B may be a complete zigzag. Primary wave C downwards may be underway and within it intermediate waves (A) and (B) are complete. No second wave correction may move beyond its start above 2,104.27 within intermediate wave (C).
The whole structure moves sideways in an ever decreasing range. The purpose of triangles is to take up time and move price sideways. A possible time expectation for this idea may be a total Fibonacci eight or thirteen months, with thirteen more likely. So far cycle wave IV has lasted six months.
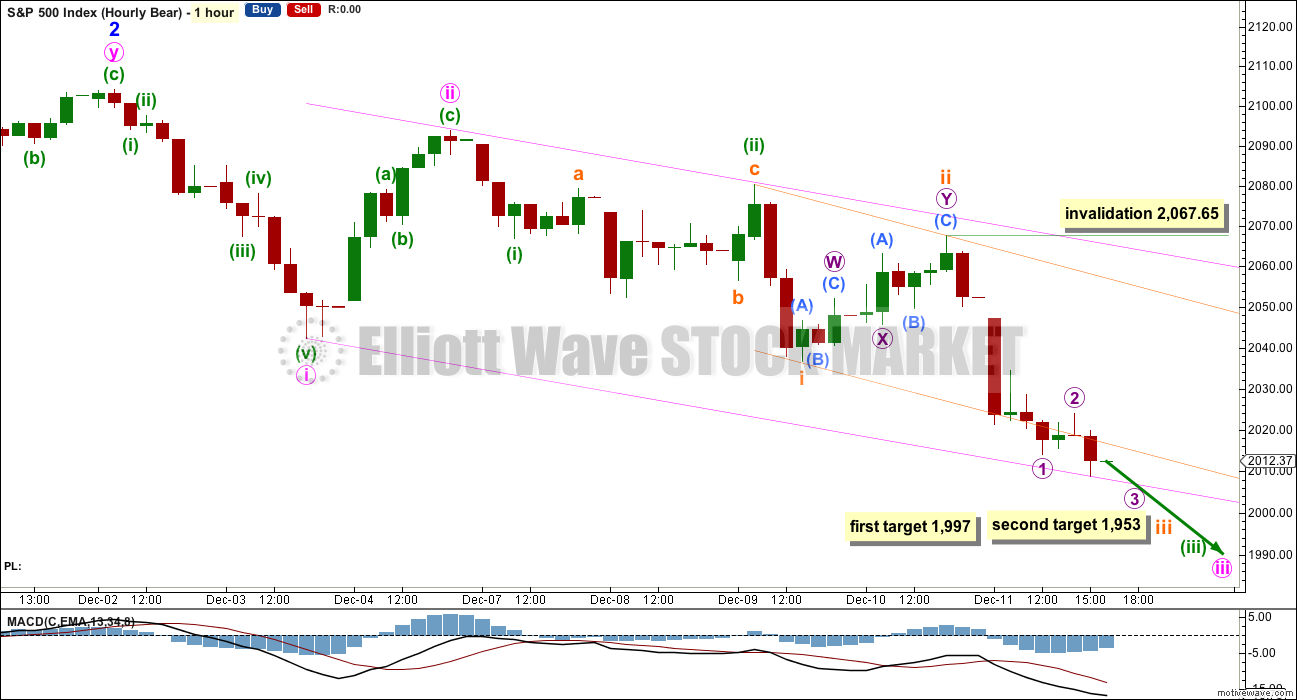
HOURLY CHART
Click chart to enlarge.
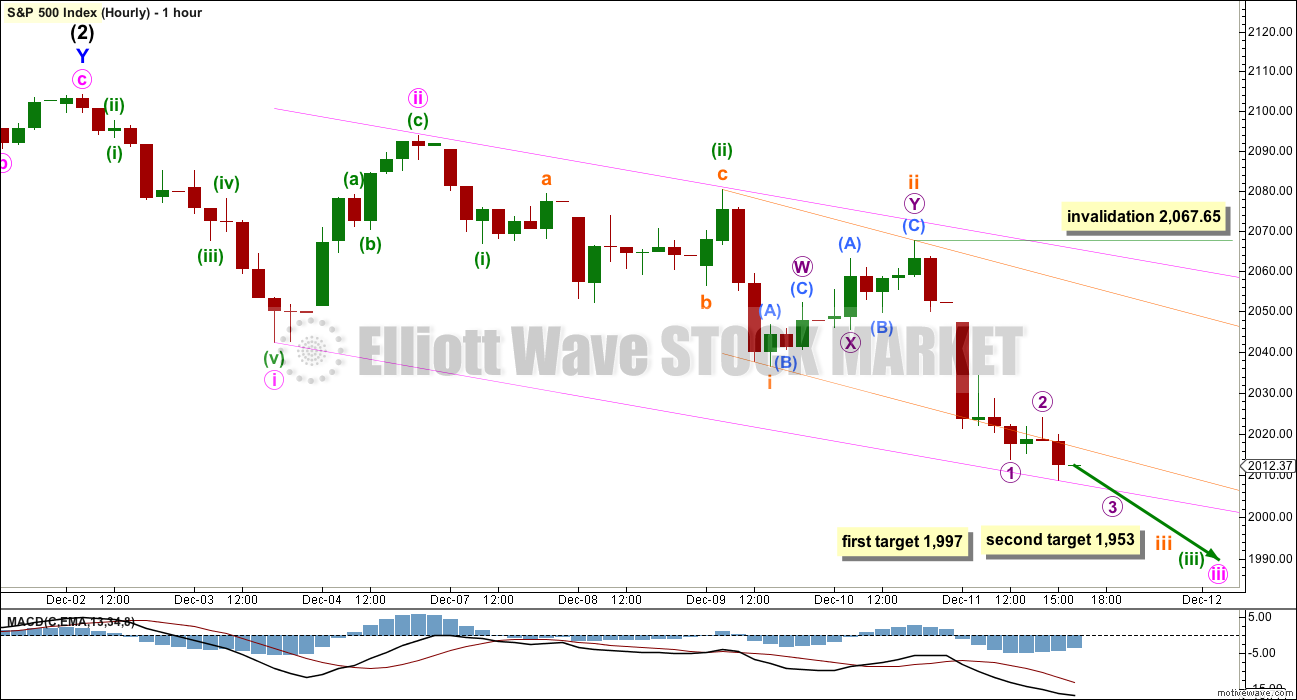
Both hourly wave counts will be the same today. The structure downwards for both is expected to be an impulse, which is incomplete.
An interruption to the downwards trend is not expected to show up at the daily chart level until subminuette wave iii is complete. Subminuette wave ii shows up on the daily chart as one green candlestick, so subminuette wave iv may also show up on the daily chart as one or more green candlesticks or doji.
At 1,997 subminuette wave iii would reach 1.618 the length of subminuette wave i. If price falls through this first target, of if it gets there and the structure is incomplete, then the next target is at 1,953 where subminuette wave iii would reach 2.618 the length of subminuette wave i.
The next Fibonacci ratio in the sequence is 4.236. This gives a target at 1,882.
A further increase in downwards momentum is expected.
The orange channel is a base channel about subminuette waves i and ii. It is being breached by downwards movement. Price should now find resistance about the lower edge of that channel.
The pink channel is an acceleration channel about minute waves i and ii. Keep redrawing the channel as price makes new lows. When minute wave iii is complete, the upper edge should provide resistance for minute wave iv.
If micro wave 2 continues any further, it may not move beyond the start of micro wave 1 above 2,967.65. This is the risk with this wave count at this time.
BEAR ELLIOTT WAVE COUNT
DAILY CHART
Click chart to enlarge.
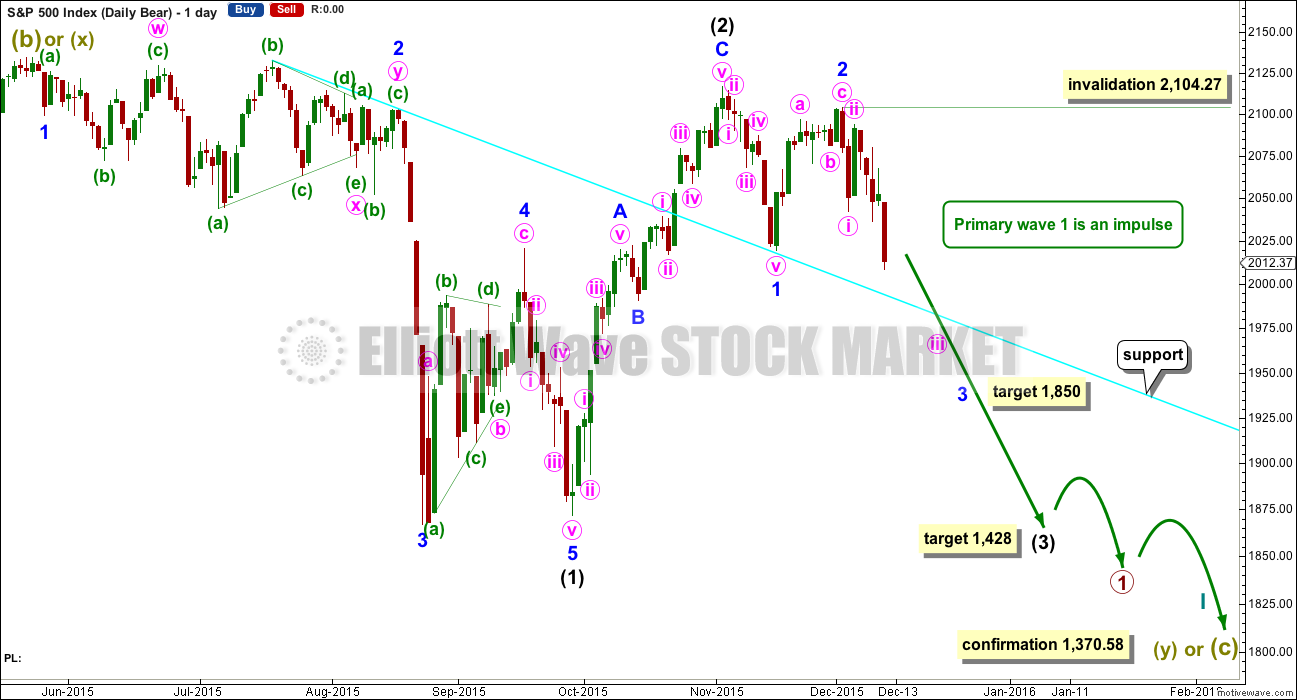
This bear wave count has a better fit at Grand Super Cycle degree and is better supported by regular technical analysis at the monthly chart level. But it is a huge call to make, so I present it second, after a more bullish wave count, and until all other options have been eliminated.
There are two ideas presented in this chart: a huge flat correction or a double flat / double combination. The huge flat is more likely. They more commonly have deep B waves than combinations have deep X waves (in my experience).
A huge flat correction would be labelled super cycle (a)-(b)-(c). It now expects a huge super cycle wave (c) to move substantially below the end of (a) at 666.79. C waves can behave like third waves. This idea expects a devastating bear market, and a huge crash to be much bigger than the last two bear markets on the monthly bear chart.
The second idea is a combination which would be labelled super cycle (w)-(x)-(y). The second structure for super cycle wave (y) would be a huge sideways repeat of super cycle wave (a) for a double flat, or a quicker zigzag for a double combination. It is also possible (least likely) that price could drift sideways in big movements for over 10 years for a huge triangle for super cycle wave (y).
The downwards movement labelled intermediate wave (1) looks like a five. If minor wave 2 is seen as a double zigzag with a triangle for wave X within it, then the subdivisions all fit nicely.
Ratios within intermediate wave (1) are: minor wave 3 is 7.13 points short of 6.854 the length of minor wave 1, and minor wave 5 is just 2.81 points longer than 0.618 the length of minor wave 3. These excellent Fibonacci ratios add some support to this wave count.
Intermediate wave (2) was a very deep 0.93 zigzag (it will also subdivide as a double zigzag). Because intermediate wave (2) was so deep the best Fibonacci ratio to apply for the target of intermediate wave (3) is 2.618 which gives a target at 1,428. If intermediate wave (3) ends below this target, then the degree of labelling within this downwards movement may be moved up one degree; this may be primary wave 3 now unfolding and in its early stages.
Within intermediate wave (3), minor waves 1 and 2 are complete. The upwards movement for minor wave 2 does have a strong three wave look to it at the daily chart level. Minor wave 2 was another deep correction at 0.87 of minor wave 1. At 1,850 minor wave 3 would reach 2.618 the length of minor wave 1.
It is still possible (but still less likely) that primary wave 1 is unfolding as a leading diagonal. I will keep that chart up to date and will publish it if and when it begins to diverge from the idea presented here. For now I want to keep the number of charts published more manageable.
The cyan trend line is very likely to provide some support for price along the way down. I would expect a bounce when price meets this line, even if only intraday. This may now be met on Monday about 1,997, which fits nicely with the first short term target at the hourly chart level.
HOURLY CHART
Click chart to enlarge.
At the hourly chart level both bull and bear wave counts are the same today.
TECHNICAL ANALYSIS
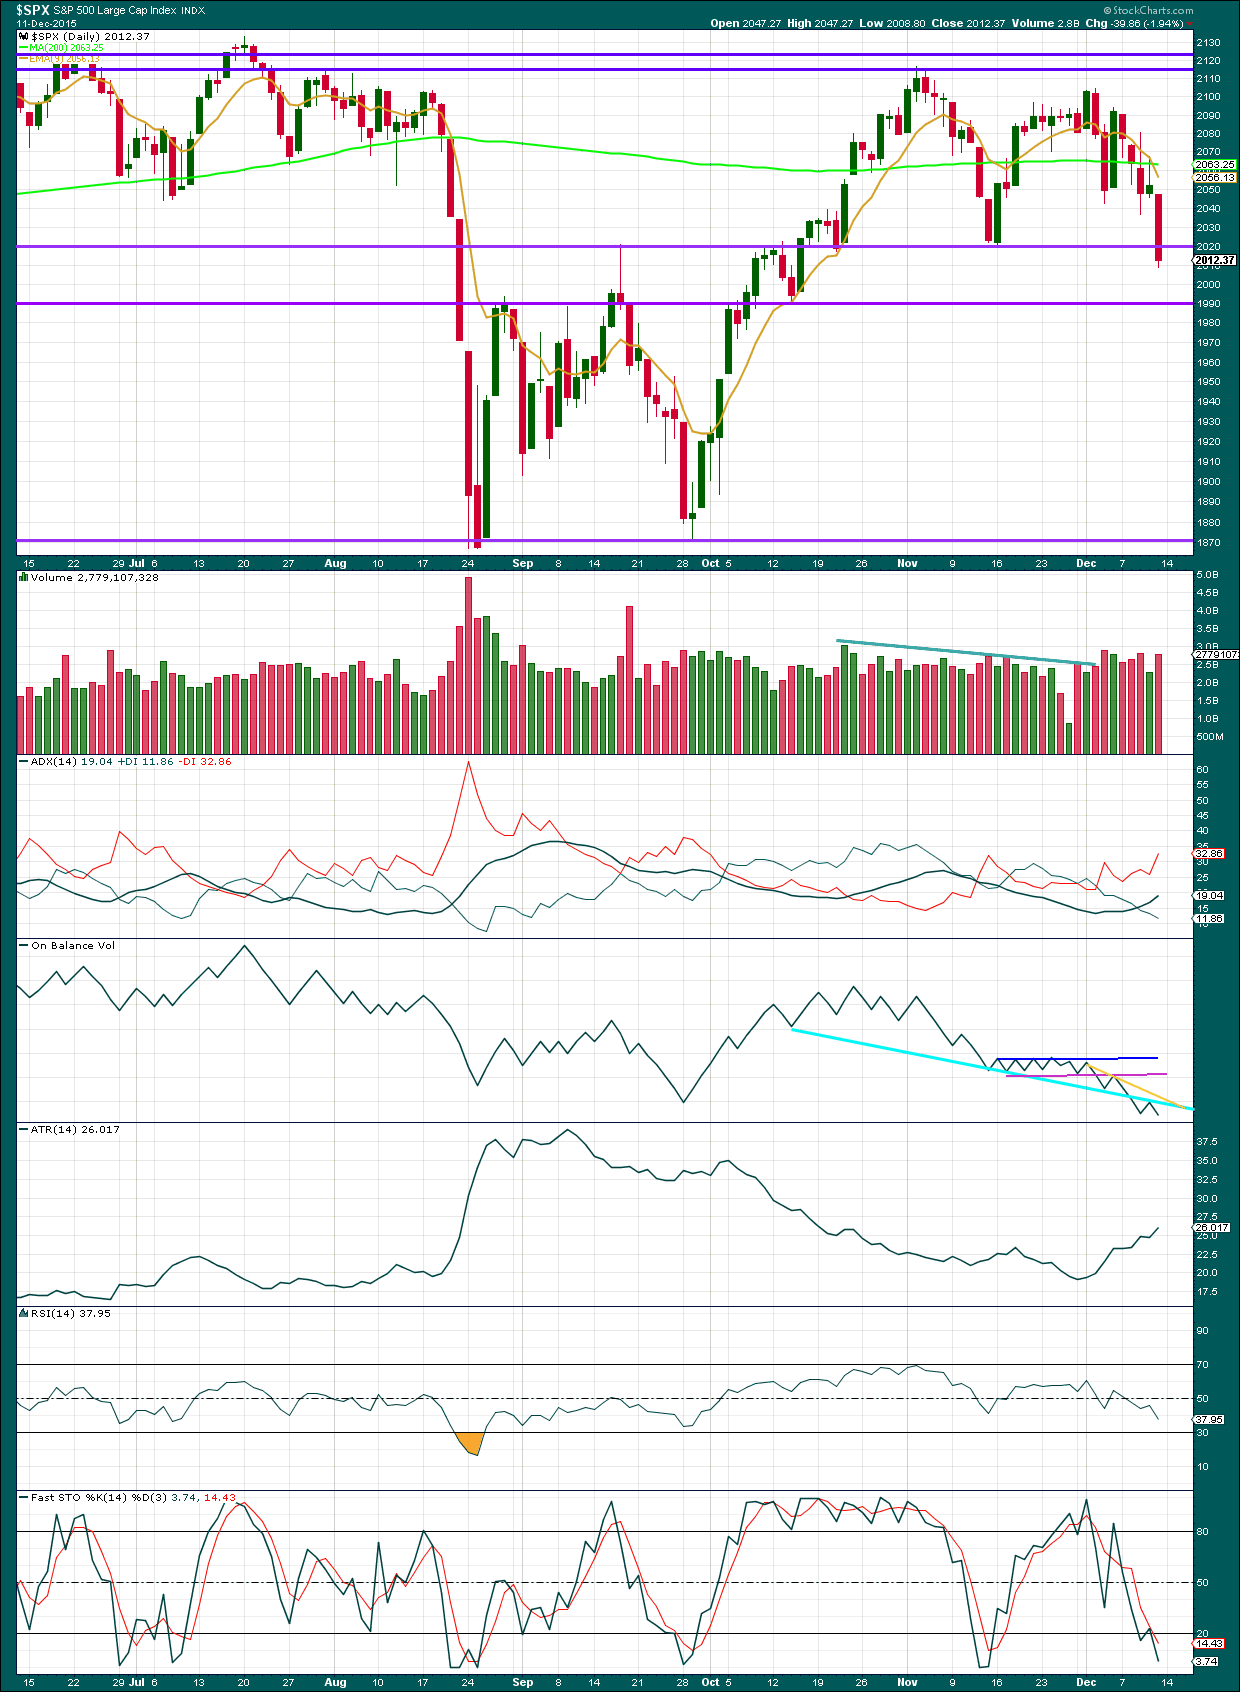
Click chart to enlarge. Chart courtesy of StockCharts.com.
Daily: Price has closed below the purple horizontal trend line at 2,020 which previously provided support (this line did provide some support intraday but was quickly broken through). Friday’s downwards day comes on an increase in volume. The fall in price was supported by volume.
Upwards movement may now find resistance at the trend line just broken through, if price throws back. This may not happen, but if it does it would provide an excellent opportunity to join the trend at an excellent price.
The next line of support is drawn about 1,990.
ADX and ATR both agree there is a trend. The trend is down.
The cyan trend line on On Balance Volume is adjusted. OBV has breached that line which then provided resistance. If OBV turns up again, that line should again provide resistance. OBV is a reliable leading indicator and has been persistently bearish of late.
RSI is not yet oversold. There is still plenty of room for this market to fall.
Stochastics is oversold, but during a trending market this can remain extreme for reasonable periods of time. There is slight bullish divergence between the lows of Friday and the prior swing low of 16th November. Price has made a lower low but Stochastics has made a higher low. This is a weak signal (I have learned the hard way to not give it too much weight). But it is bullish, and it is the only bullish indication I can see at this time from this chart.
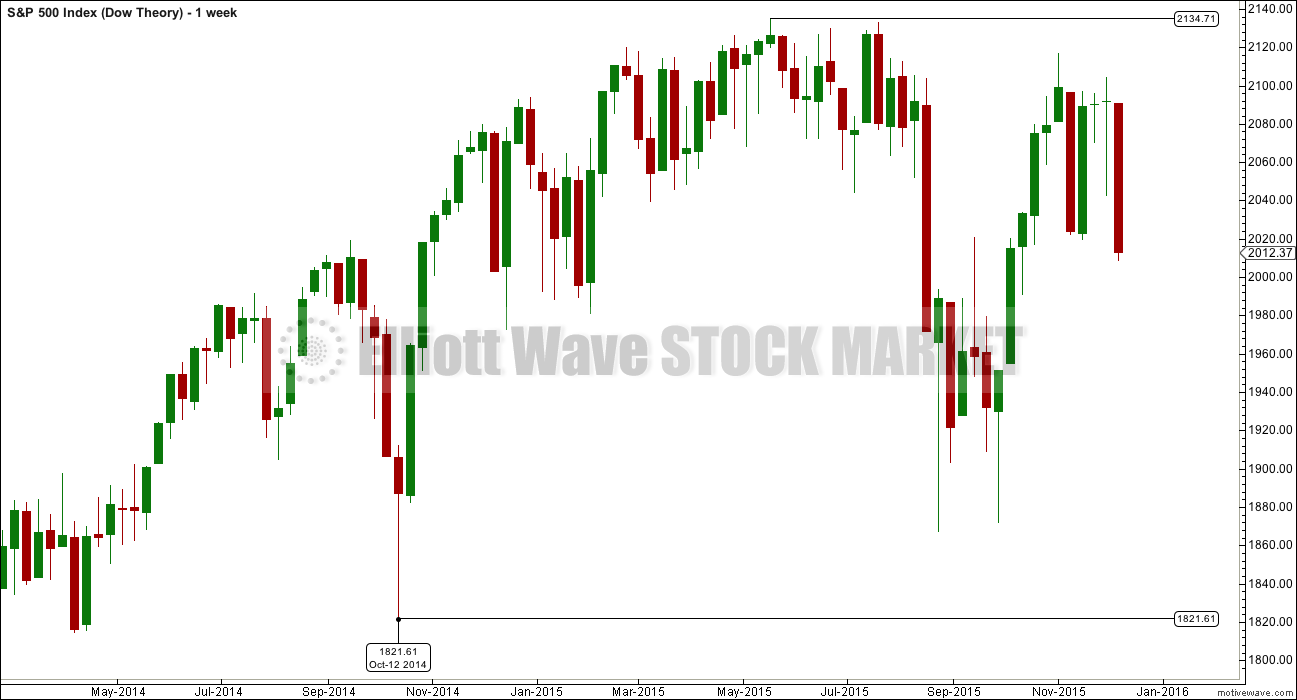
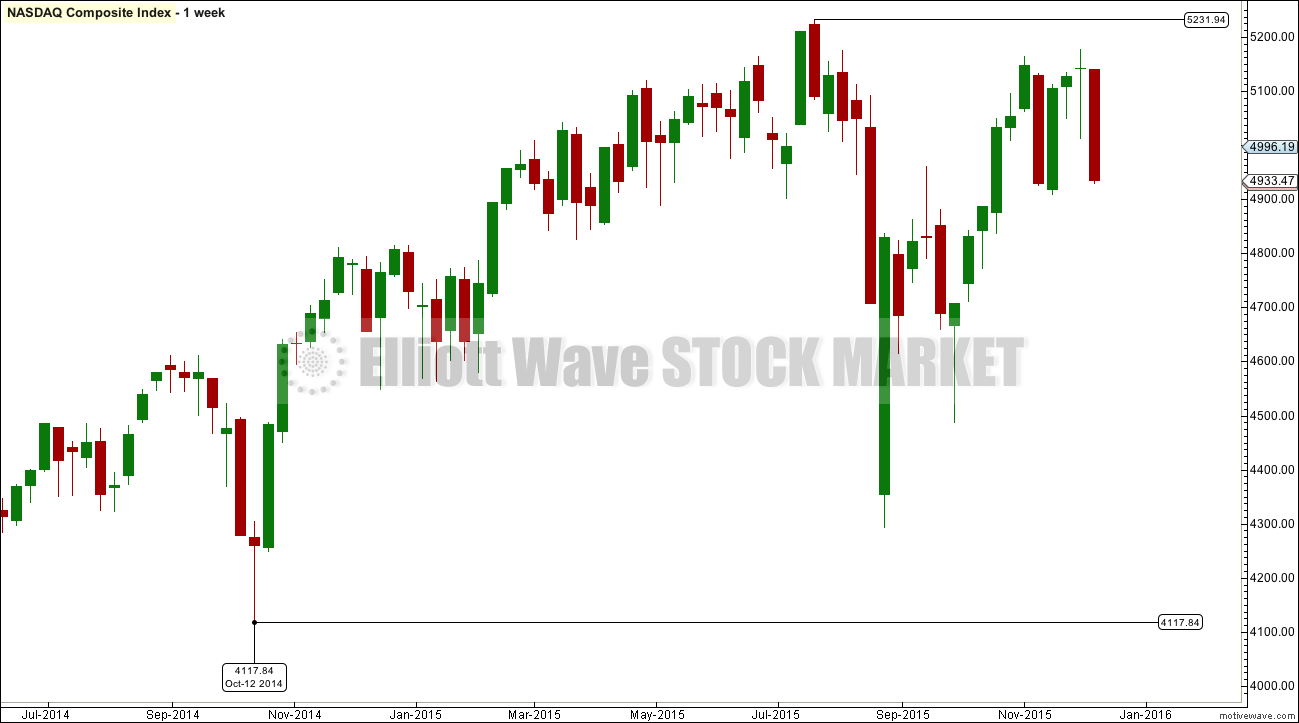
DOW THEORY
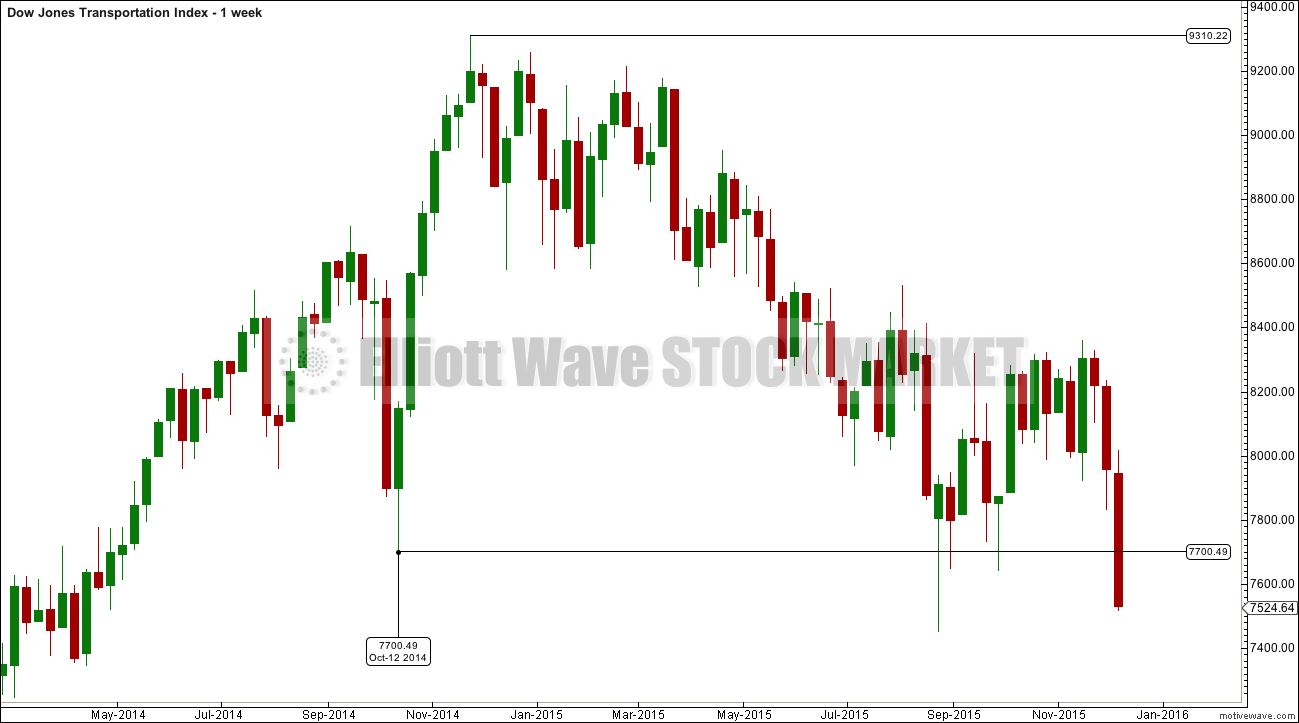
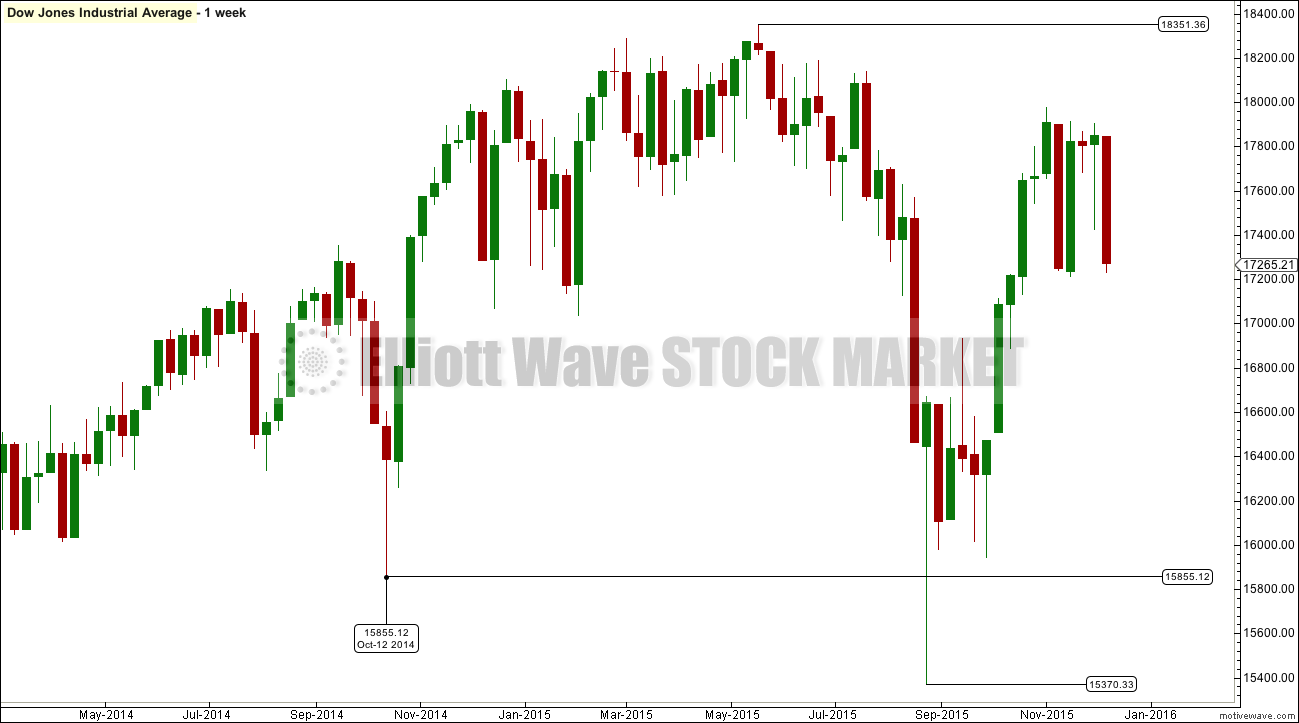
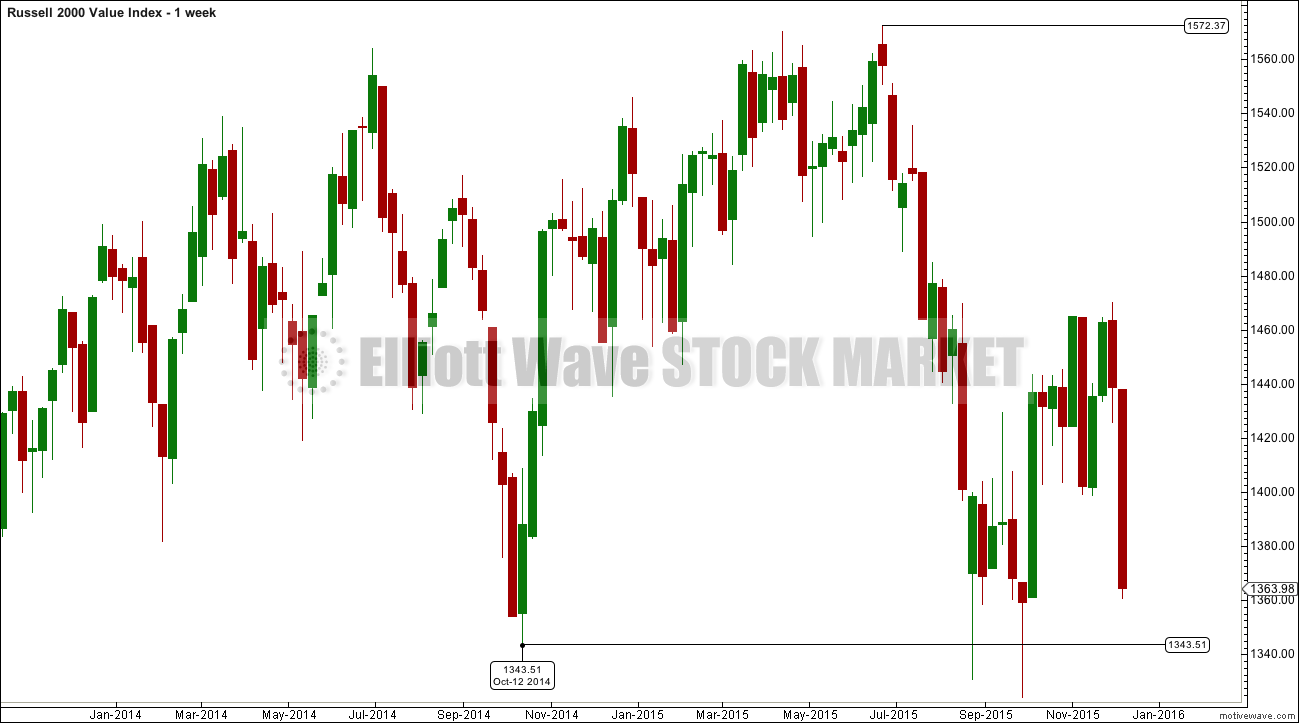
For the bear wave count I am waiting for Dow Theory to confirm a market crash. I am choosing to use the S&P500, Dow Industrials, Dow Transportations, Nasdaq and I’ll add the Russell 2000 index. Major swing lows are noted below. So far the Industrials, Transportations and Russell 2000 have made new major swing lows. None of these indices have made new highs.
At this stage if the S&P500 and Nasdaq also make new major swing lows then Dow Theory would confirm a major new bear market. At that stage my only wave count would be the bear wave count.
S&P500: 1,821.61
Nasdaq: 4,117.84
DJT: 7,700.49 – this price point was breached.
DJIA: 15,855.12 – this price point was breached.
Russell 2000: 1,343.51 – this price point was breached.
Click chart to enlarge.
Click chart to enlarge.
Click chart to enlarge.
Click chart to enlarge.
Click chart to enlarge.
This analysis is published about 03:21 p.m. EST on 12th December, 2015.
Five minute chart of UVXY looks like a 5,3,5 zig- zag, which if it is, although deep, would be corrective. Be ready to pounce tomorrow everybody…Ciao!
How low does UVXY go?
Long lower wick on VIX today. Correction should be over. Europe was down massively today so US markets strangely divergent. I suspect they will catch up tomorrow in a fifth wave down.
Thanks.
Some folk are still quite bullish, and counting today’s action as wave C down of an ABC correction for a minor wave four. It appears that EVERYONE, is still expecting a Santa Claus Rally. I’ll believe it when they re-take the 200 DMA on high volume…good luck with that… 😀
As far as I can see a wave count which sees an impulse up from the August lows, and so this downwards move as a fourth wave, would be invalidated below 1,948.04.
4 can’t move into 1 price territory.
Yep! I’m hoping we get an overshoot of your next downside target to lay that particular notion firmly and finally to rest… 🙂
Looks like a thrust form some sort of triangle at the close. These generally come just prior to the final wave so we should see a new low early tomorrow.
I also posted the VIX 90 min rejection last night. Interesting to see it play out. Hard call but was right..
This is wave four. We should get a new low tomorrow, possibly with a bullish engulfing candle to start an upward correction of one larger degree. VIX and UVXY both likely to make slightly lower highs than today – a good time to cash out and reload after the bounce.
Verne
You mean new Low on spx tommorow ?
Yes. For a wave five down.
Verne
Ok, so you mean new lows on the SPX and then a bounce into the FOMC and then a rip lower?
Hammer on the close. Bounce may arrive early…
I called the hammer yesterday as an option….
Monster lower wicks on VIX five minute chart. We may get a spike tomorrow…
nice to 1953?
Simply an observation, but the bounces seem to be getting weaker and weaker.
There have been 5 bounces since the wave started on Dec. 2nd, and they all look progressively worse.
The last bounce today up to 2018 was likely an attempt to reclaim 2020. Fail.
As I analyze the structure for subminuette wave iii, I’m left with the same conclusion that Lara has just shared. It’s incomplete, and quite frankly looks like a bunch of 1-2s, 1-2s, 1-2s. All of that should now be unleashed in a brutal move down.
Good luck everyone!
Many thanks Corey for your wise input as well!
Watching this market on RED BULL Drink all morning 🙂
Corey
Man do you think the 2020 game is over and we just plunge or bounce into the FOMC like we usually do?
I think my sentiments are pretty well expressed in my posting.
I’m watching crude. I’m watching 2020.
The bounce from 1993 was part of my plan, but a larger bounce into the FOMC does not fit my trading plan. It would only fit if we go sideways from here for a day and a half.
Good luck.
thanks. i got tricked on that fomc bounce….
Since crude seems to be a driving force recently, I’ve attached an hourly chart with a parallel channel.
Since the breakdown on Dec 4, the upper line provided resistance. We are sitting right there now.
The 2 hour chart shows a very nice hammer to complete the day, which can show exhaustion.
Probably notable too that XLE is currently red on the day, 1% off the highs.
If we put in a new low today and VIX and UVXY don’t reverse a temporary bottom would be indicated with a follow-up bounce of a day or two…
Are you looking for a low on the SPX below 1993 then by the close?
I think it will probably meander into the close and it the new low first thing tomorrow and immediately reverse. I would really like to see the new low before the close but I don’t know if it’s going to happen…I am tempted to cash in my bearish call spread on UVXY but I think I am going to keep it despite today’s decline…I got until Dec 31…
k
The first target is met and exceeded and the structure is still incomplete.
Use the second target at 1,953 now.
Awesome
Ditto
Yep! At least one more dive before a meaningful bounce. I think it will happen quickly so traders will have to be nimble…
haha
Verne
I had a Finance professor who used to work at UBS equities trading and I learned the ropes of Derivates from him with this book:
Options, Futures, and Other Derivatives (9th Edition) – John C Hull
It is worth the read imo!
Yeah, no jinx maybe 1950 then bounce it for santa possibly back to 2000(GUESS WHAT THAT WAS GOLDMANS YEAR END REVISED TARGET – FUNNY TO ME). I would like to see it break 1950 to be honest! so I can throw a new years party 😉
On the daily chart price has found support today right at the cyan trend line, that was where a bounce was initiated.
On the hourly chart downwards momentum is increasing.
I’m working on the five minute chart to see if micro 1 could have ended at todays low.
Either way, the structure of this third wave is incomplete. A further increase in downwards momentum is expected. The invalidation point will probably remain at the same place though today at 2,067.65 and so the risk with this wave count at this time is high. Targets remain the same.
Thanks Lara!
Lara,
What do you mean by “the risk with this wave count is high”? For those who are short or is the risk to the market as a whole? Thanks for chiming in today. Appreciated greatly.
Rodney
What I mean is if I’m going to enter short here my stop should be just above the invalidation point.
When I calculate that risk it’s reasonably high. For myself anyway.
The reward is huge though.
Understood. Thanks
Oh and also the risk with this market as a whole.
When the S&P makes big bear moves it’s quick, strong and hard to analyse.
The bounces can be a bit hard to predict and they can be really deep and sharp, taking out your stops and leaving you with a loss even if you’re on the right side of the trend.
This bear is hard to ride. Volatility is very high, and so risk is high.
Despite all the alarm bells going off, there is STILL a remarkable amount of bullishness in this market…talk about extraordinary delusions and the madness of crowds…! I think the perception of the invincible FED remains…
so we are probably going higher right now?
I think this is a fourth wave…
ok just read your other note. thanks
Vern,
But given Lara’s target we broke the 1997 – but not for long. So shouldn’t we head lower? Or is there a caveat?
Verne,
Btw last week during my major BEAR moment – I did mention we have a NEW moon cycle in play(Sagittarius). Isn’t that fascinating?
I wonder if that will help flush this lower?
verne, corey and john,
I want to see that SPX daily candle show an inverted hammer…. Ideally park it near the low range today to sleep better tonight….
Look at what VIX does prior to the close. If it goes back solidly in the green go ahead and sleep like a baby…
uh been quite a 2 years for me to be honest. I feel like a grave shift TRADER. I used to memorize every single inflection point from 1780 upto 2134.72 including the fib retraces. I could probably run a hedge fund now 😉
On what time frame vernecarty?
I want to see both VIX and UVXY back solidly in the green prior to today’s close. If not I will add a few more upside hedges to protect my positions. It looked like a UVXY five down on the five minute chart.
Verne
I think you are right. I think this was just the pull back to relieve the technical indicators across the board and then give it more room to thrust higher on the VIX and the etf UXVY….
I think we are looking at a fourth wave so a new low today or first thing tomorrow would be a great time to cash in and re-load on the subsequent pop…
oh o.k
verne, corey and john,
That vix daily candle looks like a reversal but the day isn’t over yet.
Perfect trick to fool the bulls 😉
Let the 3RD WAVE COMMENCE! NOW!
all
come on spx break down to 1950 already!
A, B,C up. Looks like C should have gone a bit higher but deep enough…
so you think heading back down in the close ?
verne – corey
this is crazy stuff, thoughts now guys?
We hit Lara’s first target (1997) for subminuette wave iii (overshot by 3 pts…brilliant!).
I suspect we are either in subminuette wave iv, or potentially subminuette wave iii is still not complete.
The bounce is all about 1993 trendline intersection, and the crude bounce.
SPX chart attached.
thanks john
Thanks Corey!
SPX 1993 intersection.
Thanks again for the cheapo volatility calls dudes!! 🙂
Here comes the 45 caliber…with hollow points…!
😀 😀 😀
yes although we could use a rug pull metaphor instead… we need to promote a peaceful world…
We *should* stall here. 2012-2013 area is the close from Friday.
I wouldn’t want to see more than one hourly green candle.
The buying was spurred by a test of 1993 support and the crude pop.
I’m trying to figure out the long thesis right now, and I’m not sure it makes sense!
…this leads me to conclude short-covering was primary reason for the quick move.
Subminuette iii is so far 1.68 the length of i….if this is subminuette iv, then our first target down is about 1972 (if v is equal to i, and iv doesn’t move much higher).
Stretching exercises on the springboard…(*Yawn*)
Reminds me of the scene in “Raiders of the Lost Ark” when that guy comes after Indy with all those fancy scimitar moves and he pulls out his 45 caliber… 😀
ok thanks im not getting in/out since i am in a pain trade now….. but not making the same mistake….
Very difficult to keep the big picture in mind during the daily gyrations isn’t it? Especially when money is at stake…this bit of a move up not even worth cashing in on upside hedges IMHO…remember the HPI rule… 😀
hpi please elaborate?
Look at the performance of your hedges when the market is moving against you, (Hedge Performance Indicator) they should give you a good clue as to whether you are seeing a genuine reversal or a counter-trend move.
What’d you buy?
for education i get out of the money spx puts in jan
Why on earth did you get out?! You had plenty of time with a January expiration.
Verne
The bulls are trying very hard. Your take now on what you are seeing?
They are trying to claw their way back to the 200 DMA as well as defend DOW 17,000 and SPX 2000 floors. Let’s see what the bears have to say about that…if this is a third wave down, and all the evidence affirms that, they are spitting in wind… 🙂
you think we hit 1850 – honestly in 2 weeks?
IMHO, we are going to blow it out of the water; have you seen what is happening in the bond market? So far it is NOT being reflected in the equities markets…but it will…sooner rather than later I think…
Sure looking like a reversal isn’t it? NOT!!! 🙂
Just trying to shake out the weak hands ahead of the plunge IMHO…
Yes!
Back to full short.
Nice little bounce from 1993.
If this is our sextuplet 3rd, then 1993 should not hold.
Good luck.
Thanks Corey! you guys are team awesome!
You tha’ man!!! 😀
Just threw in the last 1/3 of stash in short…this should be interesting
That is exactly my thinking too Corey. I was waiting for a bounce to enter…
If the wave count is right then the next move down should be big, strong and fast.
I need to calculate lower targets just in case.
Guys,
Lara’s count is so precise. I am looking for 1953 guys. So, I am hanging in there.. We broke 1997 so I am sold we are headed down …
The next move down should be energetic…
Verne,
how long is this bounce going last up? Do you think we go higher or this its just a temp intra day move up before heading lower?
We did break 1997 but not for long. Because of the quick return above 1997, I treat it the same as a tag. Thus the second target of 1953 has not been activated. I am thinking we must decisively break 1997 and stay below it. If this is in fact the 3rd of a 3rd etc, it must gain momentum on the daily and hourly MACD. Just my thoughts. And Verne, I am always looking for more education. Thanks.
I think from what I understand it was breached so that is sufficient confirmation.
Targets are different than invalidation points. Invalidation points cannot be breached by any amount no matter how small. But targets are often a range.
I am sure Lara can clarify this for us sometime.
Lara did say that we would see a series of 3rd and 4th waves if the bear count is correct. I am figuring we are now in one of those 4th waves. How far it goes will tell us at level the wave shows.
ok
I think the first target is inadequate.
I don’t think the middle of the third wave is over yet.
Use the second target.
I dont want to complicate things in the 3rd wave. I stick with the targets MATEY!
Guys, I’m taking half my short off and looking for micro iv bounce intraday.
Re-load as things stabilize, go sideways.
Of course, might be wrong which is why I say half.
Lot’s of open space below 1993.
Wise…
11.33 EST UVXY at 42.63 I am conflicted, close out UVXY in anticipation of correction or ride thru corrections? Or maybe no significant correction coming?
Absolutely! Take profits and roll half your take into new positions. If DOW breaks 17,000, back up the truck… 🙂
The sweet spots of the UVXY trade come the day before the final spike up and the day after. It can be a bit tricky but will try to give a heads- up for those following the trade…for education purposes only!!!!! 😀 😀 😀
VIX and UVXY getting ready to flash another bull flag…
Vern–yes heads up appreciated. For educational purposes only of course.
Of course…! 🙂
Battle lines being drawn for skirmish around DOW 17000 and SPX 2000. Bulls would like to delay a break in hope of some kind of FED rescue. The next hour or two should be interesting….rolling volatility calls on the dives…
verne
I am back couldn’t ignore the markets on an important day are we heading lower or what on SPX? no more bounce expected? did we cross the point of confirmation down?
Keep an eye on DOW 17000. If we break it today we are headed for the sweet spot of the third wave down and the August lows…no matter what people think the FED is or is not going to do…
thank you
T2108 testing 15%
Right on the line !!!!!!!!!!!
Filled a gap
Now down to 14%
The next time we re-visit the underside of the 200 DMA may not be until primary one (for the bear count)is over. Friday notably sliced through both the 50 and DMA in one session…
verne
Im taking day off – nothing to see here.
cheers!
Those words sound strangely familiar… 😀 😀 😀
Hmmmm….not sure about that!
This action so far says there might be a lot to see here!
You’ve got to give the bulls some credit. They are fighting this thing tooth and claw. I think they are terrified of loosing DOW 17000 and SPX 2000.It is really fun to watch a third wave unfolding!
Off the springboard!
At 10:12 someone came in big with selling.
This is f’ing NUTS up and down.
2020 was a gift. Loaded short.
verne
mark my words – the VIX will get crushed right here over the next few days…
Don’t care. I intend to book profits early and often… 😀
i do
Looks like micro 2 doing a few more stretching exercises on the springboard before the dive off… VIX pointing steadily NORTH
MMs were nice enough to fill me on a “stink-bid” on a few more UVXY calls this morning at the open. 🙂
It did not take long to turn red. Thanks for your thoughts on UVXY.
Anytime. Not a bad idea to book profits on the next plunge. Knowing these banksters, if we get a run-away decline expect them to front-run the FOMC meeting with some inane comment about a rate hike not being an absolute guarantee pending a more detailed analysis and assessment of the data…blah! blah! blah!
be careful OIL UP – i doubt they slam it lower until after WED.
Oil is going nowhere fast. Inventories out the wazoo…
Verne
Maybe a doji or hammer at the cash close 😉 Looks like it now anyways with grinding action…
Well, well, well…! I did not think they would try it but boy was I wrong. The banksters had the DAX futures bid up over 2% overnight and US markets up almost 1%. They blew an awful lot of capital. I noticed after DOW futures plunged by almost fifty this morning they are again desperately trying to bid it into the green. As I said before, ignore ’em.
Meanwhile junk bonds have fallen to a new six year low.
BANKSTERS….IT’S OVER!!!!! 🙂
Good call Vern
Deviation on the HR ES But it still broke support
Daily ES back above S/R lines
Nice DOJI 😉
Lets wait for the cash close.
Please wait MATEY!
I want a sell off to but 2030-2040 looks ideal if not higher before the plunge….
Hi guys.
I’m beginning to think about taking a long term position in Oil and wondered if anyone had any recommendations on the best vehicle for this?
A spreadbet would be easy but the ongoing cost for a 2/3 year hold might be prohibitive?
Thanks a lot
USO probably as good as any. The bottom is probably still several months away though. I would ladder into the position with bearish call credit spreads while price continues to fall. When you are confident a bottom is in, close out the sell side of the spreads and you are positioned for the upside while getting paid to do so.
Thanks a lot. I’m nowhere near as experienced as you with this- you might have to explain the options part to me?
Thanks again
VIX Futures updates! ouch!
WOW – just getting crushed down -4%
Buy, buy, buy…!!!!!! 😀 😀 😀
Verne
I found this comment online just now :
THERE WILL BE NO SELLING WITH YELLEN !
🙂
To a great week for all of us!
cheers!
Verne
VIX Futures getting smoked. Not a lot going on this Sunday… Sorry MATEYYY not a down Monday on S&P as of yet GAP AND GO 😉
VXF16 21.41 -0.52 (-2.35%)
corey, john, verne and olga:
One last comment before I shut down today – I think we bounce the next few days into the FOMC minutes around 2020-2035 and then reverse dump.
laters,
uhh looks like 2060 could be a target now….
verne
REMEMBER THIS?
8 TRADING ONLY AFTER THE FOMC REVERSAL -7.5%
According to Lara’s wave count, we are on the threshold of a micro three, of a subminutte three, of a minuette three, of a minute three, of a minor three, of an intermediate three down. We are looking at a stacked sextuplet of threes down so bounces should be the last thing on our minds IMHO.
I am actually thinking about how a waterfall decline, if indeed this is what unfolds tomorrow, is likely to influence FED policy. See ya on the boards tomorrow GW. Ciao
Ok but I think the waterfall can wait 2 more days.
Futures up +.21%
Plus the market just won’t plunge that much maybe.
I like to wait for confirmation intra day and see how it plays out tommorow. I think they can halt it and interrupt it for 2 days.
I switched full bear mode last week but never never underestimate the dip buyers 😉
VERNE
FED DAY IS WORTH WAITING FOR. OPTION CONTRACTS PRICES CAN BE A GOOD BARGIN 😉
Verne
I also follow fat pitch blog:
Check out his statement:
Next week is also December OpEx. This is one of the most bullish weeks of the year. SPY has closed higher from the prior week close within 10 days every time in the past 30 years (data from Rob Hanna).
Verne
Not sure If this is right but I see a reversal signal on the 1 hour VIX candle. They did manage to push it back down 30 min into the close. The target pull back on VIX should be 20-18. Just saying – that is inline with a bounce on the SPX as Lara pointed out.
Check out chart attached? Thoughts?
Looking at the big picture, I see bull flags over the last several sessions, which is right in line with the wave count.
Right now I am making a big distinction between smaller degree corrections in the form of short term bounces and a reversal of at least minor degree. Minor two was deep so alternation would expect a relatively shallow minor four which is when I think the expected “rally” will occur.
Trading the small degree corrections is in my view not worth the effort.
oh o.k
john and verne,
How long have you been trading the SPX in general? I am trying to understand the level of SPX trading experience on this blog.
I have been playing with charts since 2000 but focusing just on the SPX & ES for only two years …….i.e. just starting
NICE.
John
Have you ever looked at northman traders work ? I’m just curios as he is looking for a bounce too and points at nymo saying we are extremely over sold. Thoughts on that ?
verne,
Good day. do you think the VIX can pop higher Monday or we just open flat and grind sideways with a slight bounce up on the SPX from 1997?
G’day mate.
Futures pointing lower.
Will we see one of those bizarre events of futures being bought up to the tune of several hundred points as we have occasionally seen in the past?
I doubt the banksters are going to even try.
They will have to spend a billion.
The folk breathlessly predicting a December rally may indeed get it, but think of the implications.
It would certainly mean that this impulse down would have to unfold with a rapidity and ferocity we have not seen for quite some time.
As the lady said, the trend is down…
As for the VIX, it looks to be just getting up a head of steam…
ok, I say minimum we bounce off of if we get there 1997 or current levels should happen sometime Monday.
What will be scary is if we get a doji at Mondays close.
and rally all week upto that top channel at 2060.
markets just dont go down a straight line.
at best we should retrace 50% of fridays candle at 2030.
Do you have a wave count scenario for a 50% re-tracement? Minuette four or minor four?
No, I was just general sketching- So, i could be dead wrong but but A bounce is due and going up into the fed is the way this market works imo.
John,
Did you see those guys on artofchart looking for a complete retrace and massive bounce early in the week? Isn’t that something else? Have you followed them and noticed any consistency in general 50/50 on market calls?
I have not been there in a long time, but I will go and look.
I know they were seeing a major top end of Feb early March partially based on cycles/time projection. I know that they favor the seasonal tendencies for Dec which would include a rally
They are very bright and have a good record….as does Lara!
A second opinion is always good as long as you are not unconsciously searching for versions you “wish” would happen……It is often hard to catch yourself !
Right Monday should be telling
This new charts stacking of all the 4 US Indices is a very good addition!
Dow Theory being the Grandaddy of all TA, I’m waiting and watching to see if that very bearish wave count is confirmed.
Despite the weeks of bullishness, and deep movements, it is very telling so far that none of the major indices have managed to make new all time highs. That in itself is somewhat bearish.
Good catch. The problem with understanding markets is that most technical books written in the 70’s and 80’s by themselves aren’t good enough being applied to day to day current markets. Also, I have had so many subscriptions but none are really consistent and use the same tag line head lines that really don’t add value like yours. You should write a book!
I am writing a book, but it’s primarily based on Elliott wave. Not classic technical analysis.
The text books I currently have are all written or updated (latest editions) in the 2000’s.
My favourite (I refer to this regularly) is Magee’s “Technical Analysis of Stock Trends” which was last updated 2007. But it’s an old book. It’s a classic, and I’ve learned so much from it.
The other one I refer to most regularly is Kirkpatrick and Dhalquist’s “Technical Analysis” which was last updated 2011.
When studying for my CMT I was introduced to point and figure charts. It was taken out of the curriculum for level III (which I think was a shame) and so I’ve not spent much time on it for the last few months. Now I’ve finished my exams I’m going to go back and re read that book and start to include point and figure charts in my analysis once I’m confident enough.
I want to use it in trading because I think it adds a great deal of confidence to knowing when a trend is confirmed, and it helps so much with setting stop losses and targets.
That is my next challenge. Point and figure.
Oh yeah, and finishing my book which Cesar will then need to proof and make pretty with his artwork 🙂
Nice! I can’t wait to buy your book. It should be used at Top Ranking US Universities teaching Financial technical courses. I remember my old Finance professor he wrote 2 books and sold them back to the University as required text for Financial Management and did well…
The NYA has also made a new closing low below the Oct 2014 low adding further support for the bear wave. With most people expecting a Santa Claus rally into the year end, this bear market will surprise them and catch them napping.
Thanks for all your analysis and commentary.
Rodney
Rodney what about nymo ?
People often forget some of the most spectacular declines can come in very over-sold conditions. The bullishness of the markets has remained extreme for many years so we ought not to be surprised by a “Slope of Hope”….
oh o.k. 1-2 days 20-35 points would be the perfect trap for the bulls before they pull the sell trigger.
Many Thanks Lara!
You’re welcome! It was a pleasure this week to do this S&P analysis.
I’m so happy that bull wave count is now invalidated, but that does mean I need to spend some time looking for a new alternate.
makes sense
Thanks for the targets Lara!
You’re welcome.