
I have only bear Elliott wave counts for FTSE.
Summary: FTSE may have today begun the middle of a third wave down. Both wave counts have a target for this downwards fall to end at 5,787.
To see monthly and weekly charts and the bigger picture see last analysis here.
New updates to this analysis are in bold.
FIRST WAVE COUNT
Click chart to enlarge.
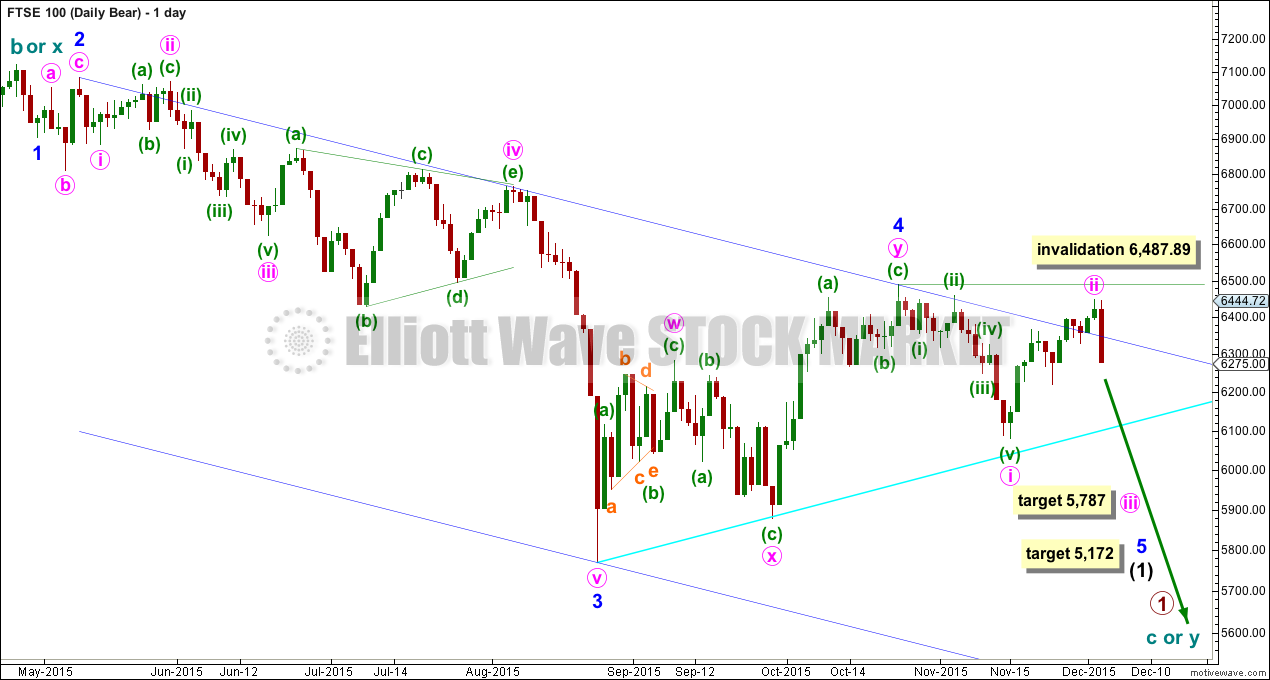
So far downwards movement may be 1-2-3-4 with a fifth wave needed.
If the next wave down shows a decrease in momentum beyond that seen for minor wave 3, then this first wave count would be preferred. At 5,172 minor wave 5 would reach equality in length with minor wave 3.
The Elliott channel is not working perfectly, but it may still show where price may find some resistance along the way down.
Minute wave ii may not move beyond the start of minute wave i above 6,487.89 within minor wave 5.
Minute wave ii is very likely to be over. There is almost no room left for it to move into and today’s strong downwards day looks like the start of a new impulse. At 5,787 minute wave iii would reach 1.618 the length of minute wave i.
Along the way down, FTSE may find some support for a small bounce at the cyan trend line.
SECOND WAVE COUNT
Click chart to enlarge.
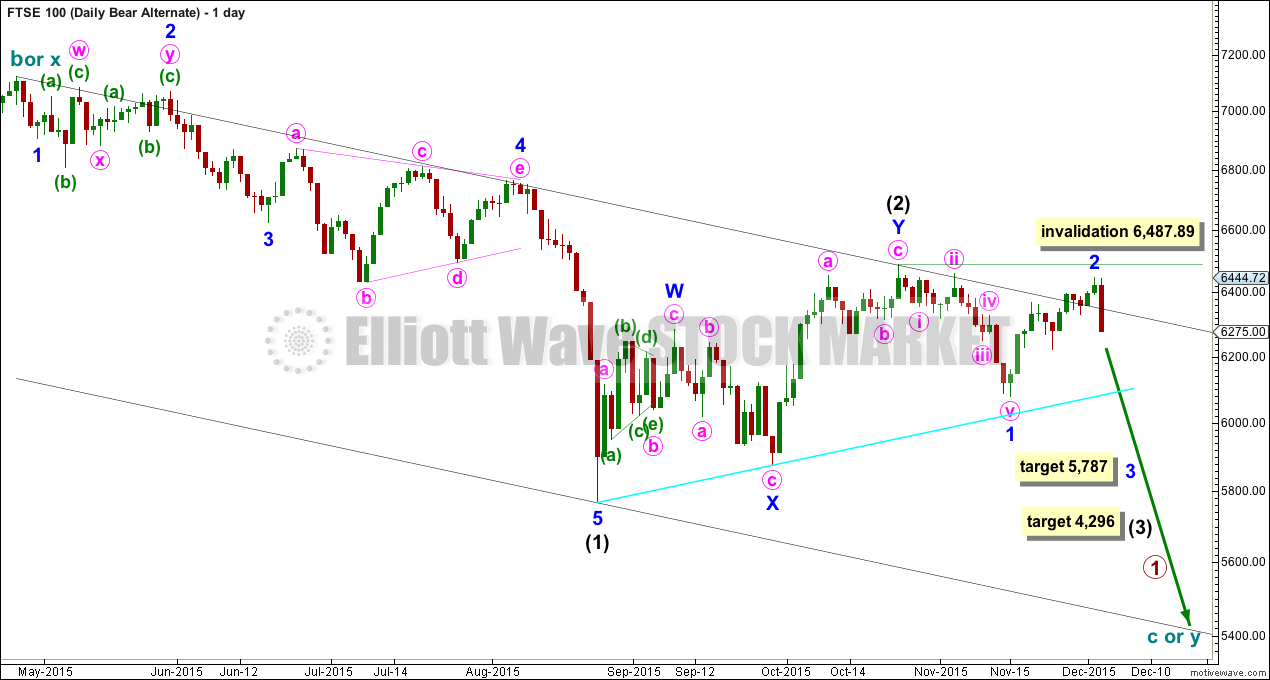
The next wave down for FTSE may be a strong third wave.
If the next wave down shows an increase in momentum, then this would be the preferred wave count for FTSE.
At 4,296 intermediate wave (3) would reach 1.618 the length of intermediate wave (1).
Minor wave 2 may not move beyond the start of minor wave 1 above 6,487.89 within intermediate wave (3). This channel is a base channel about intermediate waves (1) and (2). Along the way down, upwards corrections should find resistance at the upper edge of that channel. The channel is not working perfectly but may continue to show were upwards movement may find some resistance.
If a third wave down is underway, then it should have the power to break below the lower edge of this base channel. If that happens, this wave count would be strongly preferred over the first wave count. A third wave would be confirmed.
The short term target is the same. At 5,787 minor wave 3 would reach 1.618 the length of minor wave 1.
TECHNICAL ANALYSIS
DAILY CHART
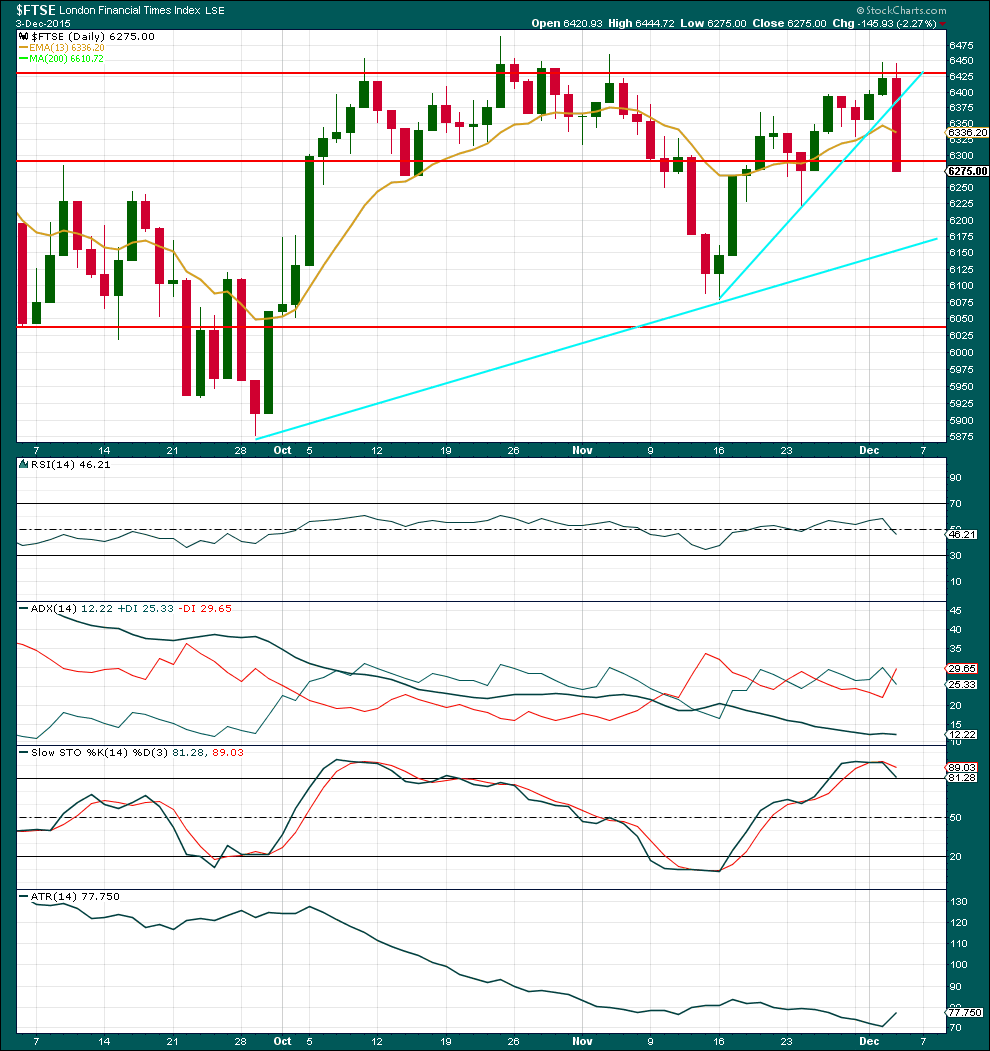
Click chart to enlarge. Chart courtesy of StockCharts.com.
There is no volume data on either the FXCM feed or StockCharts. Volume analysis is done from Yahoo Finance data.
A strong downwards day comes on some increase in volume. There was some support for this fall in price.
Price has closed just below the next horizontal trend line, but it is not completely clear exactly where this line should be. Price may yet find some support about here for a small bounce.
RSI is neutral. There is plenty of room for the market to rise or fall.
ADX is flat and below 15. No trend is indicated. ADX does tend to be a lagging indicator. ATR mostly agrees; it has been declining. For the last two days ATR has turned upwards. This may indicate the early stages of a new trend and should be watched closely.
Price found resistance at the upper horizontal trend line while Stochastics was overbought. Price has turned downwards after finding resistance, so now should be expected to continue overall to move lower until it finds support and Stochastics is oversold at the same time. At this stage, Stochastics is only just beginning to turn down. There is a long way for price to fall before Stochastics reaches oversold.
This analysis is published about 01:39 a.m. EST.
Anybody knows an ETF tracking FTSE with sufficient daily volume to make a downside trade worthwhile? Gold and the miners also seem to be presenting a good opportunity in the what looks like an upcoming ABC after the initial five up off the bottom.