Sideways movement in a slightly wider range remains above the invalidation point on the hourly chart.
The Elliott wave count is changed slightly but the outlook is essentially the same.
Summary: The trend is still down, but a bear market rally continues and is not done yet. It may end towards the middle or end of this week. A new high above 2,116 is expected. Short term more sideways movement should remain above 2,066.69 and be followed by a short sharp thrust upwards. Thereafter, the downwards trend should resume in force. This bear market rally is extremely unlikely to make a new all time high. It is expected to stop before 2,134.72.
To see how each of the bull and bear wave counts fit within a larger time frame see the Grand Supercycle Analysis.
To see last analysis of weekly and monthly charts click here.
If I was asked to pick a winner (which I am reluctant to do) I would say the bear wave count has a higher probability. It is better supported by regular technical analysis at the monthly chart level, it fits the Grand Supercycle analysis better, and it has overall the “right look”.
New updates to this analysis are in bold.
BULL ELLIOTT WAVE COUNT
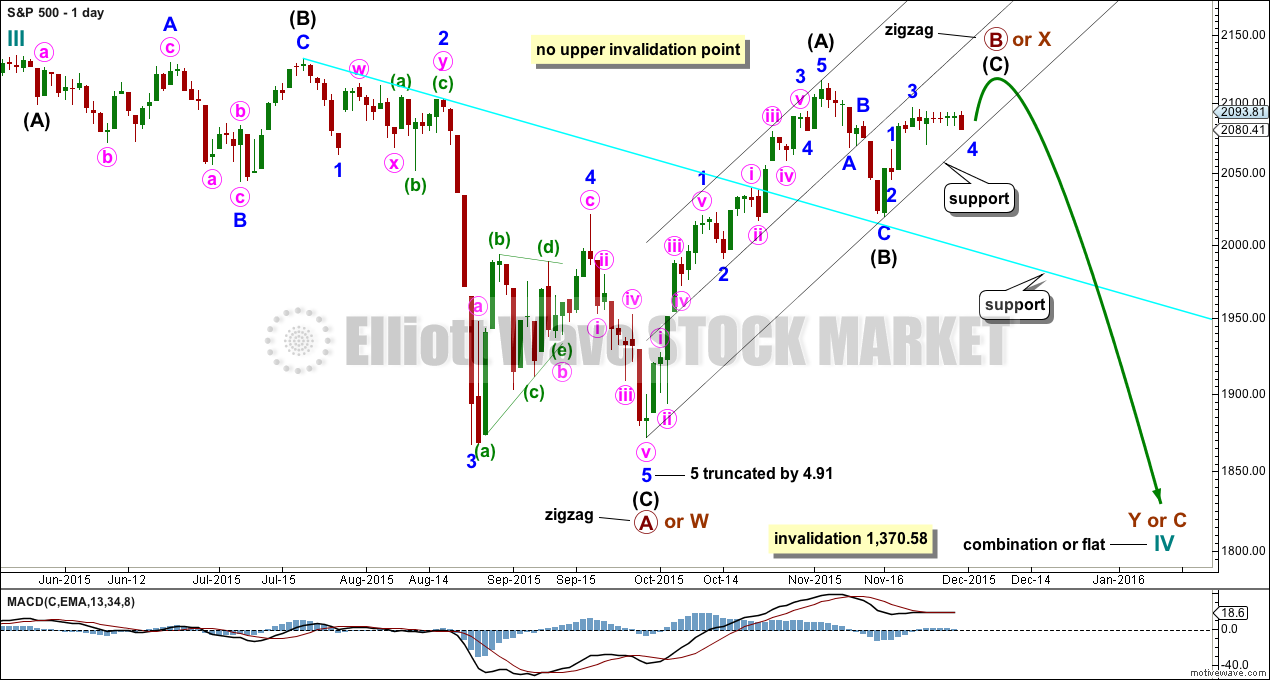
DAILY CHART – COMBINATION OR FLAT
Cycle wave IV should exhibit alternation to cycle wave II.
Cycle wave II was a shallow 0.41 zigzag lasting three months. Cycle wave IV should exhibit alternation in structure and maybe also alternation in depth. Cycle wave IV may end when price comes to touch the lower edge of the teal channel which is drawn about super cycle wave V using Elliott’s technique (see this channel on weekly and monthly charts).
Cycle wave IV may end within the price range of the fourth wave of one lesser degree. Because of the good Fibonacci ratio for primary wave 3 and the perfect subdivisions within it, I am confident that primary wave 4 has its range from 1,730 to 1,647.
If a zigzag is complete at the last major low as labelled, then cycle wave IV may be unfolding as a flat, combination or triangle.
Primary wave B or X is an incomplete zigzag unfolding upwards. If cycle wave IV is an expanded flat correction, then primary wave B may make a new high above the start of primary wave A at 2,134.72. If cycle wave IV is a combination, then primary wave X may make a new high above the start of primary wave W. There is no upper invalidation point for these reasons.
Primary wave A or W lasted three months. When it arrives primary wave Y or C may be expected to also last about three months.
Intermediate waves (A) and (B) together lasted a Fibonacci 34 days within primary wave B or X. So far intermediate wave (C) has lasted eleven days. It may end in a further two days to total a Fibonacci thirteen.
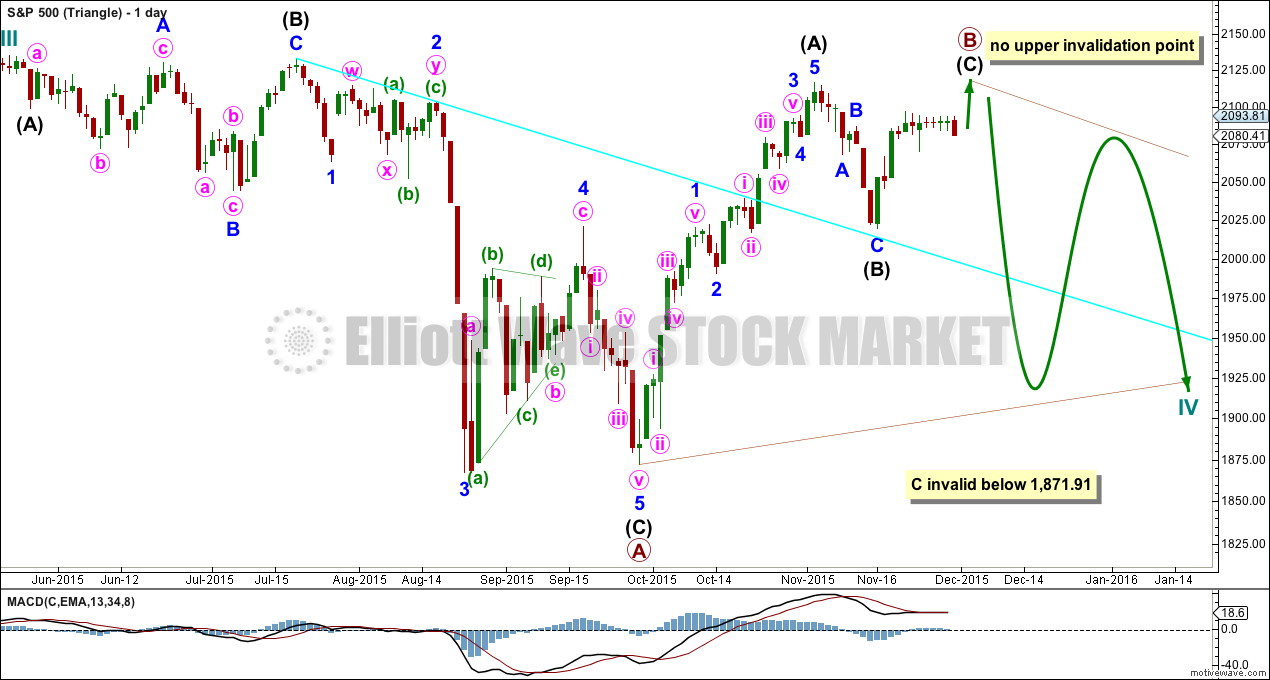
DAILY CHART – TRIANGLE
Cycle wave IV may unfold as a shallow triangle. This would provide alternation with the 0.41 zigzag of cycle wave II.
Primary wave B may be unfolding as a zigzag. Primary wave B may make a new high above the start of primary wave A at 2,134.72 as in a running triangle. There is no upper invalidation point for this wave count for that reason.
The whole structure moves sideways in an ever decreasing range. The purpose of triangles is to take up time and move price sideways. A possible time expectation for this idea may be a total Fibonacci eight or thirteen months, with thirteen more likely. So far cycle wave IV has lasted six months.
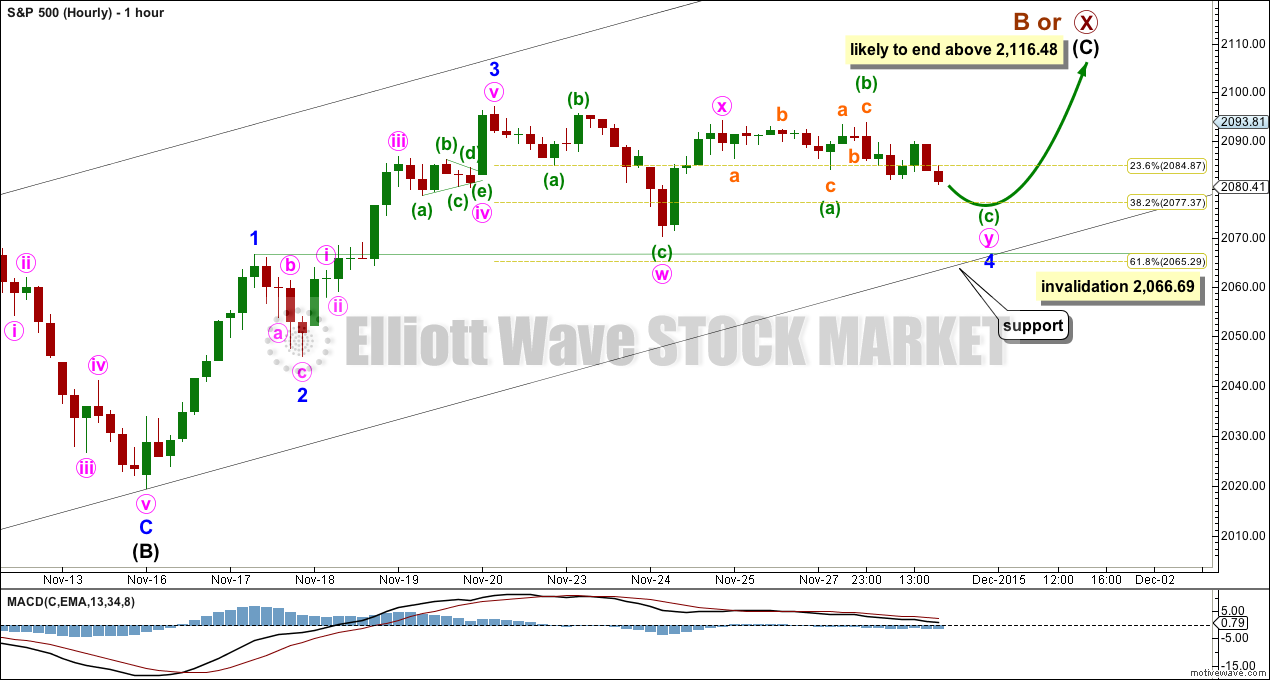
HOURLY CHART
Today the hourly charts are different. Both ideas presented work in exactly the same way for the bull and bear wave counts, and both see a fourth wave correction continuing sideways.
This first idea I consider slightly less likely than the second idea presented for the hourly bear wave count.
Minor wave 4 may be continuing sideways as a double combination. This would provide structural alternation with the zigzag of minor wave 2.
Minor wave 2 was relatively shallow at 0.44 the depth of minor wave 1. At its end, minor wave 4 may have little alternation in depth. Alternation is a guideline, not a rule. As long as there is some alternation, that is enough.
The first structure in the double would be a completed zigzag labelled minute wave w. The double is joined by a three, a zigzag in the opposite direction labelled minute wave x. The second structure in the double is a flat correction labelled minute wave y.
Both the A and B waves subdivide as threes within minute wave y. Minuette wave (b) is a 0.97 depth of minuette wave (a) meeting the minimum requirement of 0.9 for a B wave within a flat correction.
At 2,078 minuette wave (c) would reach 1.618 the length of minuette wave (a). This would see minor wave 4 end very close to the 0.382 Fibonacci ratio at 2,077.
It it gets that far, minor wave 4 may find support at the lower edge of the black channel copied over from the daily chart.
Minor wave 5 upwards would most likely be about equal in length with minor wave 1 and be about 47.30 points long.
Minor wave 4 may not move into minor wave 1 price territory below 2,066.69.
ALTERNATE BULL ELLIOTT WAVE COUNT
DAILY CHART
It is possible to see cycle wave IV a completed flat correction. This would provide some structural alternation with the zigzag of cycle wave II.
This is a regular flat but does not have a normal regular flat look. Primary wave C is too long in relation to primary wave A. Primary wave C would be 3.84 short of 4.236 the length of primary wave A. While it is possible to also see cycle wave IV as a complete zigzag (the subdivisions for that idea would be labelled the same as the bear wave count below, daily chart) that would not provide structural alternation with the zigzag of cycle wave II, and so I am not considering it.
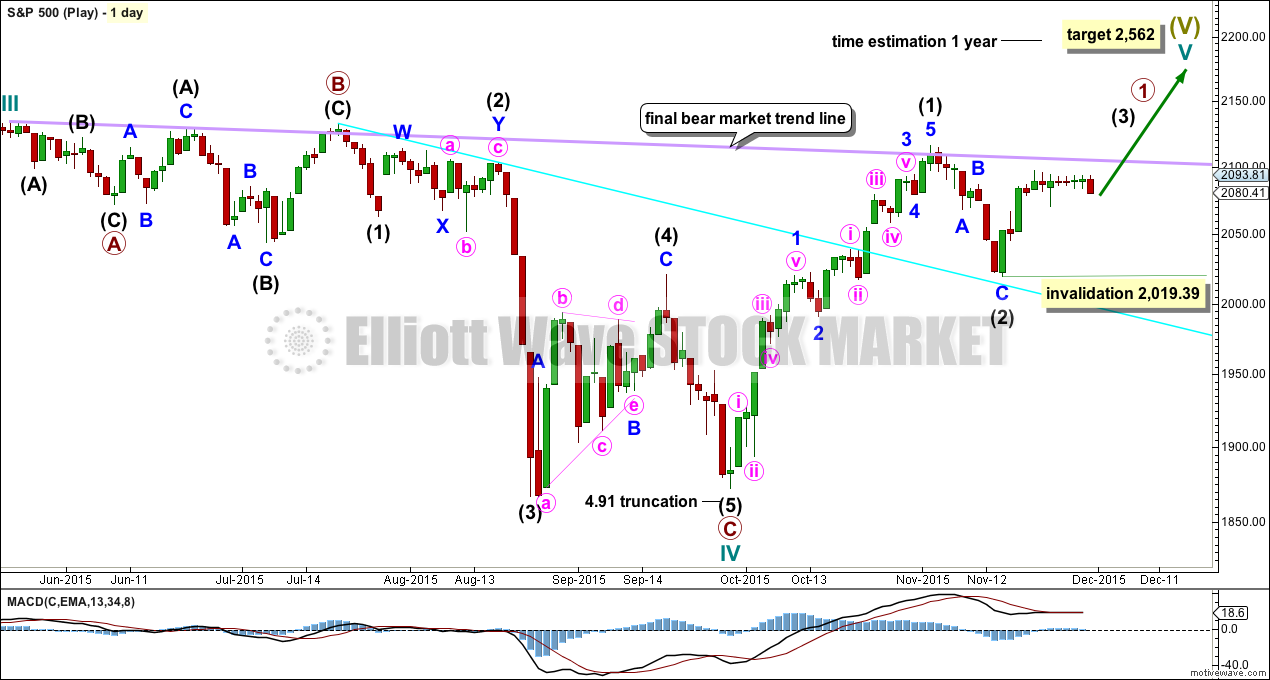
This idea requires not only a new high but that the new high must come with a clear five upwards, not a three.
At 2,562 cycle wave V would reach equality in length with cycle wave I. Cycle wave I was just over one year in duration so cycle wave V should be expected to also reach equality in duration. Cycle degree waves should be expected to last about one to several years, so this expectation is reasonable. It would be extremely unlikely for this idea that cycle wave V was close to completion, because it has not lasted nearly long enough for a cycle degree wave.
I added a bear market trend line drawn using the approach outlined by Magee in “Technical Analysis of Stock Trends”. When this lilac line is clearly breached by upwards movement that shall confirm a trend change from bear to bull. The breach must be by a close of 3% or more of market value. If it comes with a clear five up, then this wave count would be further confirmed.
While price remains below the bear market trend line, we should assume the trend remains the same: downwards.
Intermediate wave (1) is a complete five wave impulse and intermediate wave (2) is a complete three wave zigzag. Subdivisions at the hourly chart level would be the same for this wave count as for the other two wave counts; A-B-C of a zigzag subdivides 5-3-5, exactly the same as 1-2-3 of an impulse.
For this wave count, when the next five up is complete that would be intermediate wave (3). Within intermediate wave (3), no second wave correction may move beyond the start of its first wave below 2,019.39.
This wave count does not have support from regular technical analysis and it has a big problem of structure for Elliott wave analysis. I do not have confidence in this wave count. It is presented as a “what if?” to consider all possibilities.
BEAR ELLIOTT WAVE COUNT
DAILY CHART
This bear wave count has a better fit at Grand Super Cycle degree and is better supported by regular technical analysis at the monthly chart level. But it is a huge call to make, so I present it second, after a more bullish wave count, and until all other options have been eliminated.
There are two ideas presented in this chart: a huge flat correction or a double flat / double combination. The huge flat is more likely. They more commonly have deep B waves than combinations have deep X waves (in my experience).
A huge flat correction would be labelled super cycle (a)-(b)-(c). It now expects a huge super cycle wave (c) to move substantially below the end of (a) at 666.79. C waves can behave like third waves. This idea expects a devastating bear market, and a huge crash to be much bigger than the last two bear markets on the monthly bear chart.
The second idea is a combination which would be labelled super cycle (w)-(x)-(y). The second structure for super cycle wave (y) would be a huge sideways repeat of super cycle wave (a) for a double flat, or a quicker zigzag for a double combination. It is also possible (least likely) that price could drift sideways in big movements for over 10 years for a huge triangle for super cycle wave (y).
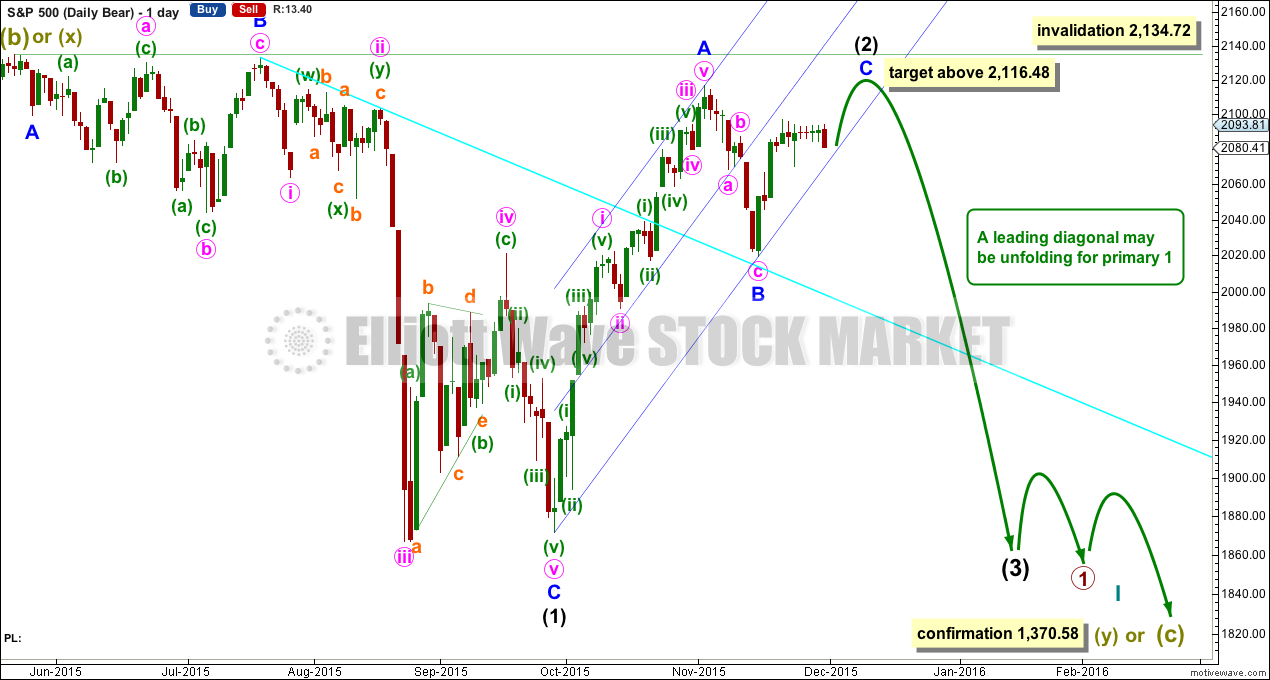
The bear wave count sees a leading diagonal for a primary degree first wave unfolding. Within leading diagonals, the first, third and fifth waves are most commonly zigzags but sometimes may appear to be impulses. Here intermediate wave (1) is seen as a complete zigzag.
Intermediate wave (2) is an incomplete zigzag within the leading diagonal. It may not move beyond the start of intermediate wave (1) above 2,134.72. This wave count expects minor wave C to end midway within its channel, above the end of minor wave A at 2,116.48 but not above 2,134.72.
HOURLY CHART
Because I favour the bear wave count (because it is better supported by regular technical analysis and Elliott wave analysis at the monthly chart level), I will present the favoured idea for this fourth wave correction for the bear hourly wave count.
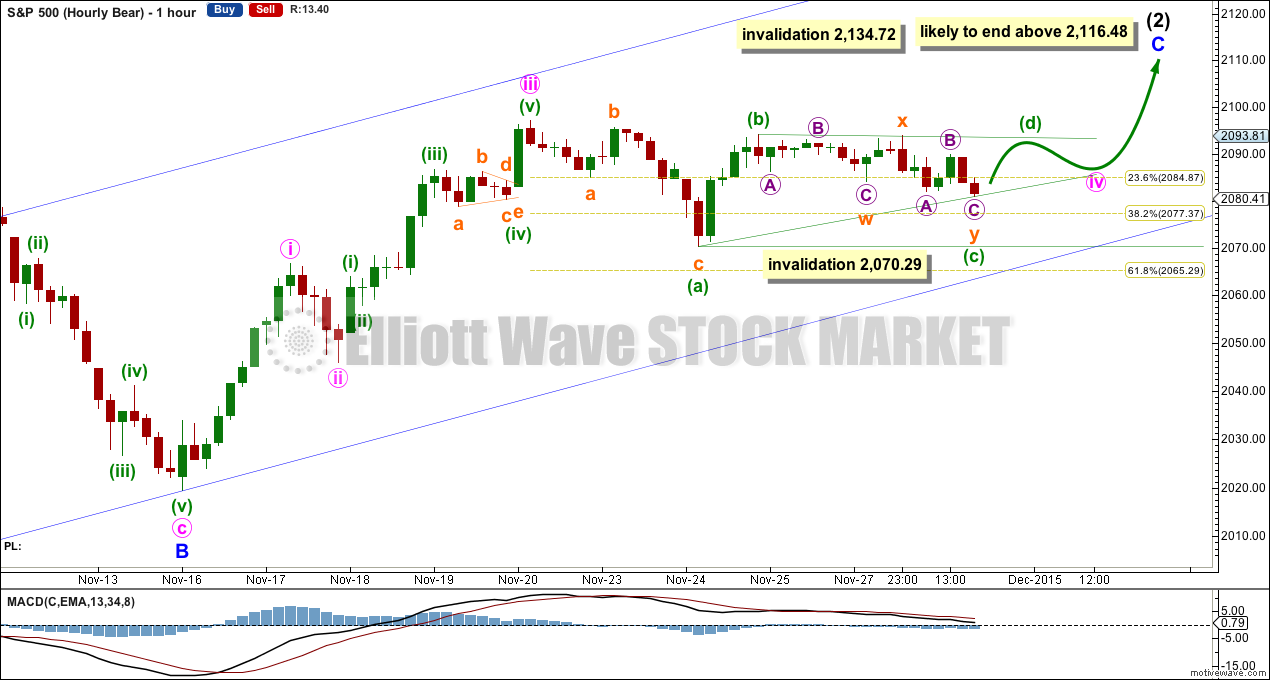
At this stage, sideways movement fits as an incomplete regular contracting or barrier triangle. This is supported by MACD being flat and hovering close to the zero line.
Within the triangle, minuette wave (c) may be either complete at Monday’s low or close to completion. It may not move beyond the end of minuette wave (a) below 2,070.29.
A zigzag upwards for minuette wave (d) may not move above the end of minuette wave (b) at 2,094.12 for a contracting triangle when minuette wave (c) is done. For a barrier triangle minuette wave (d) may end about the same level as minuette wave (b), as long as the (b)-(d) trend line remains essentially flat. What this means in practice is that minuette wave (d) may end slightly above 2,094.12 and the triangle would remain valid. This is the only Elliott wave rule which is not black and white.
The following and final wave of the triangle for minuette wave (e) should be a zigzag which may not move beyond the end of minuette wave (c).
The whole thing moves sideways in an ever decreasing range. It may see minute wave iv end close to the 0.236 Fibonacci ratio of minute wave iii at 2,085, which would provide better alternation in depth with the still shallow zigzag of minute wave ii. A triangle would provide perfect alternation with the zigzag.
This idea expects more sideways movement for another one to three days possibly. Minor wave C may end in fourteen days, one longer than a Fibonacci thirteen. Triangles are time consuming. Their purpose is to take up time, move price sideways, and test our patience.
TECHNICAL ANALYSIS
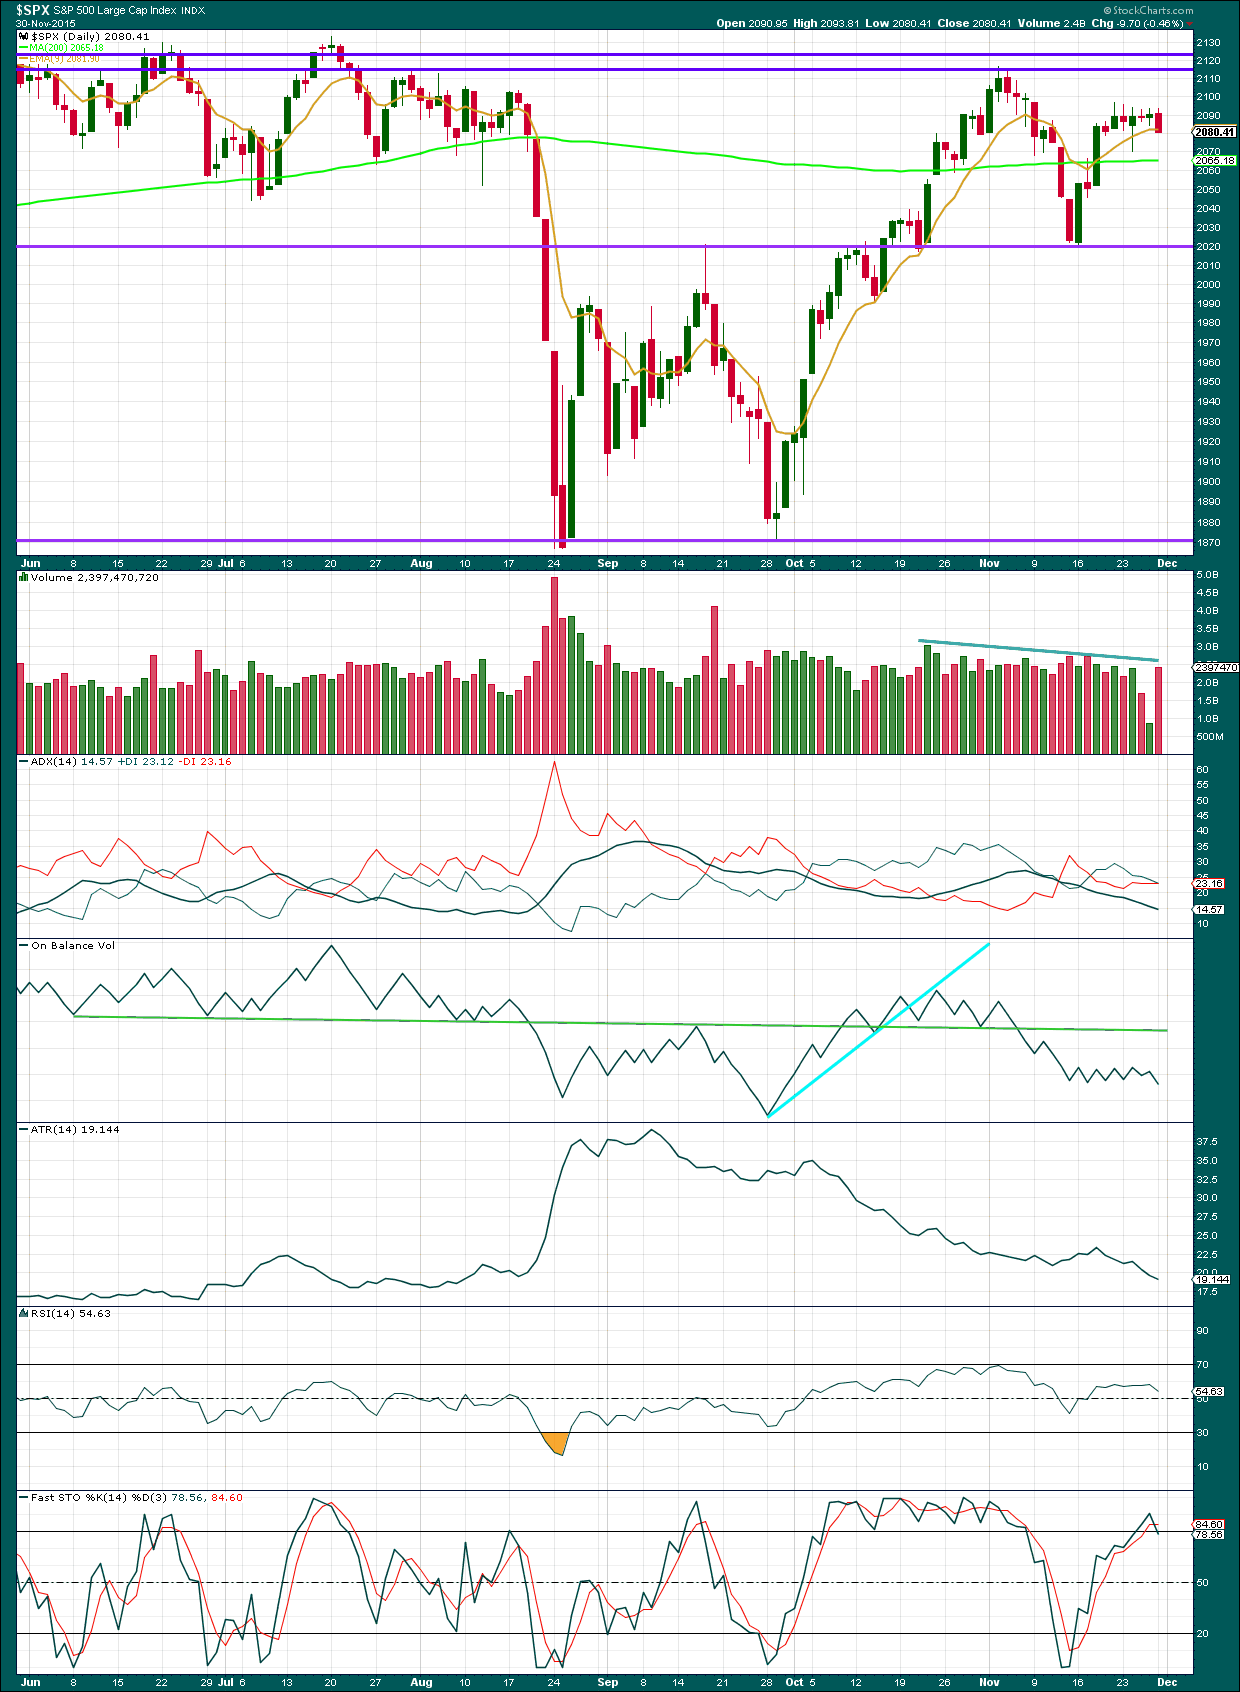
Click chart to enlarge. Chart courtesy of StockCharts.com.
Daily: A sharp increase in volume for Monday’s red candlestick supports downwards movement, but volume is still light though. Overall, price is moving sideways and volume is declining to light. This supports the Elliott wave count which expects that currently a correction is unfolding.
ADX still indicates the market is not trending but consolidating. A range bound trading approach would expect some more upwards movement from here to not end until price finds resistance at one of the two upper horizontal trend lines and Stochastics is overbought at the same time.
A note on Dow Theory: for the bear wave count I would wait for Dow Theory to confirm a huge market crash. So far the industrials and the transportation indices have made new major swing lows, but the S&P500 and Nasdaq have not.
S&P500: 1,820.66
Nasdaq: 4,116.60
DJT: 7,700.49 – this price point was breached.
DJIA: 15,855.12 – this price point was breached.
To the upside, for Dow Theory, I am watching each index carefully. If any make new all time highs, that will be noted. If they all make new all time highs, then a continuation of a bull market would be confirmed. So far none have made new all time highs.
This analysis is published about 07:49 p.m. EST.

vernecarty
Have a good rest of the day matey. This should be a strong RUN 2-3 days. BULLISH!
Oh goodness, this is a really difficult piece of movement to analyse.
As I’m working on it this morning, just to keep members updated, these are my thoughts.
1. The triangle could still be continuing, but today’s high would be only wave B of it and so it needs another couple of days to complete. That’s looking too big now.
2. The combination could be over at today’s low. Minuette (c) of minute y will subdivide as an ending contracting diagonal which looks pretty good (the trend lines are a neat fit) on the five minute chart. This means the sharp upwards move today could be the start of minor 5.
The second idea looks better in terms of proportion. But I’ll chart and continue to follow the first idea. Another new high above today’s high at 2,098.80 would make a possible triangle look just too wrong.
Unfortunately this is the only EW rule which is grey. It’s the B-D trend line of a barrier triangle rule, it needs to be “essentially flat”. If today’s high is wave B of a triangle then D can move slightly above it.
Most annoying I know. I’m expecting that what is most likely now is that the fourth wave correction is over and this upwards move is the start of the fifth wave.
The last idea to consider is the structure of the fifth wave, especially if it began earlier as I had it previously labelled. What if it is an ending diagonal?
It’s extremely unusual, such a very low probability, for a fifth wave ending diagonal to be truncated and so if this is an ending diagonal unfolding it needs to end above 2,116. It looks like it would be contracting, and may not be able to reach up as far as 2,116. So that idea isn’t looking good.
I’m off to consider all possibilities. This may take some time.
Either way, sideways movement and then upwards movement. I don’t expect too much downwards movement and the final lower invalidation point for these ideas will most likely all be at 2,070.29. If that is breached then it may be all over. I just can’t see minor 4 continuing further and breaking below that point at this stage.
Any possibility the spike up this morning was a third wave and the long meandering movement the rest of the day was wave four, with the spike at market close being the fifth wave up?
No, because the fourth wave includes part which would be back in first wave price territory.
No part of a fourth wave may enter any part of a first wave.
Looks like we have an abc up off the initial low after this morning’s spike. If the bears are in control, we should now take out 2086.77 in short order in a third wave down…
i am neutral no action.
I’m closing the screens bye…
one last thing – they tried twice to sell this market and it failed. So, I am going to look more into that price action to understand more that means bullish to me…
vernecarty,
Despite the fast sell off early this morning – I am just not quite sure how one can be bearish?
1. 2098
2. 2095
3. 2096
?
vernecarty
your views now on spx?
I still think we are going a bit higher. The move out of the triangle must have been a head-fake as it looks to me like the triangle is not done yet.
One thing I have learn from following Lara’s analysis is to pay extremely close attention to her invalidation points. Until they are clearly and convincingly breached, it is worth it to wait for confirmation. I think we are in for more sideways meandering in the short term. What worries me is that the next move is going to be too sudden to get in position to profit so it’s a bit frustrating knowing what to do in the short term. I am sitting tight and out of most of my short term bets.
bulls run this market – nothing has changed. 6 years and they still are in control until we drop hard…
First sign of trouble will be breach of 2086.77. Upward move could be developing as an abc…bulls need to take out 2098.8 with five up…
bullish
wait do they need to take that out today? or tomorrow 2098?
Lara,
What do you make of the triangle thrust and retrace today so far?
Lara sometimes very graciously chooses to make commentary on intra-day action but she has reminded us that it really is not a day trading service. I think we should respect her time and not solicit intra-day analysis in my humble opinion. We don’t want to wear out our welcome now do we? 😀
vernecarty
i usually post so when she gets a chance the question is ready for inquiry. Not looking for spot on resolution matey…
Fair enough matey!
vernecarty
I also am still learning so part of it is always asking questions. Thanks!
Lara,
How does the wave count look this morning?
Is 2118 out of the cards now?
I don’t think any invalidation points have been violated so all the wave counts remain valid options2014
We are now either in a third wave up, or beginning a third wave down. Either way, today’s low or today’s high is going to fall, UNLESS the triangle is continuing from Lara’s count, in which case the sideways move continues in a smaller and smaller range…
k
ES 60 min chart
Black line is the weekly pivot
Is that your target move lower then to higher prices?
MARKET RIPPING HIGHER…
I follow all 4 US indices – DOW IS LEADING.
S&P AND NASDAQ AND RUSSELL LAGGING….
vernecarty,
Based on the price action now in ES futures +12. Given that you are bearish – is it a lower probability now that we will tag 2070 before moving higher?
My expectation was that a thrust from the triangle was in order and “that is exactly what we’ve got”, to quote Lara. I now suspect that this move will last a few days with brief small wave second and fourth wave corrections prior to a new recovery high somewhere in the area of 2112.00 I plan on closing half my long positions at the market’s close today. All going according to plan…..so far….UVXY will probably hit my buy point today or tomorrow with new a 52 week low…
Excellent strategy.
WOW WHAT A QUICK SELL OFF. WOW PUSH IT BACK UP…
Hard to say if it is a deep second wave or we have a truncated fifth. It looks very bearish to me I am afriad…(for the bulls of course). If we get a red candle today they are done…the spike this morning was sold with an unusual amount of gusto…more than we have seen in a while…SPX MUST clear 2010 in the next hour or just forget about any more highs…
I meant 2100…if we take out this morning’s highs we should be off to the races….
i agree – let us wait 1 more hour..
DAX is holding everything down. Europe closes and higher US prices….
That was just the ALGOs on the ISM. Slight blip. Should resume higher…
vernecarty,
And the countdown begins to the END of the most maniac EPIC BULL MARKETs EVER…..
DICIPLINE MATEY….
The one thing that the bulls CANNOT have happen to day is for the market to print a red candle. If the market starts to fade this advance towards the close…well…I don’t need to state the obvious…
p.s. The thrust up was a complete five with a a very short fifth wave…this thing could be over real fast…
Just look at that hourly candle. It is HUGE!
It sure is. The movements out of triangles either keep blasting higher for a while to complete the final wave, or they immediately turn around, usually intra-day and head for the nether regions…we’ll see…key will be market close. Transports already rolling over so they also bear (no pun intended!) watching I think…
Folks…this is NOT looking good…let the buyer beware…I am out…
It is going higher. No worries… imho
I’m off till the close..
I think its smart to stay on the sidelines. With Draghi jawboning tomorrow one would have at least expected a pop into his statement. Is it possible that so many people are now figuring out the buy the rumour sell the news that sellers are jumping the gun? A big move is coming and it is still not clear which direction. I am happy to observe for now…things are waaaay to dicey in my opinion, to trade safely right now.
The move down from the highs this morning does look like a three though (so far!) so maybe we still have more upside…
Case closed as I expected. Bullish and now I am open to 2129….
vernecarty,
price action bad but to early to be bearish….
I agree. Market direction has not been established and the wave count does call for upward movement. I think the 2070 area is still key and will have to be breached for me to be convinced a new downtrend has arrived. Action today is mostly sideways so I think it is corrective and we have some more upside.
Superb analysis. The triangle explains a lot, and provides the perfect scenario for the final upward thrust.
ES Futures keep on going up…
+.75 more
Thanks Lara…