
Upwards movement was expected.
A small range day moved price a little lower. This still fits the wave count.
Summary: The trend is still down, but a bear market rally continues and is not done yet. It may end at the end of this week or very early next week. A new high above 2,116 is expected. The target for this rally to end is now at 2,129. Thereafter, the downwards trend should resume in force. This bear market rally is extremely unlikely to make a new all time high. It is expected to stop before 2,134.72.
To see how each of the bull and bear wave counts fit within a larger time frame see the Grand Supercycle Analysis.
To see last analysis of weekly and monthly charts click here.
If I was asked to pick a winner (which I am reluctant to do) I would say the bear wave count has a higher probability. It is better supported by regular technical analysis at the monthly chart level, it fits the Grand Supercycle analysis better, and it has overall the “right look”.
New updates to this analysis are in bold.
BULL ELLIOTT WAVE COUNT
DAILY CHART – COMBINATION OR FLAT
Click chart to enlarge.
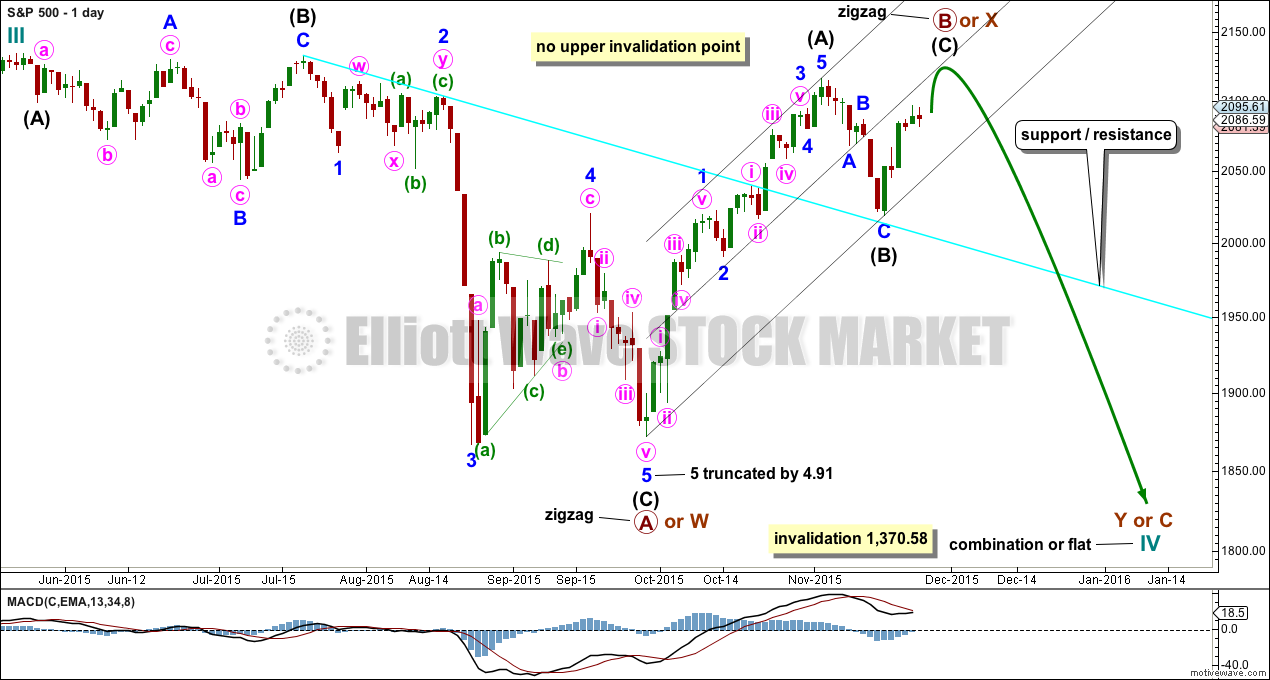
Cycle wave IV should exhibit alternation to cycle wave II.
Cycle wave II was a shallow 0.41 zigzag lasting three months. Cycle wave IV should exhibit alternation in structure and maybe also alternation in depth. Cycle wave IV may end when price comes to touch the lower edge of the teal channel which is drawn about super cycle wave V using Elliott’s technique (see this channel on weekly and monthly charts).
Cycle wave IV may end within the price range of the fourth wave of one lesser degree. Because of the good Fibonacci ratio for primary wave 3 and the perfect subdivisions within it, I am confident that primary wave 4 has its range from 1,730 to 1,647.
If a zigzag is complete at the last major low as labelled, then cycle wave IV may be unfolding as a flat, combination or triangle.
Primary wave B or X is an incomplete zigzag unfolding upwards. If cycle wave IV is an expanded flat correction, then primary wave B may make a new high above the start of primary wave A at 2,134.72. If cycle wave IV is a combination, then primary wave X may make a new high above the start of primary wave W. There is no upper invalidation point for these reasons.
Primary wave A or W lasted three months. When it arrives primary wave Y or C may be expected to also last about three months.
Intermediate waves (A) and (B) together lasted a Fibonacci 34 days within primary wave B or X. Intermediate wave (C) may complete in a total Fibonacci eight days which would see it continue for a further three days now.
DAILY CHART – TRIANGLE
Click chart to enlarge.
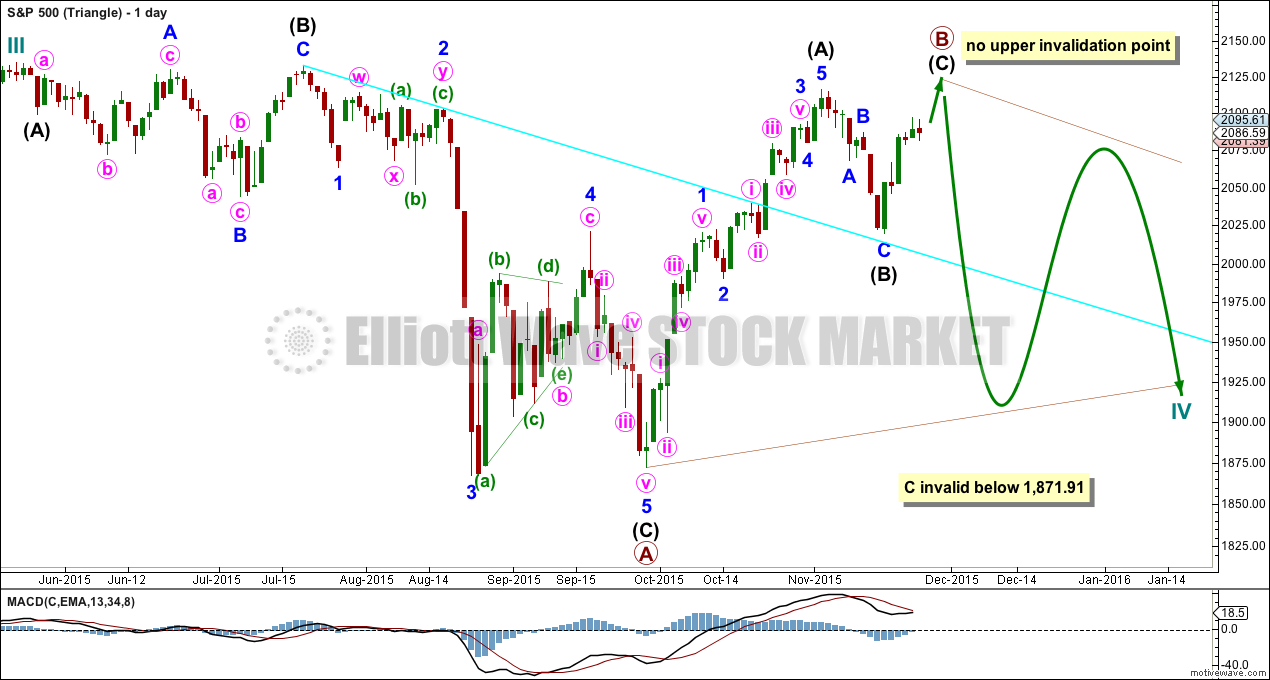
Cycle wave IV may unfold as a shallow triangle. This would provide alternation with the 0.41 zigzag of cycle wave II.
Primary wave B may be unfolding as a zigzag. Primary wave B may make a new high above the start of primary wave A at 2,134.72 as in a running triangle. There is no upper invalidation point for this wave count for that reason.
The whole structure moves sideways in an ever decreasing range. The purpose of triangles is to take up time and move price sideways. A possible time expectation for this idea may be a total Fibonacci eight or thirteen months, with thirteen more likely. So far cycle wave IV has lasted six months.
HOURLY CHART
Click chart to enlarge.
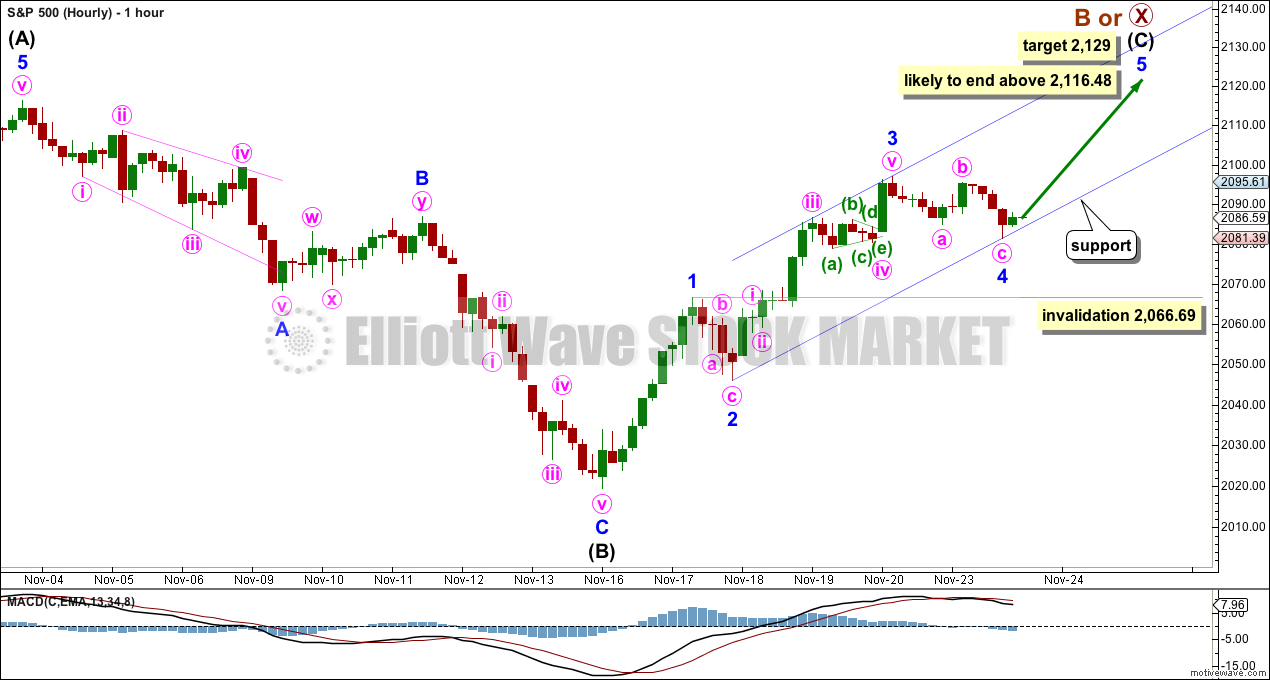
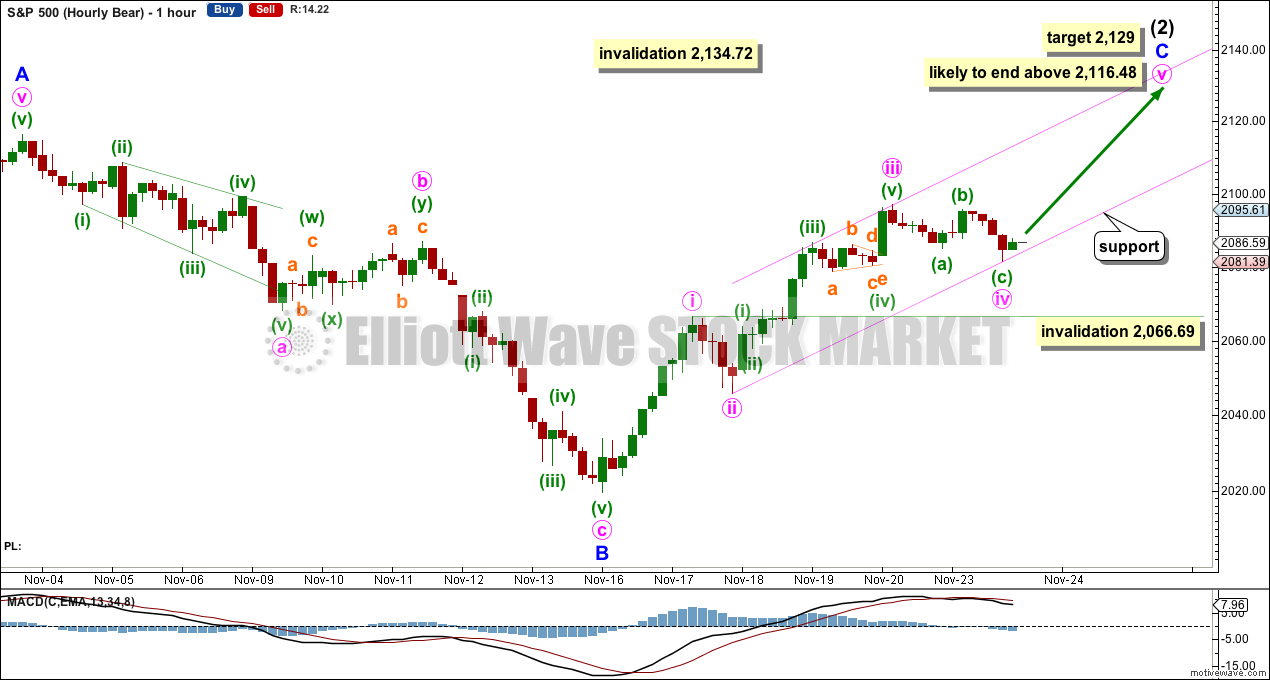
Today both hourly wave counts will be the same. This now looks like the best way to label this upwards movement.
There is no Fibonacci ratio between minor waves 1 and 3. This makes it more likely that minor wave 5 shall exhibit a Fibonacci ratio to either of minor waves 1 or 3. The most common ratio for a fifth wave is equality in length with the first wave, which would be achieved at 2,129. If minor wave 4 continues any lower, then the target must be moved correspondingly lower.
Minor wave 4 may not move into minor wave 1 price territory below 2,066.69.
Minor wave 4 was not contained within the channel which was drawn using Elliott’s first technique. Redraw the channel using Elliott’s second technique: the first trend line from the ends of the second to fourth waves, then a parallel copy on the end of the third wave. If minor wave 4 continues any lower, redraw the channel. Minor wave 5 may end either mid way within the channel or at the upper edge.
Intermediate wave (C) is extremely likely to make at least a slight new high above 2,116.48 to avoid a truncation.
ALTERNATE BULL ELLIOTT WAVE COUNT
DAILY CHART
Click chart to enlarge.
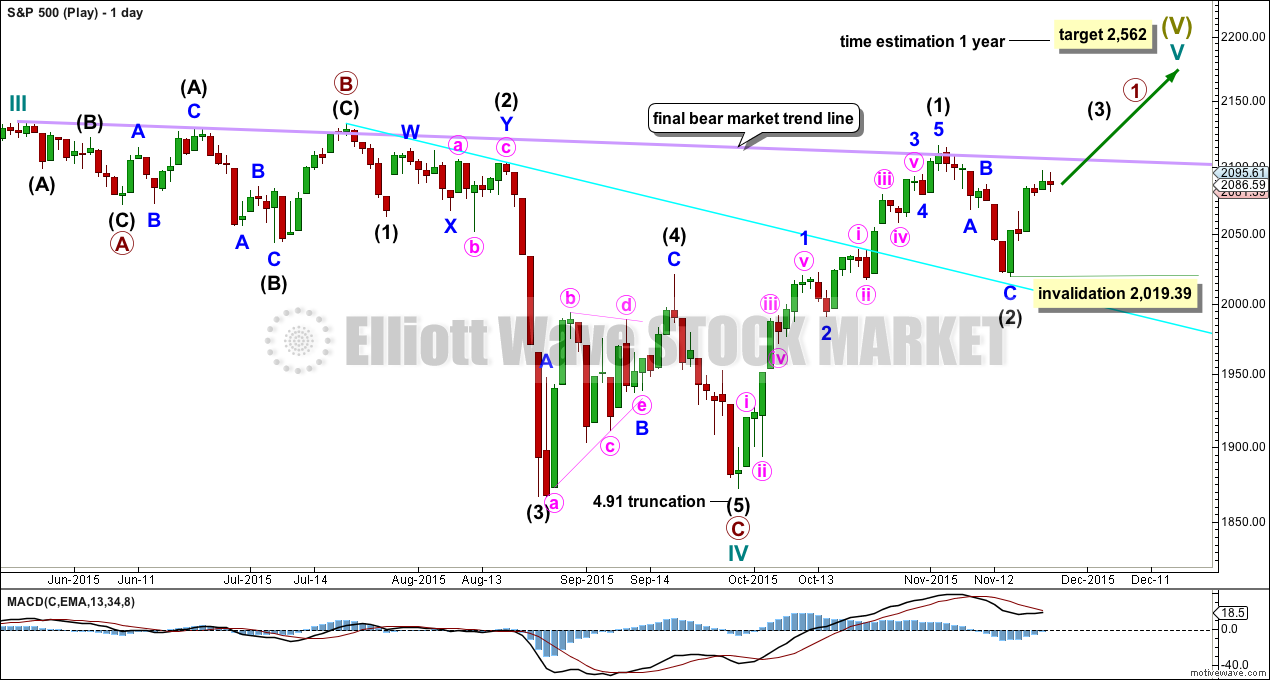
It is possible to see cycle wave IV a completed flat correction. This would provide some structural alternation with the zigzag of cycle wave II.
This is a regular flat but does not have a normal regular flat look. Primary wave C is too long in relation to primary wave A. Primary wave C would be 3.84 short of 4.236 the length of primary wave A. While it is possible to also see cycle wave IV as a complete zigzag (the subdivisions for that idea would be labelled the same as the bear wave count below, daily chart) that would not provide structural alternation with the zigzag of cycle wave II, and so I am not considering it.
This idea requires not only a new high but that the new high must come with a clear five upwards, not a three.
At 2,562 cycle wave V would reach equality in length with cycle wave I. Cycle wave I was just over one year in duration so cycle wave V should be expected to also reach equality in duration. Cycle degree waves should be expected to last about one to several years, so this expectation is reasonable. It would be extremely unlikely for this idea that cycle wave V was close to completion, because it has not lasted nearly long enough for a cycle degree wave.
I added a bear market trend line drawn using the approach outlined by Magee in “Technical Analysis of Stock Trends”. When this lilac line is clearly breached by upwards movement that shall confirm a trend change from bear to bull. The breach must be by a close of 3% or more of market value. If it comes with a clear five up, then this wave count would be further confirmed.
While price remains below the bear market trend line, we should assume the trend remains the same: downwards.
Intermediate wave (1) is a complete five wave impulse and intermediate wave (2) is a complete three wave zigzag. Subdivisions at the hourly chart level would be the same for this wave count as for the other two wave counts; A-B-C of a zigzag subdivides 5-3-5, exactly the same as 1-2-3 of an impulse.
For this wave count, when the next five up is complete that would be intermediate wave (3). Within intermediate wave (3), no second wave correction may move beyond the start of its first wave below 2,019.39.
This wave count does not have support from regular technical analysis and it has a big problem of structure for Elliott wave analysis. I do not have confidence in this wave count. It is presented as a “what if?” to consider all possibilities.
BEAR ELLIOTT WAVE COUNT
DAILY CHART
Click chart to enlarge.
This bear wave count has a better fit at Grand Super Cycle degree and is better supported by regular technical analysis at the monthly chart level. But it is a huge call to make, so I present it second, after a more bullish wave count, and until all other options have been eliminated.
There are two ideas presented in this chart: a huge flat correction or a double flat / double combination. The huge flat is more likely. They more commonly have deep B waves than combinations have deep X waves (in my experience).
A huge flat correction would be labelled super cycle (a)-(b)-(c). It now expects a huge super cycle wave (c) to move substantially below the end of (a) at 666.79. C waves can behave like third waves. This idea expects a devastating bear market, and a huge crash to be much bigger than the last two bear markets on the monthly bear chart.
The second idea is a combination which would be labelled super cycle (w)-(x)-(y). The second structure for super cycle wave (y) would be a huge sideways repeat of super cycle wave (a) for a double flat, or a quicker zigzag for a double combination. It is also possible (least likely) that price could drift sideways in big movements for over 10 years for a huge triangle for super cycle wave (y).
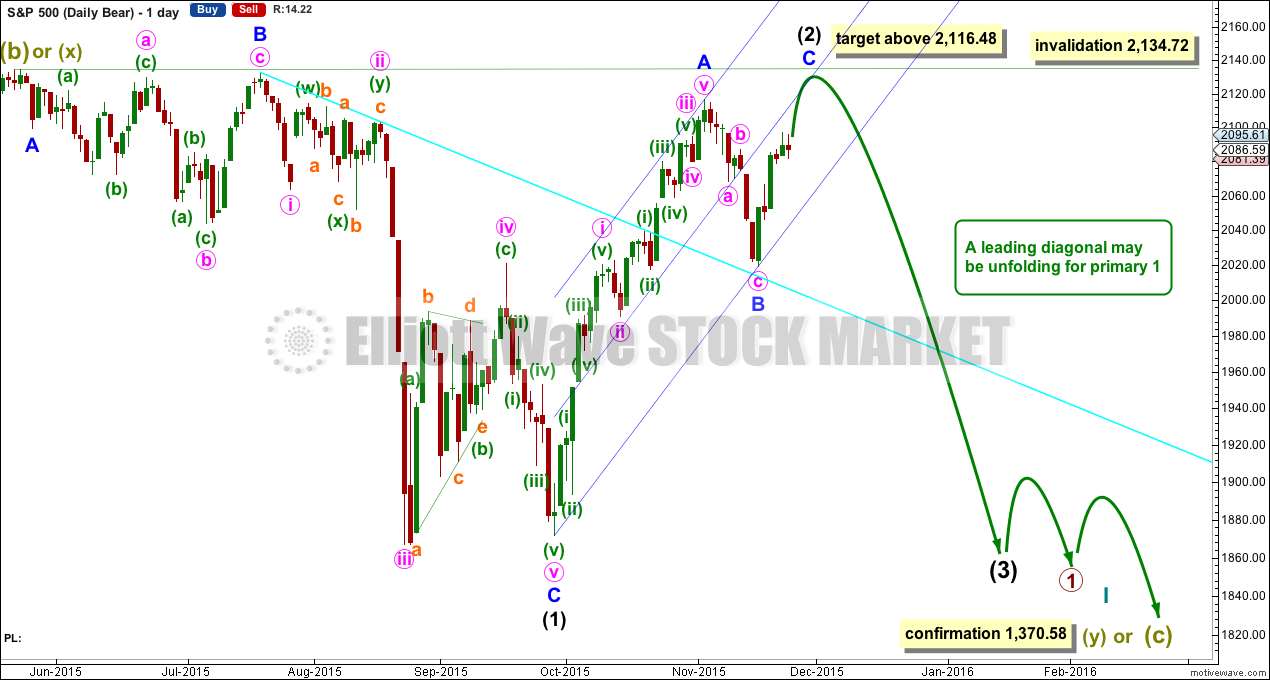
The bear wave count sees a leading diagonal for a primary degree first wave unfolding. Within leading diagonals, the first, third and fifth waves are most commonly zigzags but sometimes may appear to be impulses. Here intermediate wave (1) is seen as a complete zigzag.
Intermediate wave (2) is an incomplete zigzag within the leading diagonal. It may not move beyond the start of intermediate wave (1) above 2,134.72. This wave count expects minor wave C to end midway within its channel, above the end of minor wave A at 2,116.48 but not above 2,134.72.
HOURLY CHART
Click chart to enlarge.
This hourly wave count is now the same as the first, except for the degree of labelling.
TECHNICAL ANALYSIS
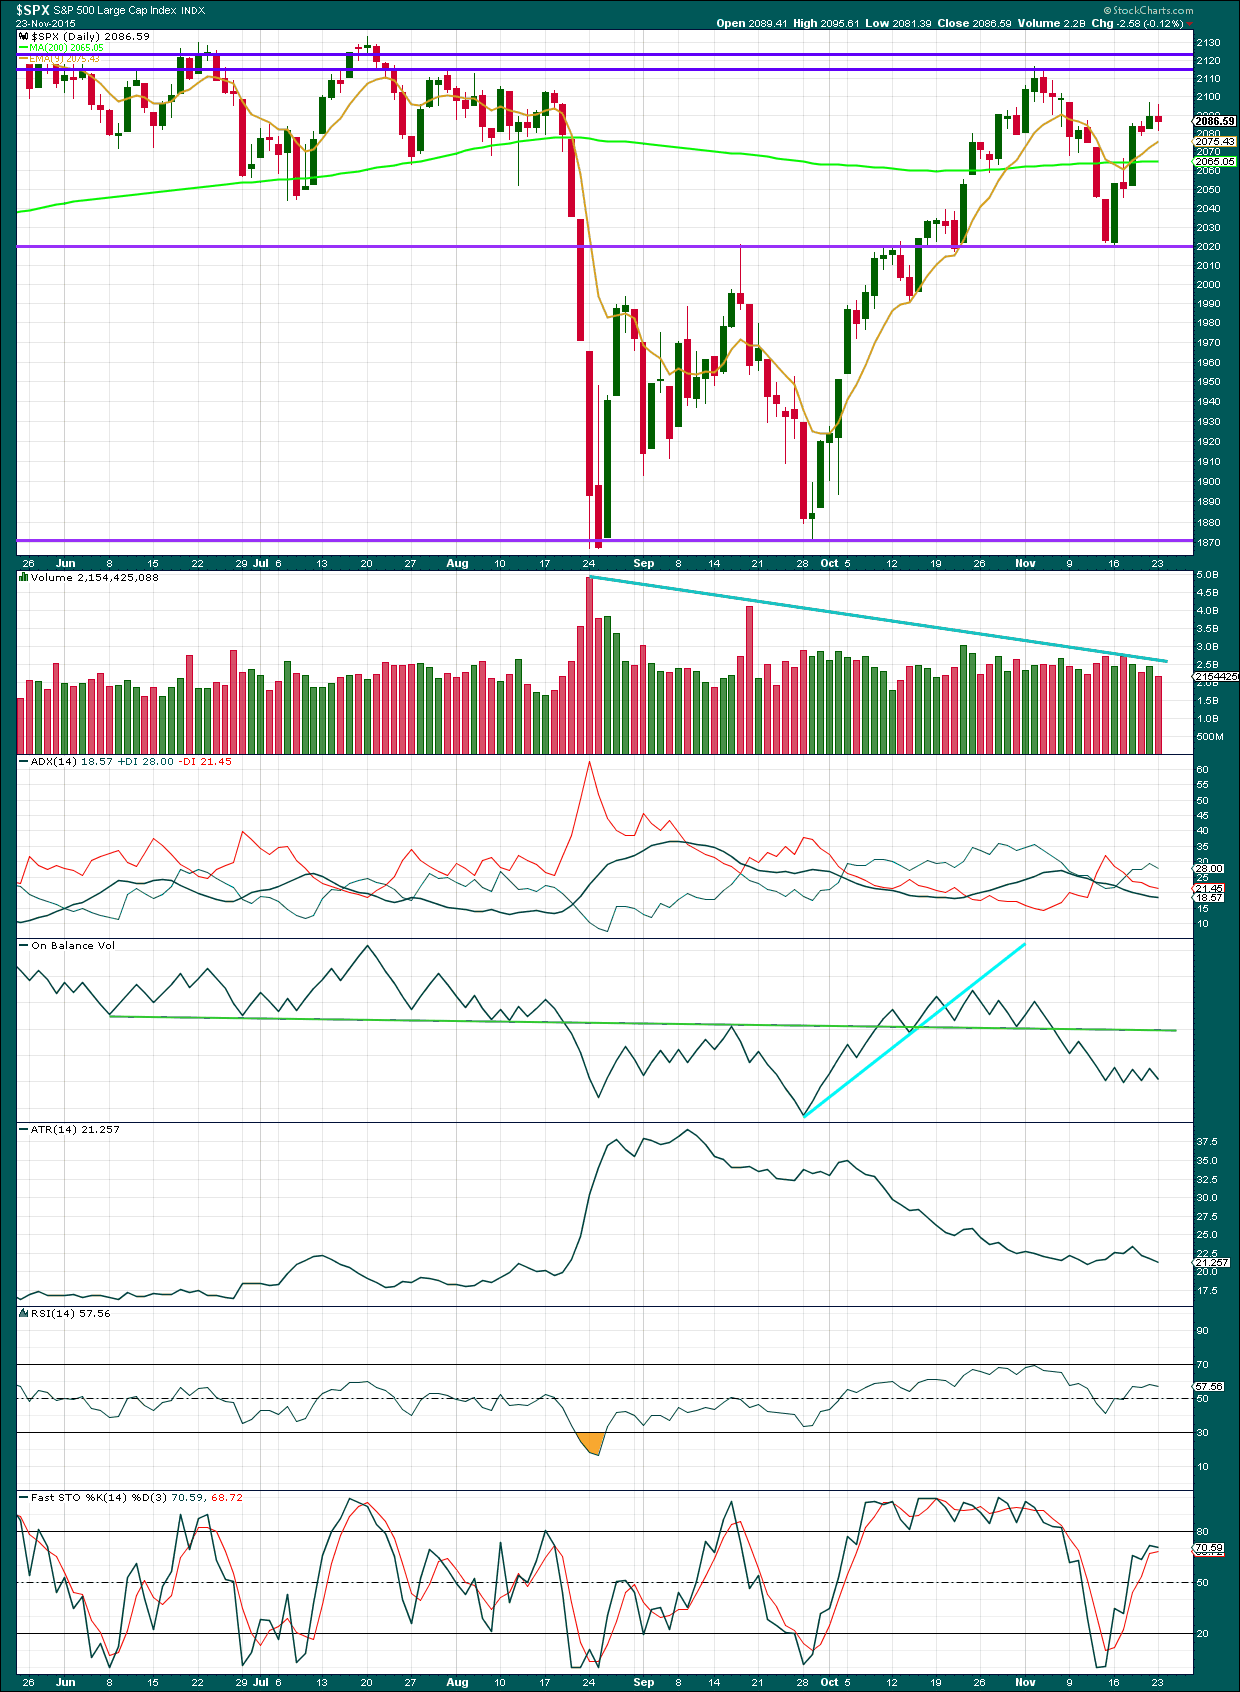
Click chart to enlarge. Chart courtesy of StockCharts.com.
Daily: ADX is still declining. No trend is yet indicated. Volume continues to decline as price moves higher. This rise in price is not supported by volume, so is suspicious.
ATR remains low and flat. This is not typical of a trend which indicates the market is more likely consolidating or correcting than trending.
More upwards movement would be expected to continue until price reaches one or the other of the upper horizontal lines of resistance and Stochastics reaches overbought at the same time.
A note on Dow Theory: for the bear wave count I would wait for Dow Theory to confirm a huge market crash. So far the industrials and the transportation indices have made new major swing lows, but the S&P500 and Nasdaq have not.
S&P500: 1,820.66
Nasdaq: 4,116.60
DJT: 7,700.49 – this price point was breached.
DJIA: 15,855.12 – this price point was breached.
To the upside, for Dow Theory, I am watching each index carefully. If any make new all time highs, that will be noted. If they all make new all time highs, then a continuation of a bull market would be confirmed. So far none have made new all time highs.
This analysis is published about 10:13 p.m. EST.
hi
all
one last thing – don’t be a bear when you should be a bull and vice versa. This market will rip apart all bears in a heart beat and favors bulls.
BULLISH!
hi
all
o.k I am tired now..Till tomorrow
cheers!
laters
-options2014
vernecarty
What a day…. Very exciting to be a PERMABULL 🙂
Small degree second wave taking its sweet old time. Looks like it wants to leave us hanging today and rip the faces off any remaining shorts with a spike in overnight futures and a manic run into the holiday week-end tomorrow…GASP!! …what if it does the exact opposite??!!! just kidding….
Vernecarty
Here is the way I look at things now on the SPX, I like to write it down to remind myself.
a. hit 2097 and fail 1. 2070 2.2058 3.2019 4.1964 5.1800ish
b. hit 2116+ and fail then retrace 1. 2070 2.2058 3.2019 4.1964 5.1800ish
c. surpass 2116 then we are heading near 2134(maybe just maybe something higher) and then down we go hard 1. 2070 2.2058 3.2019 4.1964 5.1800ish
Only 3 such plays in this game left in the cards with the time left this year into q1 16….
your bear views?
we are on the same team so we can add tons of value to other members on this site. Seems like we are engaging more in the day to day trenches of this difficult market and posting the most feedback…
thanks mateyy.
It would seem that as long as 2070.29 ( today’s lows) holds, we should continue to expect upwards movement. I guess the current re-tracement could move lower and that would be in keeping with the SPX’s tendency to form rounding tops. Ideally, I would like to see strong movement up tomorrow, with a pull back and final high this Friday. If it pops tomorrow, I plan on cashing out and watching the final run from the sidelines.
vernecarty,
Nice -we got 1-3% to go – they could stall this for 2-4 days – maybe 1-2 weeks(grinding sideways and higher slowly) and keep us all hanging around(Maybe a short term range of sorts(2116-2080 ping pong game) and then the NEW month starts and December first few days are really bullish and BOOM we hit those highs and then sell off to about the last week on Christmas(maybe bounce 40 SPX points from the levels maybe 61.8 fib retrace is my guess ) and close December with a DOJI on the monthly… Perfect setup to dump the market in 2016….
vernecarty,
Don’t get me wrong I saw the pain trade today – Basically “nothing to see here” – great clip from zero:
https://www.youtube.com/watch?v=rSjK2Oqrgic
vernecarty,
Come on mate you got to ride this market to it’s very end – it is a CHANCE of lifetime. No need to watch from the sidelines. It should be excellent – something you will enjoy…
Have conviction on the LAST SWING mate – trade with confidence….
laters….
hi
all
nasdaq is the better short since it will drop the most – just saying…
i say oh 4816 ish is a good spot imho
Even better, short the high beta, bloated names in the index. When they pop is going to be somethin’…
EXACTLY…. For example just as reference it tanked -17% as compared to the spx at ~12% this last august.
BULLISH!
I am now fairly confident we are going to see a re-test of the 52 week lows of 24.34 on UVXY…y’all know what to do… 🙂
Looks like it’s getting ready for the pop higher with this re-tracement. The final move up may end swiftly. I am out the nano-second it clears 211 on the Spyder ETF….
bullish
vernecarty
relax no need to rush mate …
You know what they say about exiting long-in-the-tooth bull markets…”Don’t let the door hit ya’, where the good Lord split ya’! ” 🙂
vernecarty
i like adventure.. I am a thrill seeker..
I can tell… Mr. “Swing-for-the-fences” 😀
Actually I also used to be a maverick trader with tens of thousands swings in my trading account before I settled down to a more boring (and consistent) approach as I got a bit older (and possibly wiser!) Nothing wrong with going for broke, so long as you mind your stops mate…
Vernecarty,
I don’t gamble or recommend it with high stake positions. I like to call it RISK ADJUSTED CHOICES. I also apply GAME THEORY to markets…
Trade Safe—
options2014
It would appear Mr. Market has decided. Up we go, for one final flight perhaps? Lightly “calling” on this week’s 210 strikes for SPY…
no confirmation i vote 2117++ bullish
Hello
All,
I have been actively engaged in the world equity markets(ASIA,EUROPE,US) on a day to day basis with futures about 60+ hours a week charting. Been through so many countless night with futures and have called major moves. So, I am glad I am on here.
I am also a chess player….
Cheers!
Hi
All,
That is one awesome hammer on the S&P CASH. So it most likely wants a good 1%-3% range run up….
BULLISH 🙂
Testing the channel bottom………………….
John
Great chart but that should get busted to the upside…
John
Most channels should connect on two points outside the candle body and not across for the smaller time frames. I learned that from another analyst. Just saying.
Near the bottom of the chart? Thats more for me seeing what was going on back there
oh ok np
That channel is critical…a failure there (it goes back to 2010 I think…) spells doom for the heifers…er…I mean bulls…. 😀
You can also add a down-trend channel that intersects with the current touch point…
vernecarty
i am bullish till the end… sorry
I like your spirit; sure hope you can hold onto your bullocks matey… 😀
Vernecarty,
what a day – enjoy mateyy.
vernecarty
I like your spirit too. precision calls on the retrace today what was on the open gaps, etc. –
and haha matey..
always have a plan for a flip trade
I’m stoked to be able to let members know that today I found out I passed my level III CMT exam.
No more exams!
Now I’ll complete the process to obtain my CMT. And then you’ll have a qualified geek working for you (as opposed to just a geek 🙂 )
Congrats, Lara!
BRAVO Lara!
Way to go Lara…heartfelt congratulations on your hard work!
Well done Lara and congratulations!
With minute wave iv moving lower the target must also be moved correspondingly lower.
Minute wave iv really should be done now. Redraw the channel. Use the upper edge for possible resistance.
Minute v will reach equality in length with minute i now at 2,117.59. Not such a nervous end to this second wave correction maybe!
Lara
Congrats. I am looking into that as well just for fun.
Lara,
Great math. I think we will take that out and park it 2129. We are in a bubble of bubble so it will end with a reversal candle possibly…
Lara,
The reason I am insisting on a move higher past 2117 now is that usually bull markets tend to over shoot at the end. Just saying but I respect the 2134.72 boundary now….
vernecarty,
My weekend post on the 20th…
vernecarty
My initial speculation was this move last week. I was looking for 2070-2060 before the final run up and i maintain that view. Further, 2129 is know the final target maybe higher near the ATH.. But because of the invalidation of 2134.72 nothing higher..
You could be right. I don’t like this meandering hesitation ahead of what should be a strong move higher after coming off the lows this morning. They say never sell a dull market; in some cases it’s wise not to buy one either…I am waiting to see what develops…it did look like five up off the lows…
vernecarty,
maybe a tricky extended 5th wave higher –
imho i think the reversal today on a confirmation closing basis is a good trade to the upside. A couple days in and out. Cant ask for more….
I can see a nice five up on the five minute chart.
If that was minute iv extending lower then it really should be done now.
Ditto Lara!
Yep, yep, Yep…
Lara,
Can you post that chart with labels please..
Hmmmnnn…not sure is we are seeing a big fat A,B,C head-fake or start of march higher in final wave up. Mr. Market is very cagey and looking for victims…let him make the first move….he will tell us with a bee-line back towards today’s lows or a spurt higher. None of this coy meandering nonsense…
k, I vote higher. I am bullish!
be back later – got to look at price action…
Don’t trust Mr. Market until he actually commits…he is one sneaky little devil you know….I want to see everybody flying green flags or no cigar, thank you berry, berry, much…. 😀
vernecarty
It is the perfect setup I was talking about last week on Friday. The perfect pull back to trap the bears 2070-2060 so they get all excited and then rip this higher the opposite direction. I have seen this playbook for years and most recently this year. It is so predictable. I got some more playbook trades that I think might unfold once we drop. I will post them on here as we move toward the SPX highs….
Big fat bullish spike. Now let’s see if the bulls can clear the last hurdle of 2087.89 to the upside for final confirmation we are going higher…sit tight…
vernecarty
I see a huge BULLISH ENGULFING CANDLE on the 1 hour NDX and DOW. I am sold… AND AWAY WE GO MATE….
ROLL THE DICE WITH ME AND YOU WIN 🙂
haha
Re-tracement of decline underway. Looking to see of we break 2081.31 to the upside for potential all-clear signal.
vernecarty
good call.
vernecarty,
spot on
I AM LONG VERNECARTY!
HAPPY THANKSGIVING WE ARE GOING HIGHER!!!
vernecarty,
Ok, I fold we are going lower…
Stay neutral; if you have any short positions take profits and reload with half you winnings. An upside reversal in NOT out of the question in my humble opinion. The wave four count has not yet been invalidated.
thanks I am neutral now…
vernecarty,
Oil UP 3.5% – BULLISH!
vernecarty,
Small sell off – bear party cancelled. Watch this rip higher mate…
FUTURE PUSHING HIGHER – DOUBLE BOTTOM NOW! TIME TO BUY THE DIP LOL
Vernecarty,
My line of reasoning now – TIME TO BUY THE DIP – for the last run up!
So far fourth wave (or second wave) count still in play. Move down does not look impulsive and on relatively low volume. I remain neutral until market’s close. Flat or a green candle is definitely a bullish bias. A vicious move down at this point is certainly not out of the question so I would be very cautious.
vernecarty
low volume for 3 years we are going LOWER COUNT IT!
No reason to trade today – lets wait for tomorrow bullish day…
ES HR down overnight, broke support , finding support at the 32.8 Fib
That is right. Found support 4 hammers on the 15 min. This is going to ripper to the upside LOL
No idea what will happen…. It will be a surprise
Same goes for the longer term
SPX Weekly : Black trend line still acting as resistance , stochastic trying to turn down MACD still looking bullish
BULLISH IS RIGHT. We have no reason to sell off.
Last week was horrible and the markets popped higher and higher and a small non US jet gets taken down and we should sell off – Not going to happen.
What’s interesting is they are 2 countries fighting Syria so it could be all a mis understanding.
The rumour is now that ISIS was supplying oil to the Turks.
If this is true, it confirms that Erdogan is the snake I have always suspected him to be, albeit a very foolish snake…
While I don’t know what will happen today, let’s look at the larger picture. We have a stock market in a protracted bull run of almost seven years fueled by ZIRP, and consequent wholesale buy-back of stock by an awful lot of companies to fraudulently boost their P.E. ratios, and even more ridiculously pay shareholder dividends. We have all known that despite its persistence and duration, the relentless rise we have seen in the market has come on unusually low volume and weak fundamentals. While most bearish folk have suffered a lot of pain trying to short this crazy market, to be eternally bullish based on what we know is absolutely insane. I was expecting the first shot to come from an imploding bond market as interest rates charged higher but instead it has come from a Turkish anti-aircraft missile. As I said I don’t know what is going to happen over the next few days but I have always suspected that when the market finally starts to tank it is going to happen faster and more violently than most folk think. Until further notice, I am closing all bullish positions at the open. I will take a small loss on the sell side of the put spread I opened yesterday but will hold SPY 109 puts for further downside. I do NOT expect to see an intra-day reversal. If I do see any hints of it, I will interpret it as the banksters pushing on a string and will vigorously short the attempt.
It’s not worth chasing 10 points.
Nobody cares about turkey they aren’t any threat.
Russia was a problem with Ukraine and yet they are victims now
Odds favor a bounce from at 2060 area…
To quick to draw a conclusion yet until the close but again odds favor a bounce tommorow
If we see a green candle today or a flat close that would be very bullish and signal more upside in the near term. If we close near the lows with a break of 2062 it probably means more downside. If there is going to be any kind of Santa Claus rally I think we need to see some sort of pullback first.
I love turkey…especially when it is smoked…! 😀
We now have a complete five down on the five minute chart with a fairly long fifth wave. If we get a three wave pull back…look out below! Now is NOT the time to be a cowboy folks…a break of 2071 will be revealing…gap at 2086.59 really should be at least filled today to confirm bullish potential
Nothing probably happens higher prices last week was even worse and we sky rocketed – Dax ripping higher
The key is to be prepared whatever the market does. To be lopsidedly bullish or bearish in this market is a sure way to loose money. Whatever the market does, you should be taking profits either from your hedges, or from your directional bets. A well-managed account should be showing BOTH green and red on any given day.
vernecarty
well put matey
Vernecarty
Is now a confirmation to reshort ? Or is this a fake out to move higher ??
The Turks knocked down Russian fighter aircraft, future contract minor 4 came close to minor1
So can you exaolin further ? More downside ??
Great chart! That 2062 level is important as breaking it would invalidate the wave four designation. Some folk are counting this decline as a wave 2 correction. We will see…
Exogenous shocks come in all forms and they are not always economic. Sometimes they are political. Turkey has shot down a Russian jet over Syria. You will not find two more ruthless leaders on the world stage than Recep Erdogan and Vladimir Putin. Futures in Europe properly reflecting the inherent danger in the current situation. This could get very ugly in a hurry, and no amount of bankster meddling would remedy it. No one, so far, has called for a top in the market…
Vernecarty,
Yes I can’t believe it .
I had a original target of 2066-2070 and here we are
They will probably resolve through NATO as accudevtky and this was the pull back excuse we needed to go higher tommorow…