
Upwards movement was expected. Price did move a little higher but completed an overall sideways day in a very small range.
Summary: The trend is still down, but a bear market rally continues and is not done yet. A slight new high above 2,116 is expected in the next few days now. Thereafter, the downwards trend should resume in force. This bear market rally is extremely unlikely to make a new all time high. It is expected to stop before 2,134.72. It may end in two more days.
To see how each of the bull and bear wave counts fit within a larger time frame see the Grand Supercycle Analysis.
To see last analysis of weekly and monthly charts click here.
If I was asked to pick a winner (which I am reluctant to do) I would say the bear wave count has a higher probability. It is better supported by regular technical analysis at the monthly chart level, it fits the Grand Supercycle analysis better, and it has overall the “right look”.
New updates to this analysis are in bold.
BULL ELLIOTT WAVE COUNT
DAILY CHART – COMBINATION OR FLAT

Click chart to enlarge.
Cycle wave IV should exhibit alternation to cycle wave II.
Cycle wave II was a shallow 0.41 zigzag lasting three months. Cycle wave IV should exhibit alternation in structure and maybe also alternation in depth. Cycle wave IV may end when price comes to touch the lower edge of the teal channel which is drawn about super cycle wave V using Elliott’s technique (see this channel on weekly and monthly charts).
Cycle wave IV may end within the price range of the fourth wave of one lesser degree. Because of the good Fibonacci ratio for primary wave 3 and the perfect subdivisions within it, I am confident that primary wave 4 has its range from 1,730 to 1,647.
If a zigzag is complete at the last major low as labelled, then cycle wave IV may be unfolding as a flat, combination or triangle.
Primary wave B or X is an incomplete zigzag unfolding upwards. If cycle wave IV is an expanded flat correction, then primary wave B may make a new high above the start of primary wave A at 2,134.72. If cycle wave IV is a combination, then primary wave X may make a new high above the start of primary wave W. There is no upper invalidation point for these reasons.
Primary wave A or W lasted three months. When it arrives primary wave Y or C may be expected to also last about three months.
Intermediate waves (A) and (B) together lasted a Fibonacci 34 days within primary wave B or X. Intermediate wave (C) may complete in a total Fibonacci five days, which would see it continue now for a further two days.
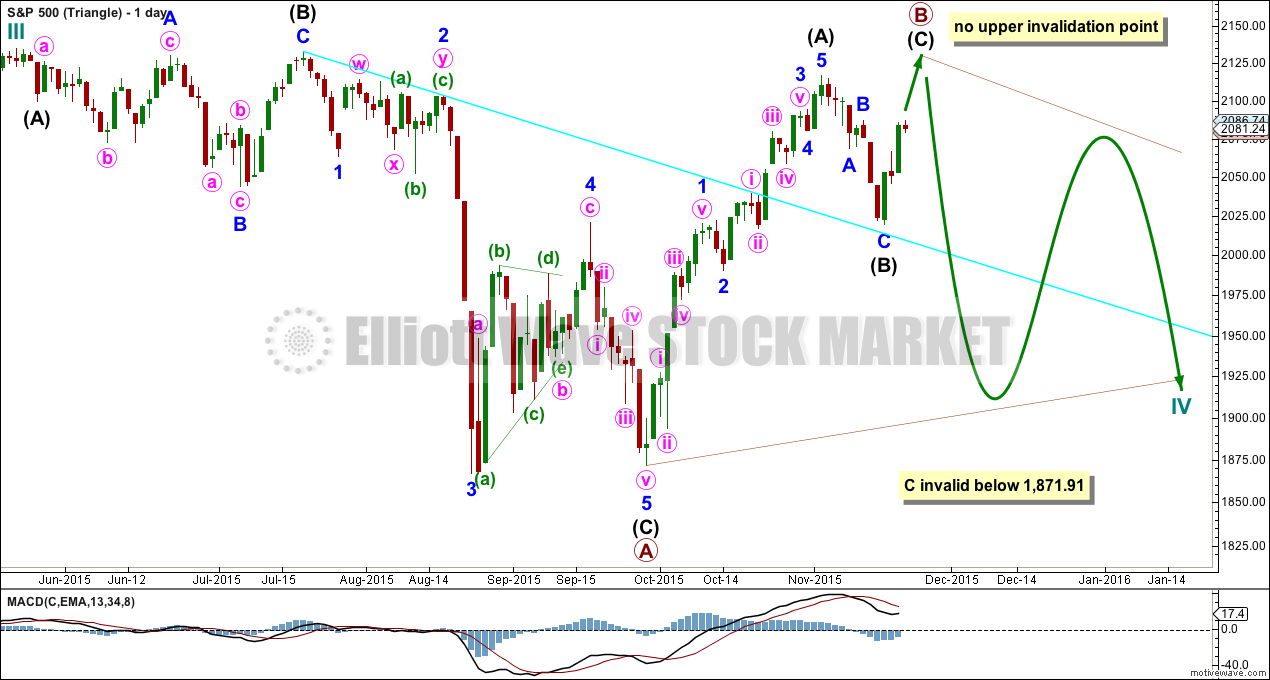
DAILY CHART – TRIANGLE
Click chart to enlarge.
Cycle wave IV may unfold as a shallow triangle. This would provide alternation with the 0.41 zigzag of cycle wave II.
Primary wave B may be unfolding as a zigzag. Primary wave B may make a new high above the start of primary wave A at 2,134.72 as in a running triangle. There is no upper invalidation point for this wave count for that reason.
The whole structure moves sideways in an ever decreasing range. The purpose of triangles is to take up time and move price sideways. A possible time expectation for this idea may be a total Fibonacci eight or thirteen months, with thirteen more likely. So far cycle wave IV has lasted six months.
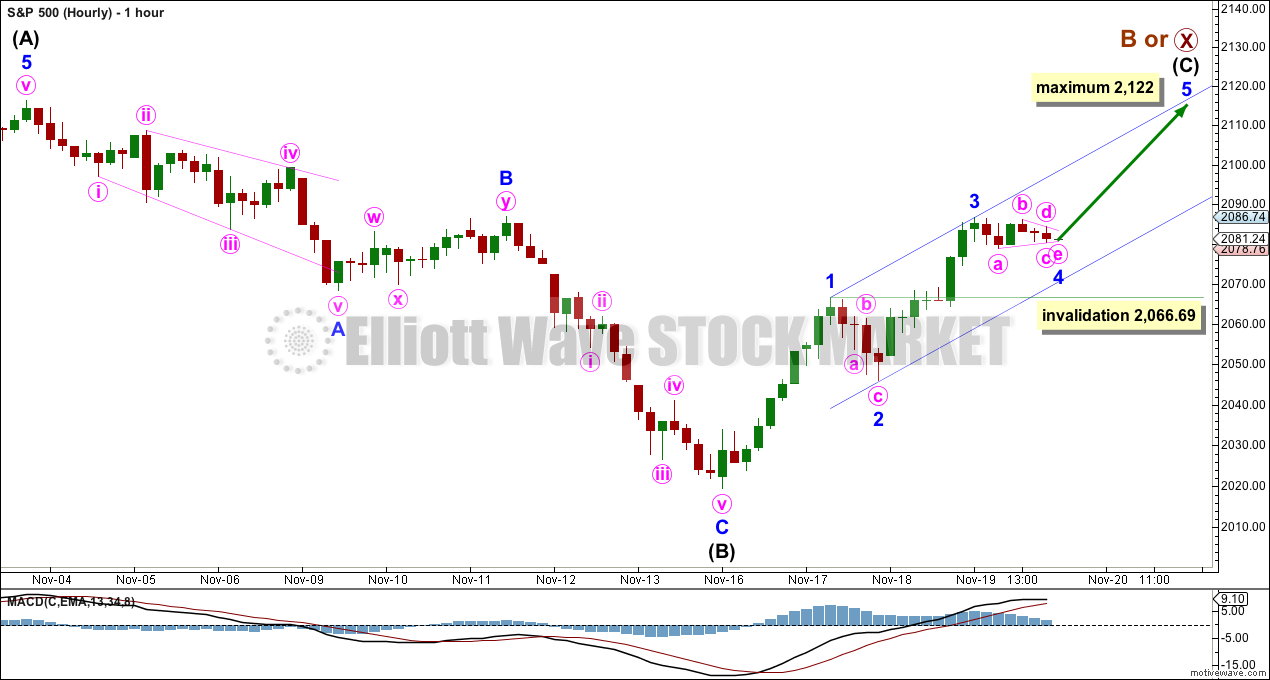
HOURLY CHART
Click chart to enlarge.
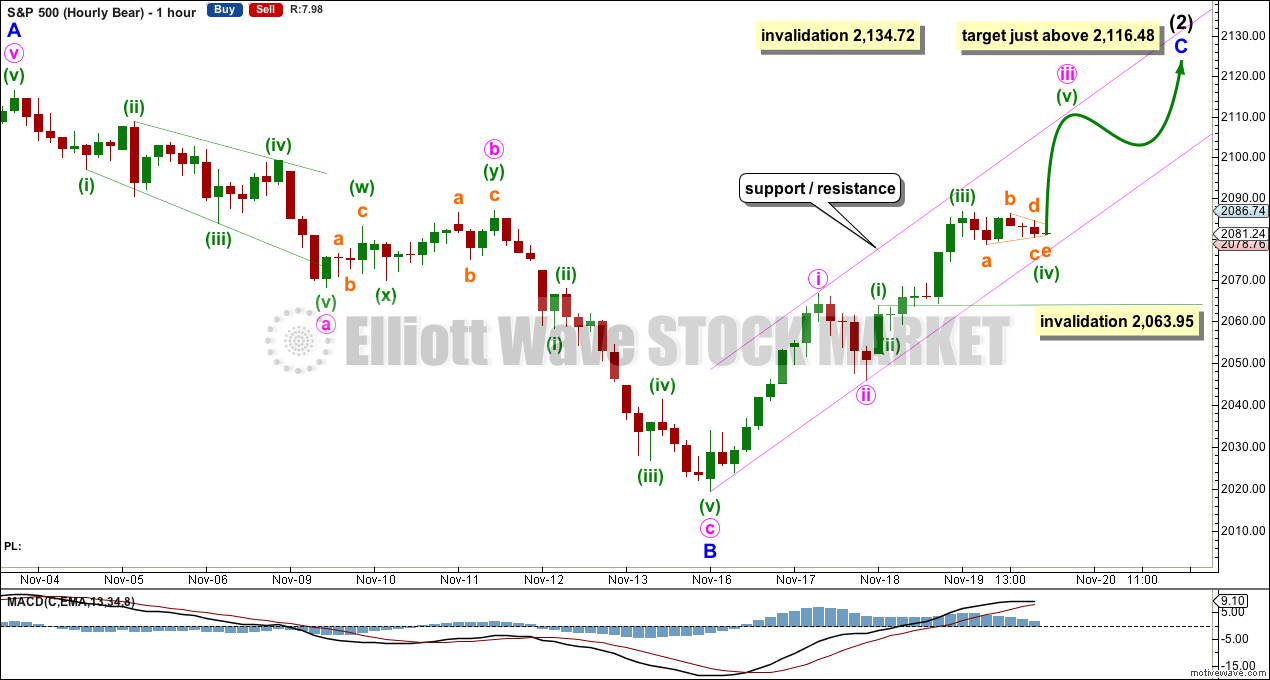
There are at least two different ways to label this upwards movement, so this hourly wave count and that for the bear below will be used to illustrate two different ideas. Both ideas work in the same way for both the bull and bear wave counts.
Intermediate wave (C) must subdivide as a five wave structure. It is not subdividing as a diagonal at this stage, so it is the more common impulse.
Minor wave 3 may have ended at the high for Thursday within the impulse. If this is correct, then minor wave 3 is shorter than minor wave 1 by 6.46 points. Because a core Elliott wave rule states that within an impulse a third wave may never be the shortest, this limits the fifth wave to no longer than equality in length with the third at 2,122.
On the daily chart, this wave count looks better than the second idea published with the bear hourly. Both minor waves 2 and 4 show on the daily chart as small red candlesticks and that gives this impulse the right look.
If the triangle does not hold and minor wave 4 morphs into a combination or flat correction, then it may not move into minor wave 1 price territory below 2,066.69.
This wave count would expect most likely two more days of upwards movement to just above 2,116.48 but not above 2,122.
The channel is drawn here using Elliott’s first technique: draw the first trend line from the ends of minor waves 1 to 3, then place a parallel copy on the end of minor wave 4. Minor wave 5 may end when price finds resistance at the upper edge of the channel.
After some upwards movement (whether or not it reaches above 2,116.48) a subsequent breach of the lower edge of this channel would provide trend channel confirmation that the bear market rally is over.
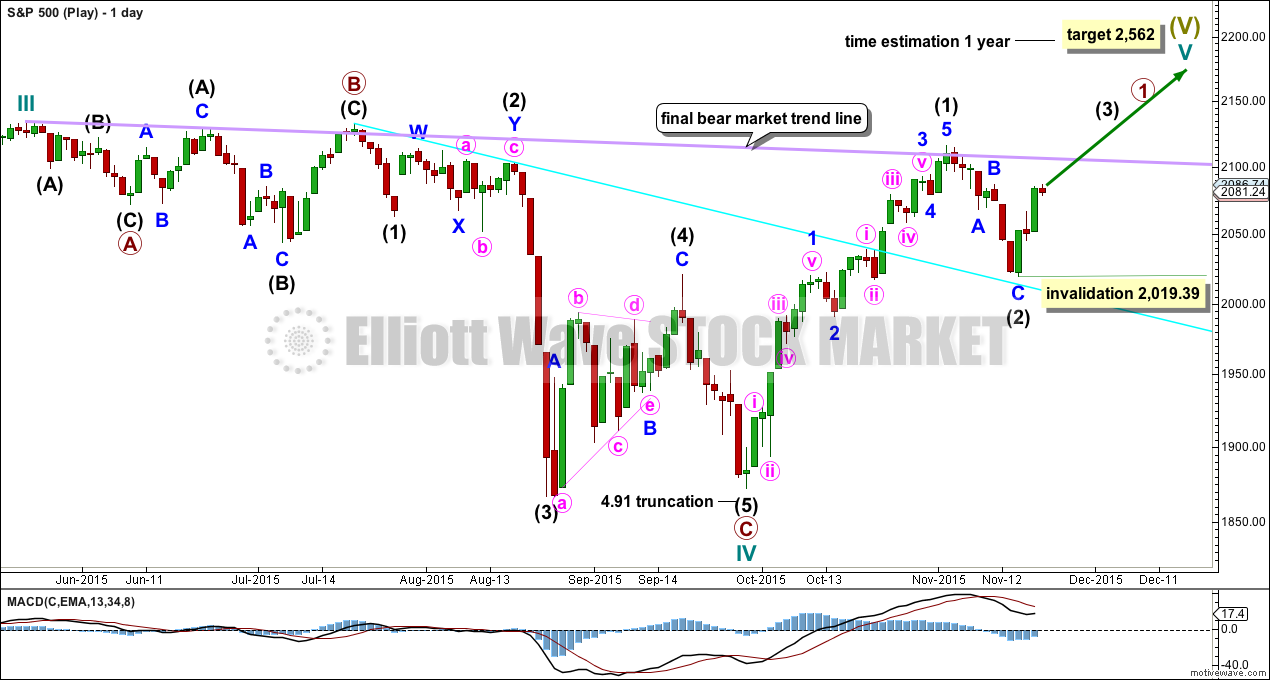
ALTERNATE BULL ELLIOTT WAVE COUNT
DAILY CHART
Click chart to enlarge.
It is possible to see cycle wave IV a completed flat correction. This would provide some structural alternation with the zigzag of cycle wave II.
This is a regular flat but does not have a normal regular flat look. Primary wave C is too long in relation to primary wave A. Primary wave C would be 3.84 short of 4.236 the length of primary wave A. While it is possible to also see cycle wave IV as a complete zigzag (the subdivisions for that idea would be labelled the same as the bear wave count below, daily chart) that would not provide structural alternation with the zigzag of cycle wave II, and so I am not considering it.
This idea requires not only a new high but that the new high must come with a clear five upwards, not a three.
At 2,562 cycle wave V would reach equality in length with cycle wave I. Cycle wave I was just over one year in duration so cycle wave V should be expected to also reach equality in duration. Cycle degree waves should be expected to last about one to several years, so this expectation is reasonable. It would be extremely unlikely for this idea that cycle wave V was close to completion, because it has not lasted nearly long enough for a cycle degree wave.
I added a bear market trend line drawn using the approach outlined by Magee in “Technical Analysis of Stock Trends”. When this lilac line is clearly breached by upwards movement that shall confirm a trend change from bear to bull. The breach must be by a close of 3% or more of market value. If it comes with a clear five up, then this wave count would be further confirmed.
While price remains below the bear market trend line, we should assume the trend remains the same: downwards.
Intermediate wave (1) is a complete five wave impulse and intermediate wave (2) is a complete three wave zigzag. Subdivisions at the hourly chart level would be the same for this wave count as for the other two wave counts; A-B-C of a zigzag subdivides 5-3-5, exactly the same as 1-2-3 of an impulse.
For this wave count, when the next five up is complete that would be intermediate wave (3). Within intermediate wave (3), no second wave correction may move beyond the start of its first wave below 2,019.39.
This wave count does not have support from regular technical analysis and it has a big problem of structure for Elliott wave analysis. I do not have confidence in this wave count. It is presented as a “what if?” to consider all possibilities.
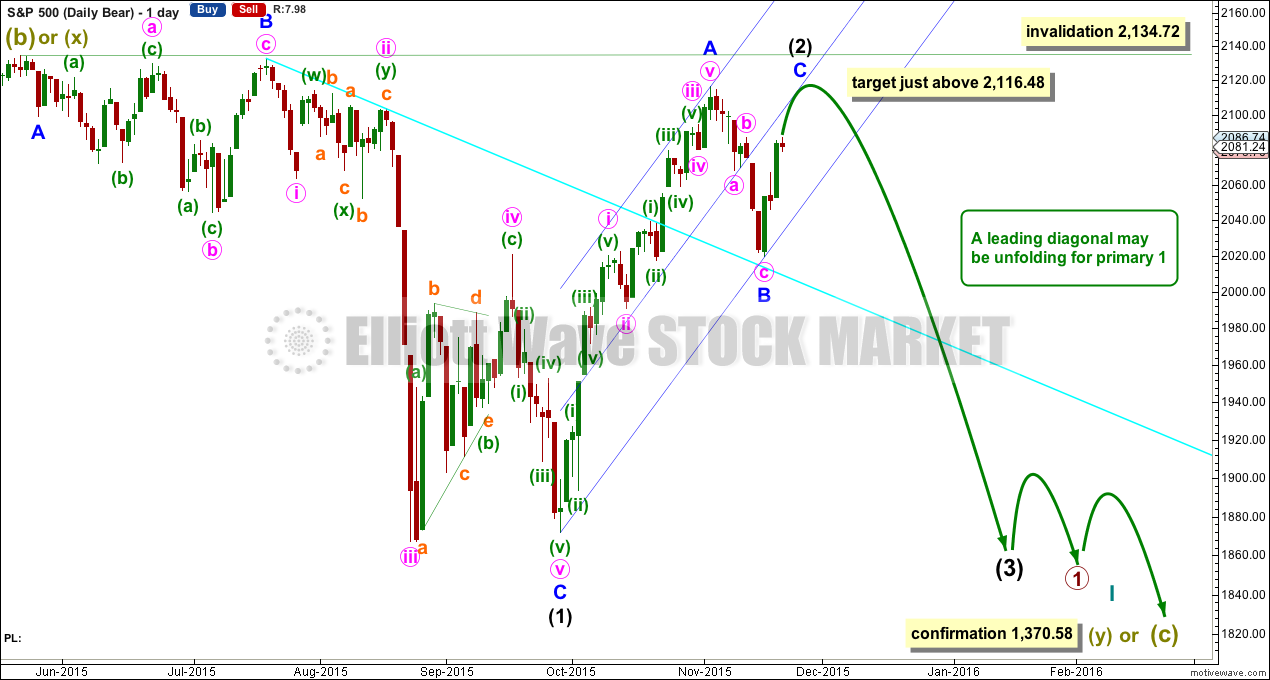
BEAR ELLIOTT WAVE COUNT
DAILY CHART
Click chart to enlarge.
This bear wave count has a better fit at Grand Super Cycle degree and is better supported by regular technical analysis at the monthly chart level. But it is a huge call to make, so I present it second, after a more bullish wave count, and until all other options have been eliminated.
There are two ideas presented in this chart: a huge flat correction or a double flat / double combination. The huge flat is more likely. They more commonly have deep B waves than combinations have deep X waves (in my experience).
A huge flat correction would be labelled super cycle (a)-(b)-(c). It now expects a huge super cycle wave (c) to move substantially below the end of (a) at 666.79. C waves can behave like third waves. This idea expects a devastating bear market, and a huge crash to be much bigger than the last two bear markets on the monthly bear chart.
The second idea is a combination which would be labelled super cycle (w)-(x)-(y). The second structure for super cycle wave (y) would be a huge sideways repeat of super cycle wave (a) for a double flat, or a quicker zigzag for a double combination. It is also possible (least likely) that price could drift sideways in big movements for over 10 years for a huge triangle for super cycle wave (y).
The bear wave count sees a leading diagonal for a primary degree first wave unfolding. Within leading diagonals, the first, third and fifth waves are most commonly zigzags but sometimes may appear to be impulses. Here intermediate wave (1) is seen as a complete zigzag.
Intermediate wave (2) is an incomplete zigzag within the leading diagonal. It may not move beyond the start of intermediate wave (1) above 2,134.72. This wave count expects minor wave C to end midway within its channel, above the end of minor wave A at 2,116.48 but not above 2,134.72.
HOURLY CHART
Click chart to enlarge.
This hourly wave count shows another way to look at recent upwards movement. I have checked both ideas on the five minute chart and both work. To envisage this idea for the bull wave count everything would be moved up one degree.
Minute wave iii may be incomplete. Within minute wave iii, minuette wave (iii) is 0.72 longer than 1.618 the length of minuette wave (i). Minuette wave (iv) may be completing as a triangle. At 2,098 minuette wave (v) would reach equality in length with minuette wave (i).
If the triangle of minuette wave (iv) does not hold and this small correction morphs into a combination or flat, then it may not move into minuette wave (i) price territory below 2,063.95.
If tomorrow begins with a new high, then the triangle of minuette wave (iv) may be expected to be over. The invalidation point may then be moved up to the high of minute wave i at 2,066.69. The upcoming correction for minute wave iv may not move into minute wave i price territory.
The pink channel drawn here is a base channel about minute waves i and ii. Along the way up, price may find resistance at the upper edge. If price breaks above the channel, then the upper edge may provide support.
Minute wave iii would not be shorter than minute wave i and so would not limit the length of minute wave v.
The most important material difference between this very bearish wave count and the first bull wave count is the invalidation point at 2,134.72.
TECHNICAL ANALYSIS
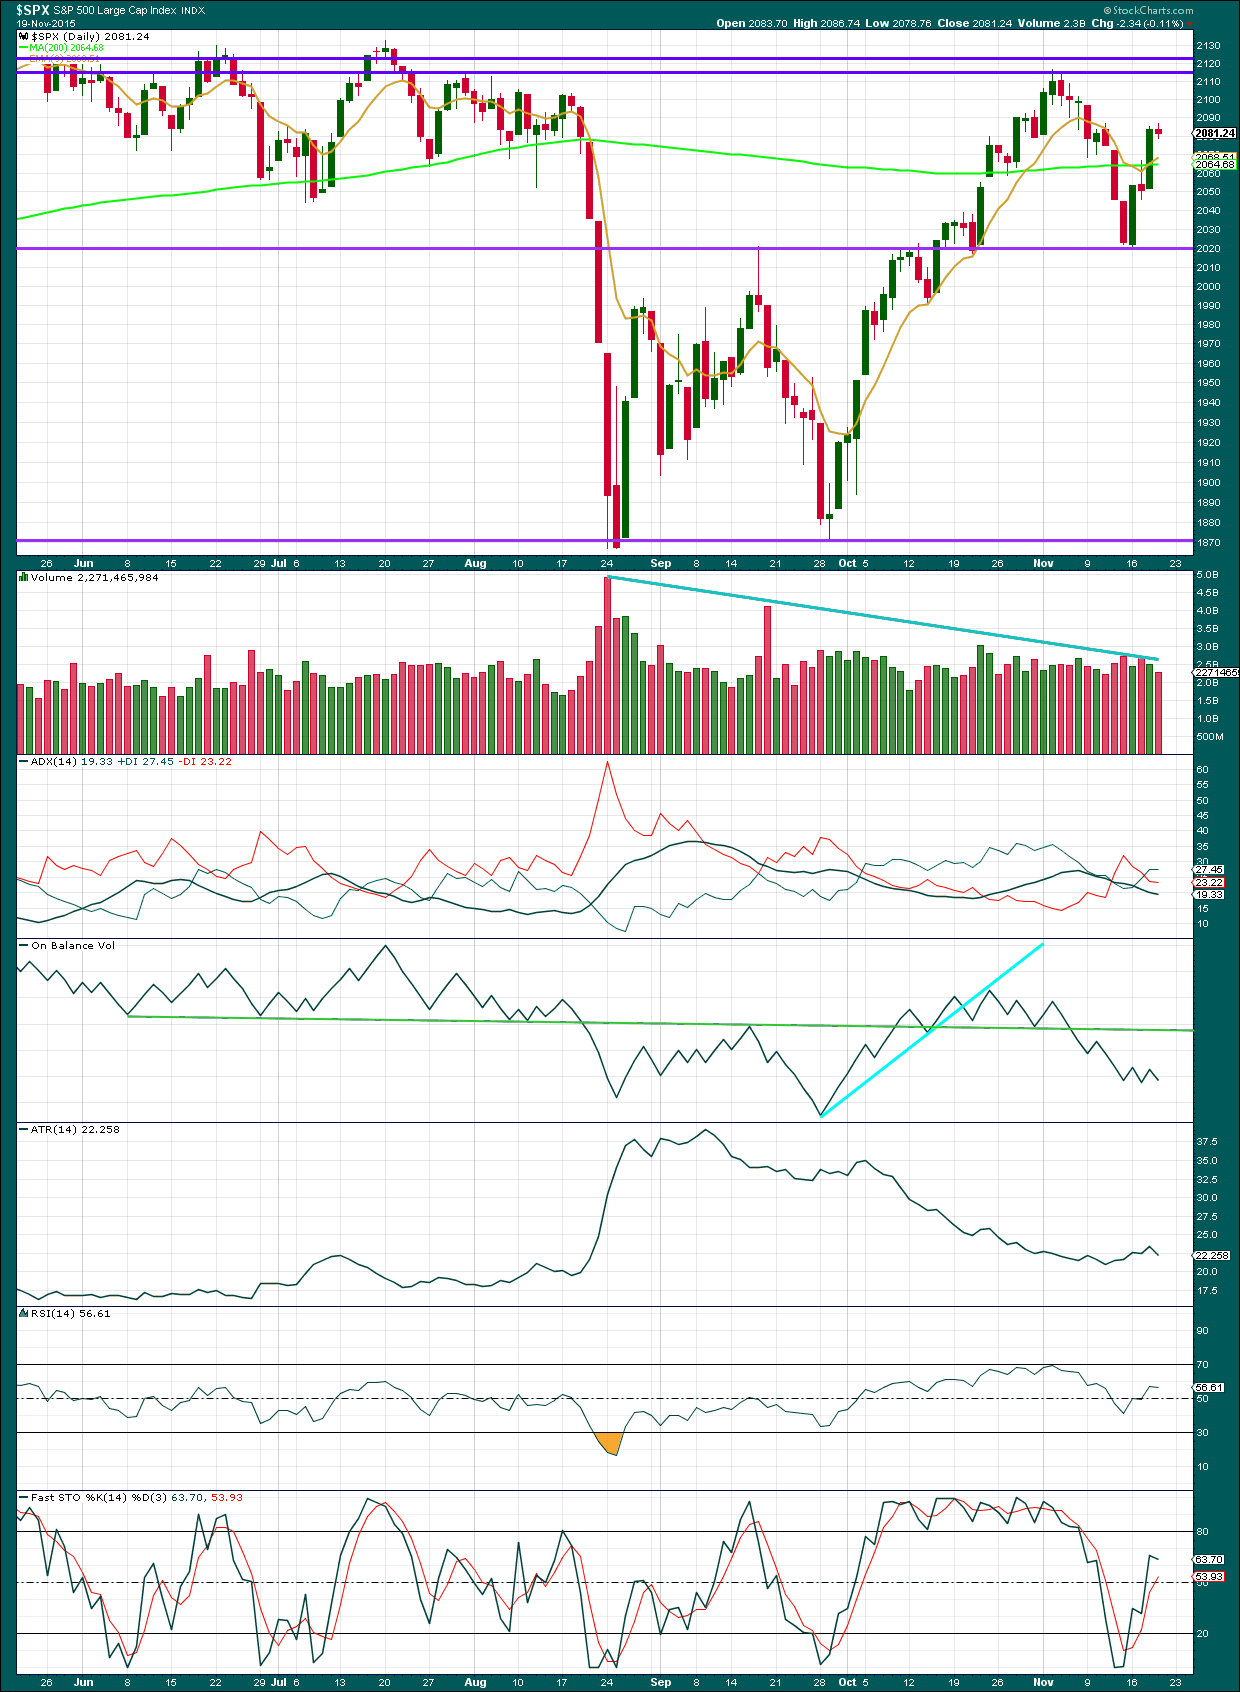
Click chart to enlarge. Chart courtesy of StockCharts.com.
Daily: A small downwards day with lighter volume looks corrective. On its own, lighter volume for today isn’t bullish or bearish. Overall, as price rises an increase in volume would be expected otherwise the rise in price would be suspicious.
The black ADX line is declining indicating the market is not trending. ATR disagrees; its range is expanding which is more typical of a trending market.
Upwards movement may continue until Stochastics reaches overbought. Two more horizontal lines for resistance are drawn. If price reaches either of these lines while Stochastics reaches overbought, then upwards movement may be expected to end there.
On Balance Volume is a reasonably reliable leading indicator. The breach of the green trend line by OBV was a very bearish signal. If OBV comes up far enough to touch that trend line, it may assist to indicate when and where upwards movement in price may come to end.
Overall, the regular technical analysis picture indicates that this upwards movement is more likely a bear market rally than the resumption of a bull market. Volume on downwards days is stronger than upwards days and overall volume is declining while price moves higher. OBV is very bearish and much of this upwards movement came with a decline in ATR.
A note on Dow Theory: for the bear wave count I would wait for Dow Theory to confirm a huge market crash. So far the industrials and the transportation indices have made new major swing lows, but the S&P500 and Nasdaq have not.
S&P500: 1,820.66
Nasdaq: 4,116.60
DJT: 7,700.49 – this price point was breached.
DJIA: 15,855.12 – this price point was breached.
To the upside, for Dow Theory, I am watching each index carefully. If any make new all time highs, that will be noted. If they all make new all time highs, then a continuation of a bull market would be confirmed. So far none have made new all time highs.
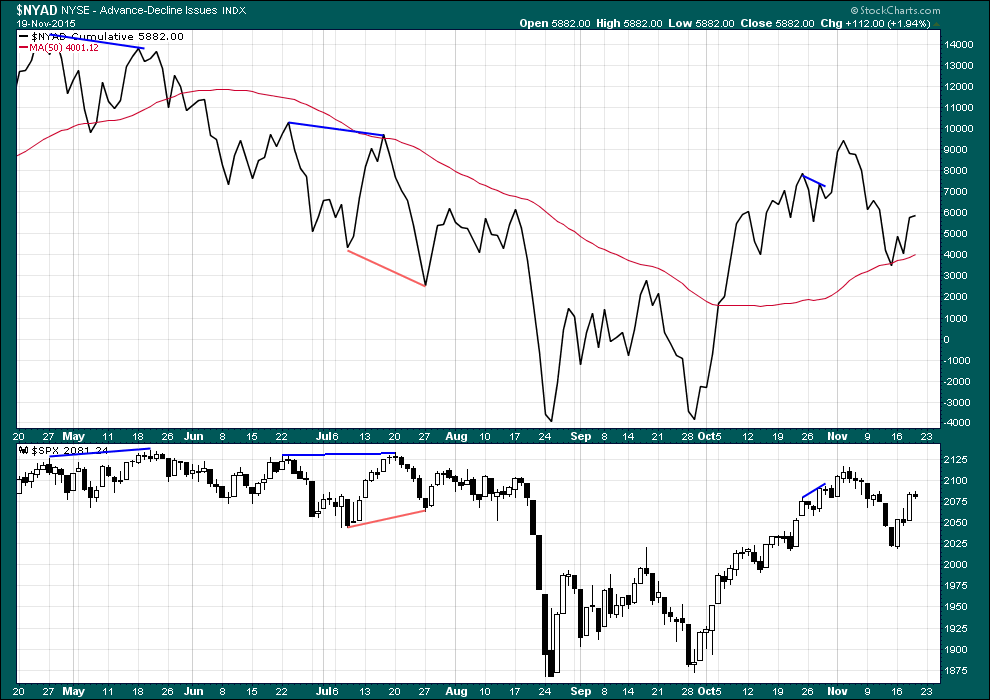
Click chart to enlarge. Chart courtesy of StockCharts.com.
From the all time high at 2,134.72, this chart notes several instances of divergence between price and the Advance Decline line.
Two bearish instances (blue lines) preceded the strong fall in price to the low of 24th August. Price made new highs on weaker breadth in both instances noted.
There was one bearish divergence (red lines) where price did not manage to make new lows but declines were stronger than advances. This too is bearish.
The current upwards movement will be watched carefully. If price makes new highs above the prior swing high of 3rd November at 2,116, then the AD line should also make new highs. If it does not, that would be a bearish indicator.
This analysis is published about 7:25 p.m. EST.
Lara,
If we turn at 2120ish(Fingers Crossed Next Week – No Jinx) would that imply a 5 wave impulsive move down?
Thanks,
Options2014
Not necessarily.
For the bull wave count it may be a five down for primary C, or it may be a three down for primary wave Y.
For the bear wave count I would expect most likely a three (zigzag) down for intermediate (3). Because its a third wave within a leading diagonal.
Lara,
Please review my elliotwave chart for accuracy..
Thanks,
Options2014
For me to know exactly what you mean the labels of the waves need to be placed accurately on the ends of each candlestick that you consider the turning point.
The labels for I, II, III, IV and V are just kind of… floating. They appear to be placed alongside the wave, not at the ends of the waves.
oh o.k, let me fix that – thanks!
Lara,
K, here is an updated one with precision and projections for Wave 5.
Thanks a bunch!
-options2014
That’s the same wave count for the upwards movement as I have for the hourly bear in this analysis.
It fits.
How did you calculate the target 2,120? Is that a Fibonacci ratio of your wave I or III ?
FRIDAY CHART OF THE WEEK ALL –
NETFLIX UP 22% in 5 TRADING DAYS – THE NEW NORMAL!!
S&P 500 slow stochastics has more room to run up before rolling over – further supporting higher prices for the S&P 500 than seen today…
2120ish remains the final target.
Lara,
Wait, if we SPIKE higher above 2134.72 on an intraday basis then close below 2134.72 – wouldn’t that be classified as an extended 5th wave? Then reverse hard down…
Wouldn’t that fit the perfect picture to complete this maniac bull market?
Any breach of 2,134.72 by any amount at any time frame fully invalidates the bear wave count.
The rule for a second wave is black and white. It may not move beyond the start of the first wave.
That’s the nice thing about Elliott wave. All (with a sole exception) the rules are black and white and should be met all the time for all structures.
So you know exactly where you stand with a wave count and exactly when it’s invalidated.
There is simply no higher price point for an invalidation of the bear. That’s it.
hmm o.k. Thanks Lara!
That triangle worked perfectly.
Both hourly wave counts remain valid and I’ll follow both again today. I’m still going to favour the first idea because then minor 2 and 4 would both show up on the daily chart. The invalidation point for that is now the end of the triangle at 2,080.67. The fifth wave for minor 5 would be extending, this current downwards movement during Friday’s session is a second wave correction within it for this first idea.
The second idea has the invalidation point still at 2,066.69. Minute iv has just begun for that idea. The channel can now be redrawn using Elliott’s technique on that second hourly chart; from 1 to 3, copy on 2. The lower edge should provide support.
Both hourly charts expect this structure is incomplete.
Now at this stage if we see a new low below 2,066.69 the probability that intermediate (C) is over will be high. A new low below its start at 2,019.39 would confirm then next big bear move down must be underway. Either intermediate (C) could be truncated or my wave count is wrong and intermediate (C) ended at the prior swing high at 2,116.
For now, I’m still expecting more upwards movement to above 2,116.
Just WOW – Come on 2122 🙂
Today’s pop is good enough for me. Yesterday’s triangle for wave four was pretty good confirmation that today would begin the final wave up at minor degree. Loaded the remainder of my short positions with stop at 2135. I imagine lots of chart watchers are waiting and Mr. Market just loves to bamboozle the crowd. Let’s hope I am right, and if I am not, I will know at 2135. Have a great week-end everybody!
vernecarty
Bold, I am waiting 1 more day. I think 2122 is the final target….
You are a wise man! 😀
I must admit I was emboldened by the thrust from the triangle which is usually a reliable entry point.
vernecarty,
Can I see a chart of the triangle?
I was telling a friend of mines early this week at SPX 2020 we could take out last weeks bearish candle this week and price should return to 2100 and here we are today and the weekly candle is — Well Just amazing!
oh never mind. I saw Laras posting of it.
Take a look at the education page, there’s a video on Elliott wave triangles there.
When they form they’re fantastic opportunities to join a trend. But be careful, fifth waves out of triangles can be surprisingly short sometimes. And quick.
It was depicted on Lara’s first hourly count.
oh o.k
I was in fact expecting the fifth wave out of the triangle to be short (pun intended) and sweet. 😀
vernecarty,
NDX is pushing higher – SPX is stalled out… Trade safe!!
vernecarty
Why would you make a decision 4 days in a row UP and now UP today. Look at the ranges. I am just saying….
My assumption is that upside is limited and clearly I could be wrong. Even if the fifth wave is extending as it now appears, my plan was to go short after the first pop of minor five which we had today. Another spike up for three of five next week would be well within my expectation but I am comfortable going short on the end of minor four, which is clear, than at the end of minuette four of five, which may move faster than I can.
Premiums are probably going to go up next week; the market makers are also counting.
Ok I’m in front of the trading screens all day so I just need that 15 min window to get in when we spike 🙂
Vix should get crushed more…
Put options would decline ….
vernecarty,
I learned the hard way – NEVER TO LATE TO SHORT! BUT ALWAYS TO EARLY CAN WIPE YOU OUT!
Always, always, always have stops in place to limit your loss if you are wrong, which for most of us is going to be more than 50% of the time. You can still survive (and even thrive!)with a less than 50% win ratio if you keep your losses small…
I am an ALL IN kind of guy. 🙂
Stops with options are really really messed up. By the time price swings against you – you are down about -30% – to mental to let go of a loss at that point. Then you get all wishful thinking then go bust. I am done playing that game. I can wait for the entry short even if I am late! I wait for confirmation now….
vernecarty
SPX is grinding higher!
Goodness. I sure do hope I’m right and you make nice profits!
If I’m wrong… it just doesn’t bear thinking about.
I keep looking at weekly and monthly charts…. volume, RSI and momentum…. and it all points to a big bear market… but what if there’s something I’m missing? What if I’m wrong?
These deep corrections during bear markets have us all second guessing ourselves. Me included. They’re nerve wracking! I think that’s their design. I see many predicting new all time highs with strong certainty.
Thanks Lara,
My only regret in my trading is that I should have joined your subscription years ago 🙂
Could have helped immensely. I will be sure to tell all traders I know that your information is probably the most concise out there on markets and for a fraction of the cost. Cant beat that!
Lara,
Usually – you aren’t wrong. These are the head fakes – and you start questioning your analysis and then it all happens as originally thought.
A most interesting observation and quite telling. Almost every perma-bear I know is now expecting an extended fifth wave up and talking about the likelihood of new ATH. In addition, the Thanksgiving week is traditionally bullish for the markets so there is an awful lot of folk on the long side. Hopefully we will have a clearer picture come Monday’s trading.
Mr. Draghi is again assuring us that “We will do what we must” and futures are obediently popping higher. Apparently the enthusiasm will continue into the week-end. I have got possible truncation on my mind. Beware the bravado of banksters – their jawboning frequently signals tops.
Amazing. Im waiting – its not worth chasing this last long…
Bear markets are notoriously tricky and fool most traders. Why? Because they do exactly the opposite of what they should, that is they buy rallies, and sell declines. As Lara just pointed out, the moves tend to be sharp so the key is to be positioned BEFORE they occur. After a sharp decline has already begun, the bid ask spreads for options adjust quite quickly thus creating an unfavorable risk to reward scenario. Obviously, the key is to make sure the trend has been established with reasonable certainty by the available technical information, and to continue to use stops to limit losses when one is wrong. As it is counter-intuitive for most people to sell sharp rallies and buy sharp declines (or at least be quick to take profits), the other best option once a bear market has been confirmed is to just load up on options a year or so out and walk away while market gyrations send most people crazy. 😀
Been there tried it – very very hard. As you literally only have minutes to get out of sharp long and get into a good price on the short. Got have a plan A and stick with it… Even a plan B….
Use contingency orders to exit your positions automatically at your profit targets. It is simply the opposite of a stop-loss which you use all the time.
Thanks, will look into it.
15, 30 & 60 min heading down from ST over bought
Mixed bag again …..Perhaps the weekly MACD will hit resistance at 0 mark and turn
The OEX is nearing 80% again Stopped at 85% last run up
Price nested at fib resistance again ,Lara’s targets in bright blue
Have a good day ! I am taking a friend to the hospital for day surgery
Thanks John
HI
Lara,
After further consideration I have accepted your thesis for a slightly higher price of 2116 and NO new all time highs. Many thanks for opening my eyes!
Thanks,
Options2014
Hi Lara:
If primary one for the bear count continues to develop as a leading diagonal, should we expect an increase in momentum for all its motive waves (of intermediate three), or just for C of intermediate three down? Thanks!
Vernecarty,
What’s your take on how we get to 2116 ?
Thanks,
Options2014
I would look for an outside day reversal to signal the end of the current move up. I like Lara’s first hourly count where minor five equals minor three at 2122. I will be keeping an eye on futures Sunday evening. If they are elevated Monday could be the day.
Vernecarty,
Thanks for your insightful input.
The big short 🙂
I got to tell you i have been shorting for years the Spx – years…. Searching and waiting now – a very fun time indeed!
Locked and loaded! 🙂
Vernecarty,
The only interesting thing I’m curious about is. Will a futures high qualify if we tag 2116 in that session and not the cash ???
Vernecarty,
If the futures price action picks up from now and is persistence into the cash open. We could get a gap down and “BUY THE DIP” scenario off of 2070-2068 SPX and close the day green….
Thanks,
Options2014
Probably does not matter much, if the thesis is right. Around 2110 would be a conservative place to establish positions with a tight stop around 2115.
Sometimes the first wave is quick and sharp. We should look out for that.
Intermediate (3) should show an increase in momentum. If it’s a zigzag then we may not see the strongest momentum until the C wave. It doesn’t have to be like that, but that would be my pick.
Good point. Federal Reserve meeting day 9/17/15 was a perfect example of a sharp reversal move down…