
A strong upwards day changes the Elliott wave count.
Summary: The trend is still down, but a bear market rally continues and is not done yet. A slight new high above 2,116 is expected in the next few days now. Thereafter, the downwards trend should resume in force. This bear market rally is extremely unlikely to make a new all time high. It is expected to stop before 2,134.72. It may end in three more days.
To see how each of the bull and bear wave counts fit within a larger time frame see the Grand Supercycle Analysis.
To see last analysis of weekly and monthly charts click here.
If I was asked to pick a winner (which I am reluctant to do) I would say the bear wave count has a higher probability. It is better supported by regular technical analysis at the monthly chart level, it fits the Grand Supercycle analysis better, and it has overall the “right look”.
New updates to this analysis are in bold.
BULL ELLIOTT WAVE COUNT
DAILY CHART – COMBINATION OR FLAT
Click chart to enlarge.
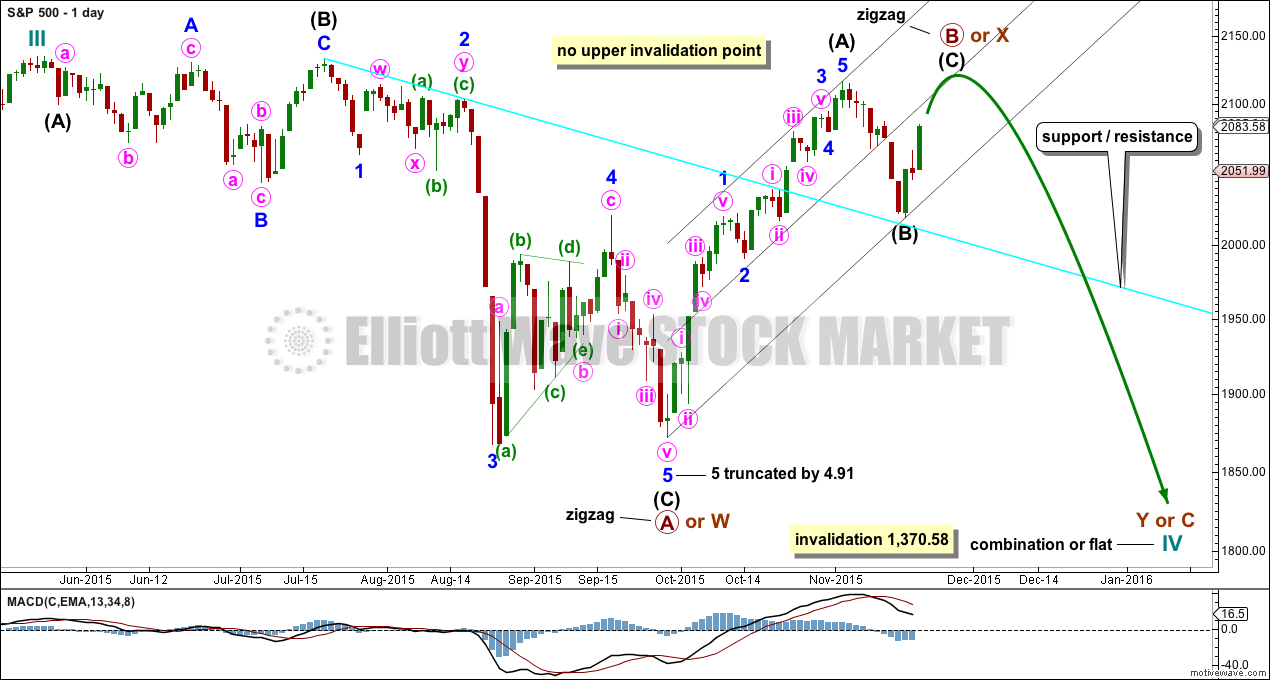
Cycle wave IV should exhibit alternation to cycle wave II.
Cycle wave II was a shallow 0.41 zigzag lasting three months. Cycle wave IV should exhibit alternation in structure and maybe also alternation in depth. Cycle wave IV may end when price comes to touch the lower edge of the teal channel which is drawn about super cycle wave V using Elliott’s technique (see this channel on weekly and monthly charts).
Cycle wave IV may end within the price range of the fourth wave of one lesser degree. Because of the good Fibonacci ratio for primary wave 3 and the perfect subdivisions within it, I am confident that primary wave 4 has its range from 1,730 to 1,647.
If a zigzag is complete at the last major low as labelled, then cycle wave IV may be unfolding as a flat, combination or triangle.
Primary wave B or X is an incomplete zigzag unfolding upwards. If cycle wave IV is an expanded flat correction, then primary wave B may make a new high above the start of primary wave A at 2,134.72. If cycle wave IV is a combination, then primary wave X may make a new high above the start of primary wave W. There is no upper invalidation point for these reasons.
Primary wave A or W lasted three months. When it arrives primary wave Y or C may be expected to also last about three months.
Intermediate waves (A) and (B) together lasted a Fibonacci 34 days within primary wave B or X. Intermediate wave (C) may complete in a total Fibonacci five days, which would see it continue now for a further three days.
DAILY CHART – TRIANGLE
Click chart to enlarge.
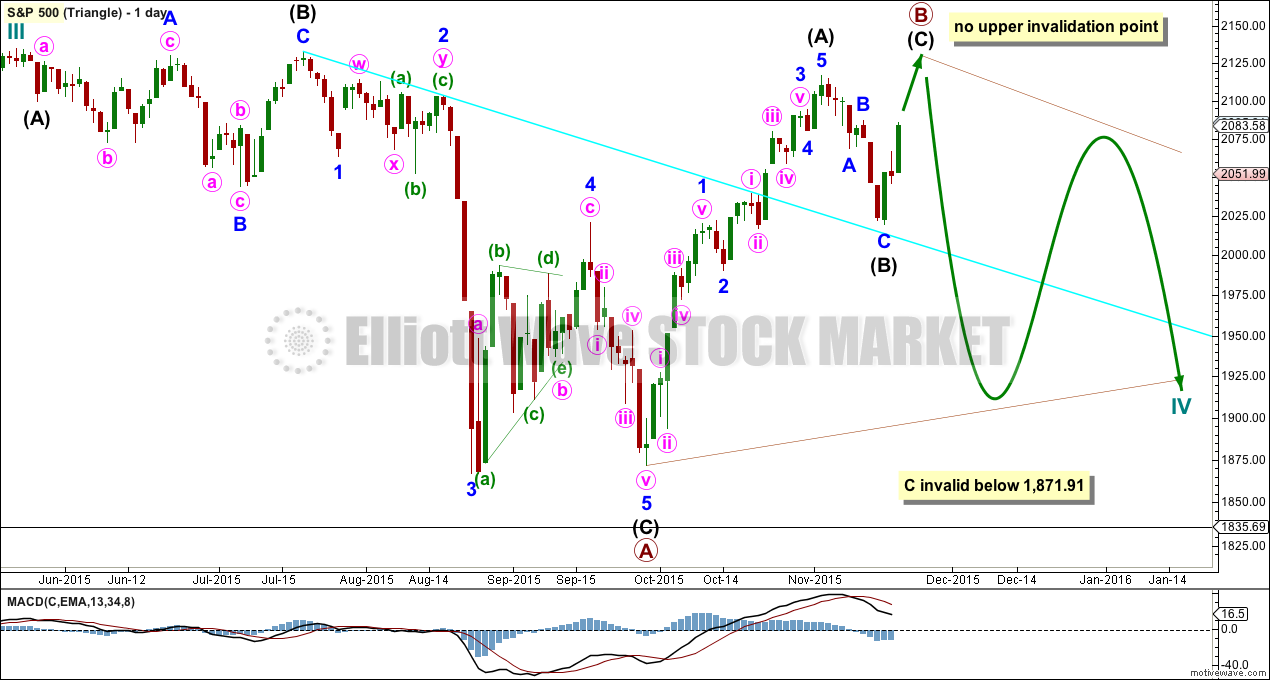
Cycle wave IV may unfold as a shallow triangle. This would provide alternation with the 0.41 zigzag of cycle wave II.
Primary wave B may be unfolding as a zigzag. Primary wave B may make a new high above the start of primary wave A at 2,134.72 as in a running triangle. There is no upper invalidation point for this wave count for that reason.
The whole structure moves sideways in an ever decreasing range. The purpose of triangles is to take up time and move price sideways. A possible time expectation for this idea may be a total Fibonacci eight or thirteen months, with thirteen more likely. So far cycle wave IV has lasted six months.
HOURLY CHART
Click chart to enlarge.
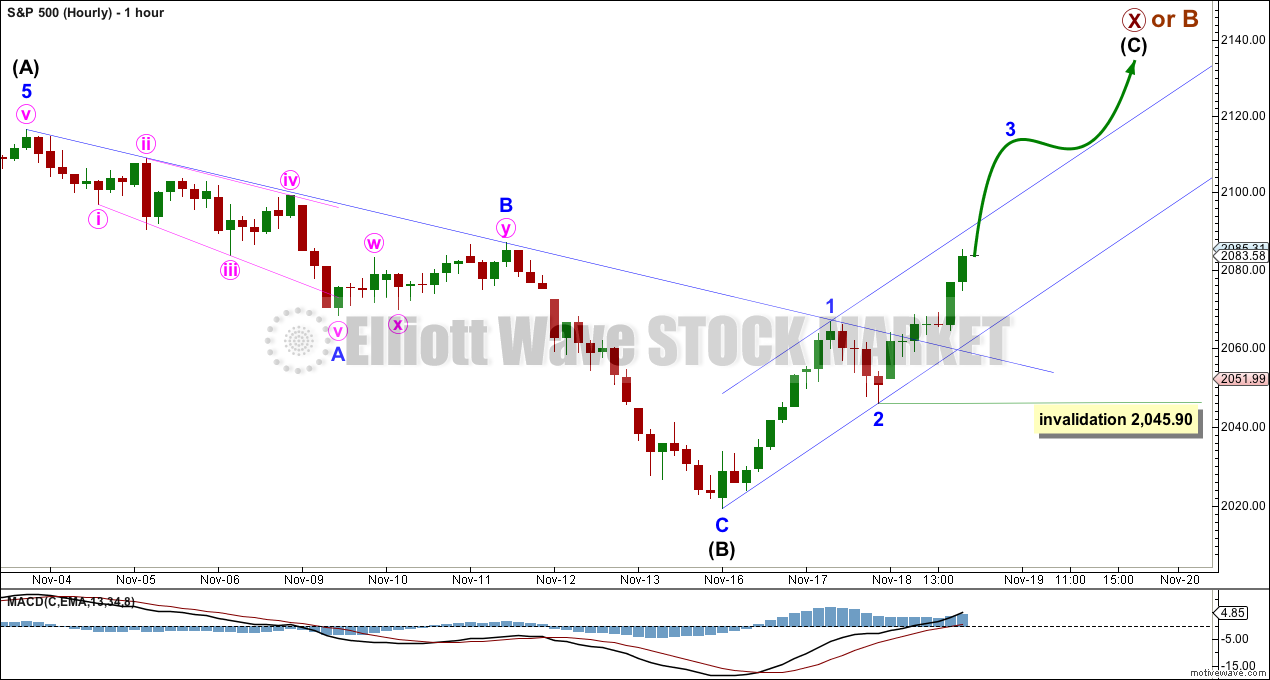
Today both hourly wave counts will be the same.
Wednesday’s session closed with a strong upwards day above the 200 day moving average. The length and duration of this upwards movement over the last three days does not look to be part of the prior wave down.
The downwards wave labelled intermediate wave (B) was very difficult to analyse. When movements prove to be particularly hard to analyse they often turn out to be B waves. That may be what has happened here. It will subdivide well as a zigzag, and this has good proportions. It also resolves the problem of a second wave correction following a first wave leading diagonal which should have been deep but was not. If that was minor wave B, then it would not have a tendency to be particularly deep.
Wednesday’s upwards movement breached the downwards sloping blue trend line drawn on intermediate wave (B). This is confirmation that the wave down labelled intermediate wave (B) is over and a new wave up is underway.
There may not be a Fibonacci ratio between intermediate waves (A) and (C). The best way to calculate a target for intermediate wave (C) to end may be to use the ratios between minor waves 1, 3 and 5 within it. When minor waves 3 and 4 are complete then a target for intermediate wave (C) may be calculated.
For now it should be expected that intermediate wave (C) is extremely likely to move at least slightly above intermediate wave (A) at 2,116.48 to avoid a truncation.
No second wave correction may move beyond its start below 2,045.90 within minor wave 3.
The upwards sloping channel is a base channel about minor waves 1 and 2. Minor wave 3 should have the power to break above that channel. When it has done that, then the upper edge may provide support for minor wave 4.
The invalidation point may be moved up to the high of minor wave 1 when minor wave 3 is complete.
ALTERNATE BULL ELLIOTT WAVE COUNT
DAILY CHART
Click chart to enlarge.
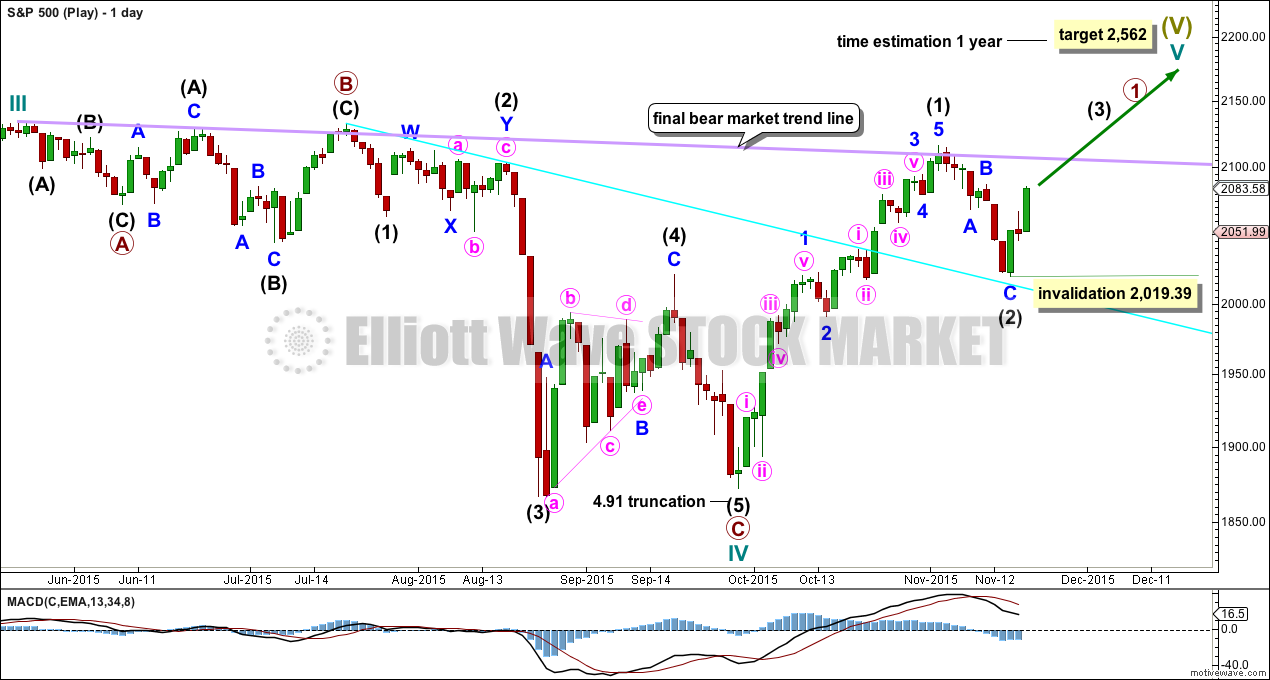
It is possible to see cycle wave IV a completed flat correction. This would provide some structural alternation with the zigzag of cycle wave II.
This is a regular flat but does not have a normal regular flat look. Primary wave C is too long in relation to primary wave A. Primary wave C would be 3.84 short of 4.236 the length of primary wave A. While it is possible to also see cycle wave IV as a complete zigzag (the subdivisions for that idea would be labelled the same as the bear wave count below, daily chart) that would not provide structural alternation with the zigzag of cycle wave II, and so I am not considering it.
This idea requires not only a new high but that the new high must come with a clear five upwards, not a three.
At 2,562 cycle wave V would reach equality in length with cycle wave I. Cycle wave I was just over one year in duration so cycle wave V should be expected to also reach equality in duration. Cycle degree waves should be expected to last about one to several years, so this expectation is reasonable. It would be extremely unlikely for this idea that cycle wave V was close to completion, because it has not lasted nearly long enough for a cycle degree wave.
I added a bear market trend line drawn using the approach outlined by Magee in “Technical Analysis of Stock Trends”. When this lilac line is clearly breached by upwards movement that shall confirm a trend change from bear to bull. The breach must be by a close of 3% or more of market value. If it comes with a clear five up, then this wave count would be further confirmed.
While price remains below the bear market trend line, we should assume the trend remains the same: downwards.
Intermediate wave (1) is a complete five wave impulse and intermediate wave (2) is a complete three wave zigzag. Subdivisions at the hourly chart level would be the same for this wave count as for the other two wave counts; A-B-C of a zigzag subdivides 5-3-5, exactly the same as 1-2-3 of an impulse.
For this wave count, when the next five up is complete that would be intermediate wave (3). Within intermediate wave (3), no second wave correction may move beyond the start of its first wave below 2,019.39.
This wave count does not have support from regular technical analysis and it has a big problem of structure for Elliott wave analysis. I do not have confidence in this wave count. It is presented as a “what if?” to consider all possibilities.
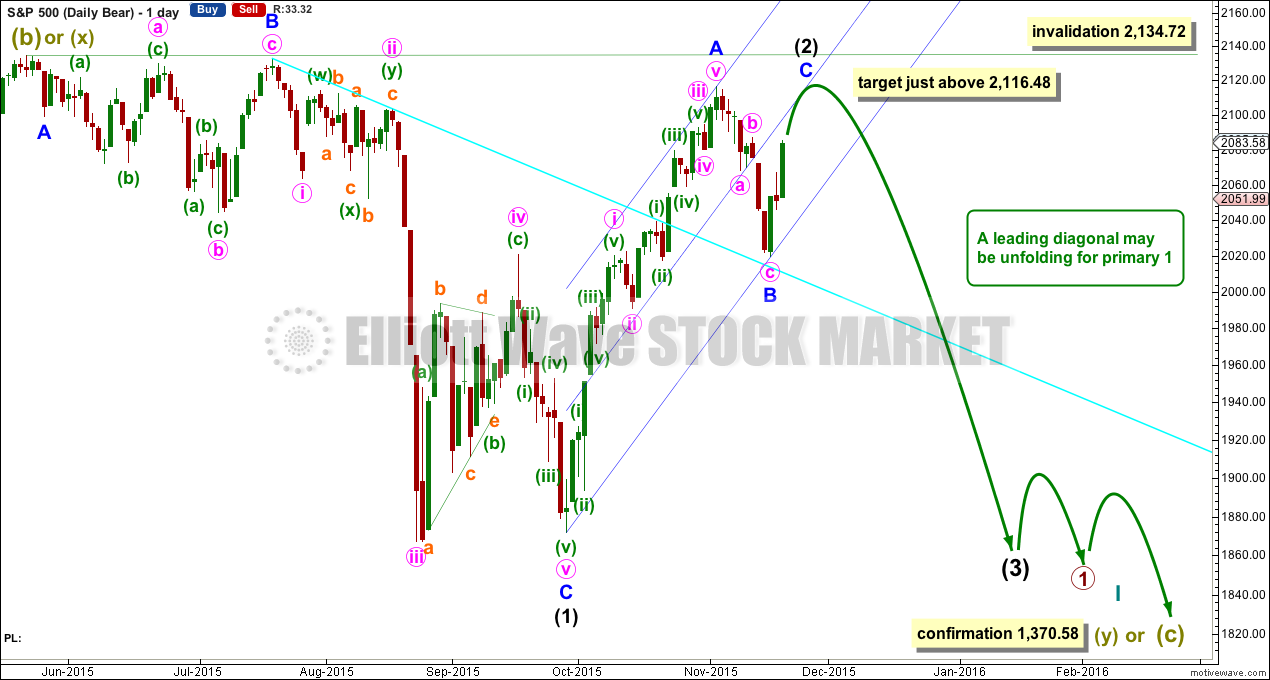
BEAR ELLIOTT WAVE COUNT
DAILY CHART
Click chart to enlarge.
This bear wave count has a better fit at Grand Super Cycle degree and is better supported by regular technical analysis at the monthly chart level. But it is a huge call to make, so I present it second, after a more bullish wave count, and until all other options have been eliminated.
There are two ideas presented in this chart: a huge flat correction or a double flat / double combination. The huge flat is more likely. They more commonly have deep B waves than combinations have deep X waves (in my experience).
A huge flat correction would be labelled super cycle (a)-(b)-(c). It now expects a huge super cycle wave (c) to move substantially below the end of (a) at 666.79. C waves can behave like third waves. This idea expects a devastating bear market, and a huge crash to be much bigger than the last two bear markets on the monthly bear chart.
The second idea is a combination which would be labelled super cycle (w)-(x)-(y). The second structure for super cycle wave (y) would be a huge sideways repeat of super cycle wave (a) for a double flat, or a quicker zigzag for a double combination. It is also possible (least likely) that price could drift sideways in big movements for over 10 years for a huge triangle for super cycle wave (y).
The bear wave count sees a leading diagonal for a primary degree first wave unfolding. Within leading diagonals, the first, third and fifth waves are most commonly zigzags but sometimes may appear to be impulses. Here intermediate wave (1) is seen as a complete zigzag.
Intermediate wave (2) is now seen as an incomplete zigzag within the leading diagonal. It may not move beyond the start of intermediate wave (1) above 2,134.72. This wave count expects minor wave C to end midway within its channel, above the end of minor wave A at 2,116.48 but not above 2,134.72.
HOURLY CHART
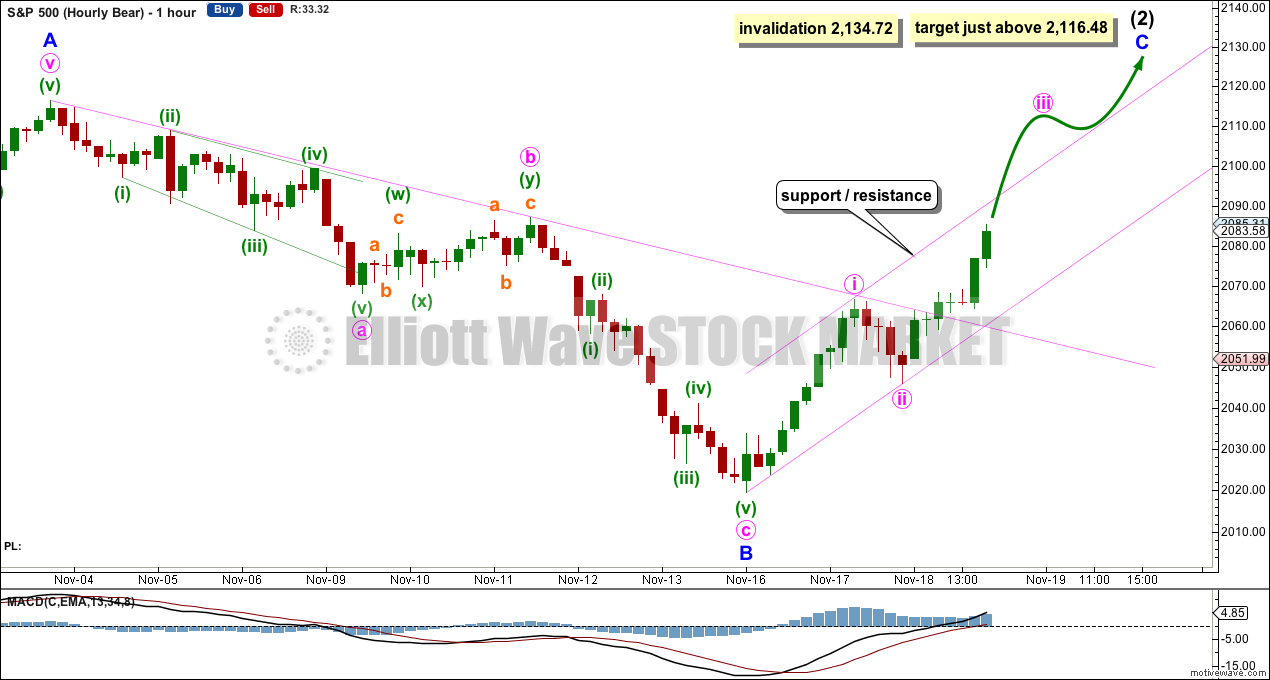
Click chart to enlarge.
All the subdivisions on the hourly chart are the same now except for the degree of labelling.
The material difference between this very bearish wave count and the first bull wave count is the invalidation point at 2,134.72.
TECHNICAL ANALYSIS
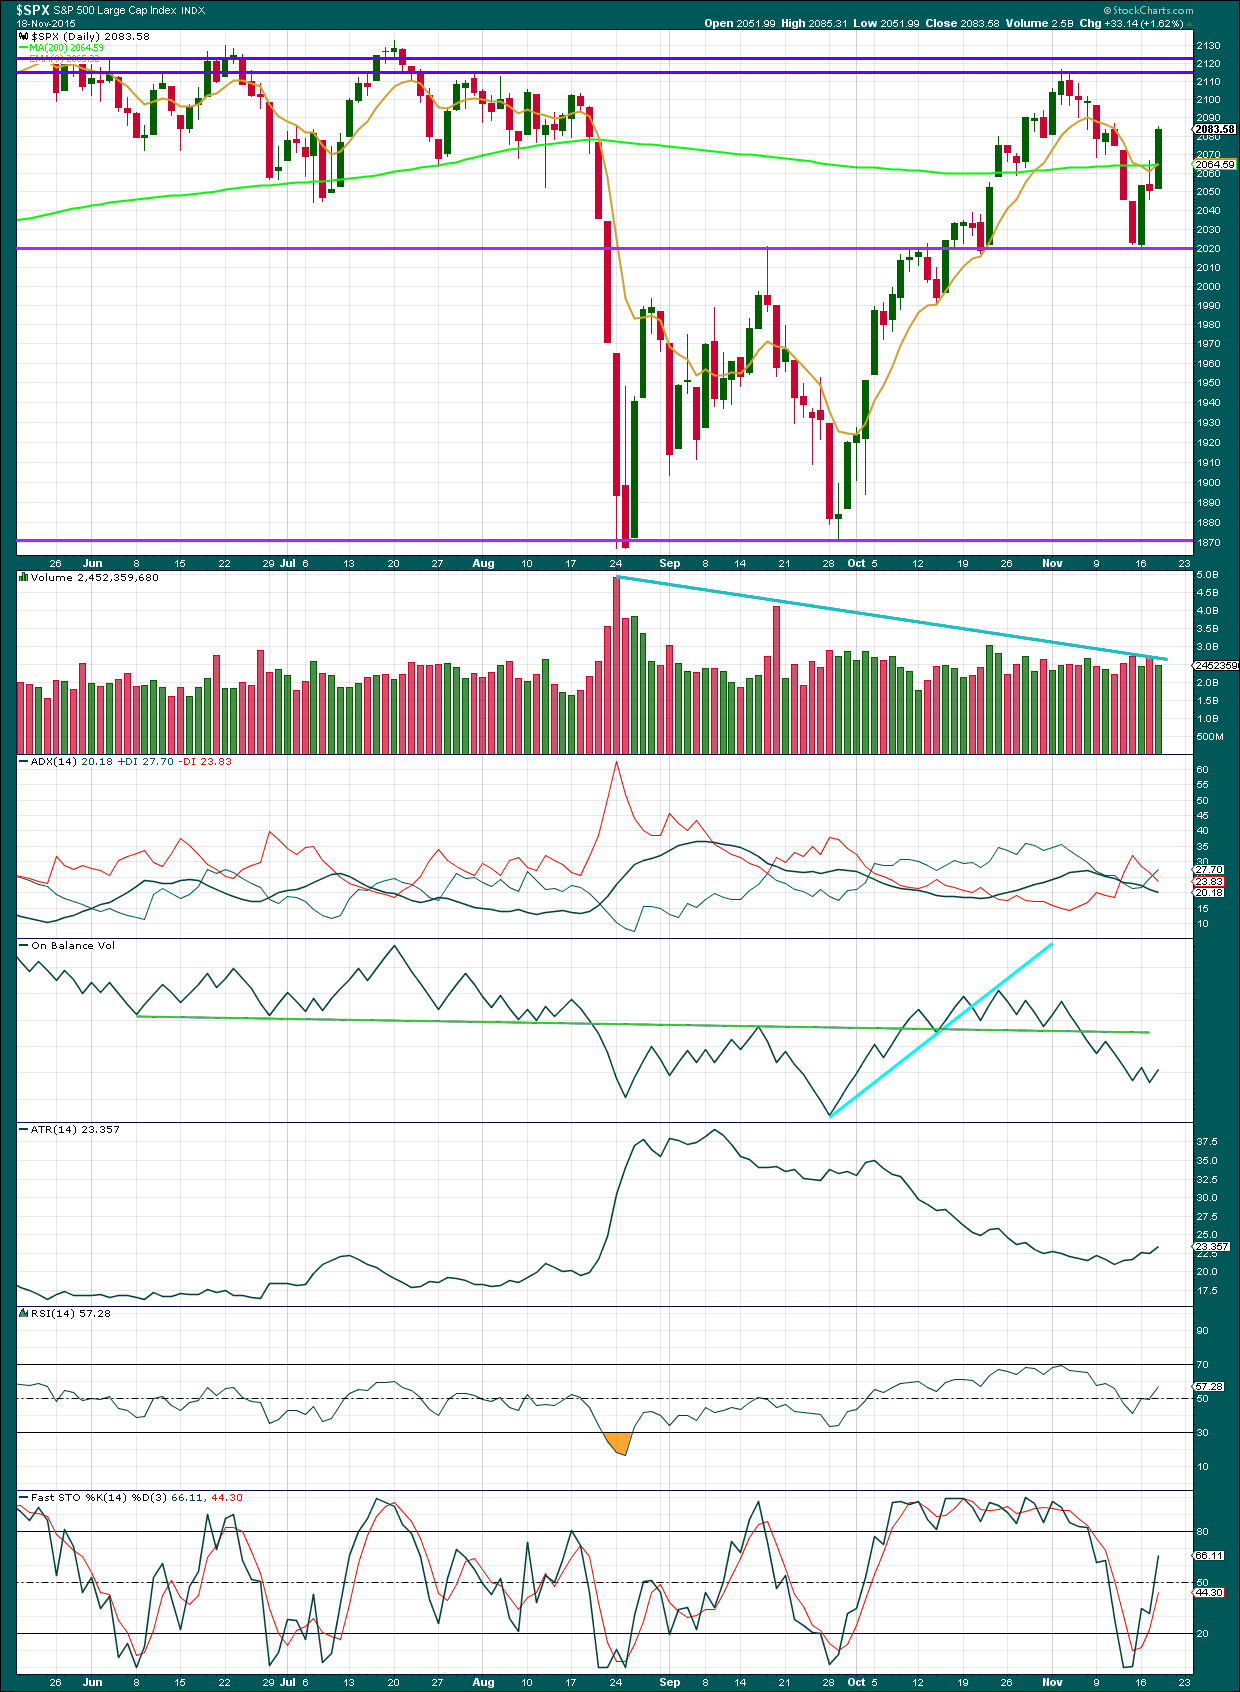
Click chart to enlarge. Chart courtesy of StockCharts.com.
Daily: A strong upwards day to close again above the 200 day moving average has necessitated a change in the wave count. However, it again comes on volume which is lighter for upwards days than it is for downwards days. Volume consistently supports downwards movement and does not support upwards movement.
The black ADX line is declining indicating the market is not trending. ATR disagrees; its range is expanding which is more typical of a trending market.
Upwards movement may continue until Stochastics reaches overbought. Two more horizontal lines for resistance are drawn. If price reaches either of these lines while Stochastics reaches overbought, then upwards movement may be expected to end there.
On Balance Volume is a reasonably reliable leading indicator. The breach of the green trend line by OBV was a very bearish signal. If OBV comes up far enough to touch that trend line, it may assist to indicate when and where upwards movement in price may come to end.
Overall, the regular technical analysis picture indicates that this upwards movement is more likely a bear market rally than the resumption of a bull market. Volume on downwards days is stronger than upwards days and overall volume is declining while price moves higher. OBV is very bearish and much of this upwards movement came with a decline in ATR.
A note on Dow Theory: for the bear wave count I would wait for Dow Theory to confirm a huge market crash. So far the industrials and the transportation indices have made new major swing lows, but the S&P500 and Nasdaq have not.
S&P500: 1,820.66
Nasdaq: 4,116.60
DJT: 7,700.49 – this price point was breached.
DJIA: 15,855.12 – this price point was breached.
To the upside, for Dow Theory, I am watching each index carefully. If any make new all time highs, that will be noted. If they all make new all time highs, then a continuation of a bull market would be confirmed. So far none have made new all time highs.
This analysis is published about 8:29 p.m. EST.
Hi
All
Closing print a grind lower and by a few points as I expected with NDX positive for the day although small but still NDX is strong and holding…
They are going to try to trap the bulls once we drop 10-12 points on the SPX and that is the BUY THE DIP area that will take us to SPX HIGHS or JUST MAYBE NEW ATH…
Hi
All,
We could drop here grinding lower -1% and then consolidate for a while – just saying before we rip higher to 2116+5 or 2116++!
Thanks,
Options2015
Case in point why NDX is holding up everything.
Nasdaq is higher, but that doesn’t mean it’s leading.
Leading would be when it turns first; either at a low or a high.
I’m not seeing that.
Lara,
O.k, I see the difference. The term higher is more appropriate and true based on price action of NDX.
Thanks,
options2014
I would not be so sure. It really depends on how the decline takes place: is it five waves down? does it break the support shelf at 2020? does it slice through the 200 day MA? If this move up is part of a correction, the next move down is not going to be a consolidation. UVXY divergence saying to be careful.
vernecarty,
I agree technically fibs are fibs and support is support until broken. I am just taking it day by day with a few scenarios. But the fact the market is NOT moving down FAST with DIP BUYERS coming to the rescue of just a few points down gives it a higher probability that WE WILL bounce from 2068 back to 2116++. Stay tuned…
vernecarty,
I am saying the move down here which is reasonable of say oh .5% on the SPX and then consolidating and then continue higher is perfectly fine 2116++. The facts are the facts – 200DMA is the key at this point as we all know. Price action warrants HIGHER prices and until we CRACK the 200 DMA we could CHOP at best. I am leaning short term bullish and LONG TERM bearish.
You could be right and those targets are not unreasonable. We could also see the market take a massive gap down and trap all the recent buyers. I think the larger question is what kind of market are we in bull or bear. I think the weight of evidence suggests the latter, which means, despite the sharp rallies we have seen which are so typical of bear markets, that the trend is down…
Lara,
The case for SPX 2150 is on deck also because that is the R1 pivot. I’ve drawn out and labeled the rising wedge and rounded top pattern as well.
Thanks,
Options2014
I see. That assumes that S&P remains in the bull market it’s been in for over 6 years now.
I see the 2,150 projection, that makes sense using the channel you’ve drawn there.
Thanks Lara. I agree this bull market is beyond ridiculous. Believe me I want it to end so we can all move on with life 🙂
Lara,
What about the concept of leading indicators. I learned a while back that both the RUSSELL 2000 and NASDAQ are leading indicators to the upside – your thoughts?
Another question:
O.k, so even if we tag 2116+ or just a bit above that price target. Then my question is what if we go higher at 2138.72 and then terminate? Will that throw off many of the wave counts making it complex?
Everything I read on technical analysis states that relationships between markets sometimes occur with one leading and another or others following, but these relationships change and are not always reliable.
You’d really have to do a proper statistical analysis of price action between Nasdaq and S&P (for example) to determine if there really is a relationship before making a statement that there is.
I don’t have the skills, time nor inclination to do that. Maybe someone else here wants to have a go at it? Stats isn’t my strong point.
I look at turning points. If a market is supposed to be leading then it should turn first at swing highs / lows. I can’t see that recently for Nasdaq and S&P.
Those are my thoughts on that.
Lara,
That makes sense now. I am still learning so that is a good direction – maybe I can pick that up later – as of now all attention on this SPX high ….
Thanks,
Options2014
If there is a new all time high then the bear wave count which I strongly favour would be invalidated.
The first main wave count would not be though.
The answer to your last question is in the analysis. It wouldn’t throw off the wave counts, it would invalidate one. The others would remain valid.
Hi
Lara,
So, here is a chart showing from a price perspective that NDX is now leading all US indices for the second time(previous high of SPX was at 2116).
Thanks for posting the charts.
I see – you’re interpreting NDX being below the others as leading prior to the downturn to the low on 24th August?
And now NDX being above the others as leading therefore the others will continue higher?
If I’ve interpreted your chart incorrectly please let me know.
I have a different understanding of what leading means. My understanding is that a leading market as an indicator will turn first, leading as indicating a trend change from bull to bear or vice versa.
Correct, I had used the wrong term. Higher is more appropriate in my view on the NDX 100.
On the hourly chart I can now see the subdivisions within minor wave 3.
The invalidation point can now be moved up to the high of minor wave 1 at 2,066.69.
If minute waves iii and iv have completed today then minute iii is very slightly shorter than minute i. That limits minute v to no longer than minute iii so that the third wave is not the shortest, a core EW rule. The limit is 2,101.
I must have an alternate labelling for this too though. Minute iii may be extending. I will move the degree of labelling within minute iii down one degree, and so that would see a series of three first and second waves now complete; minor 1 and 2, minute i and ii, now minuette (i) and (ii). Invalidation point for this idea 2,078.76. More upwards movement expected, no limit for minute iii (apart from no new all time high expected).
hi
all,
I am going to make a bold call now based on all that I am seeing. I think we will go after the ALL TIME HIGHS of the S&P 500 at 2134.72. We could just park it right just 1 point below there at 2133. Probably happens within 1-2 weeks from now.
Best Regards,
options2014
Hi Options,
The NAT high idea has been around for a while , do you have any sources for your call or is it just a “hunch”?
John,
I have been actively involved in a technical trading community for quite sometime. Trading this market day in and day out. I can put up some charts later. But I guess I was just emphasizing that the path there could take upto 1 month.
The idea of a NEW ATH was dropped last time we got rejected at 2116. So – i was just saying – the most extreme case is 2160-2180 but that is a shot at the upper trend line.
A chart or a technical reason would be most appreciated.
If we can see your reasoning then we can follow it.
If it’s just a prediction with no apparent basis we cannot follow it. And we can’t learn anything from it.
And my curiosity isn’t satisfied 🙂
Lara,
o.k, I am drafting it with fibs for further review…
thanks,
options2014
Thank you.
Hi
Lara,
O.k, I am looking for 2138 to be precise(161.8 percent Fib extension of October ’07 to March ’09 decline). I just drafted a quick chart of the SPX. I realize the bollinger band is resistance at 2120 but in general price can overshoot that. So, my perspective is if we break above the bollinger band at 2120 we could go for what is called a “BAND RIDE” for a few days and that could very well give us the inertia to hit 2138. Attached is the chart with paths I think are most likely.
1. SPX moves down to 2067-2068
2. SPX moves up to 2138
3. SPX moves down to 1871 and lower over the next 3.5 months.
All speculation.. Your thoughts appreciated….
Thanks,
Options2014
Looking like the gold miners have finally bottomed. A bit under water on my bullish put spread but gave myself a lot of time as I tend to be early. Mid-dated calls on GDX and NUGT looking VERY attractive.
hi
all
Market grinding sideways that is temporary bullish…
hi
All,
We could grind lower and then up. Bullish weeks next 2 weeks and seasonality favors higher prices. It is all about the FED day in December for market direction maybe….
hi
all
I got my vix gap fill at 16.25.
hi
all
We should see a retrace today before we move higher…
Of interest 60MIN ES price turned at an old gap & pivot line :Far left side of the chart.
RSI looks like it topped out over night
ES DAILY 3:05 pm Euro time Up against resistance at the channel top & fib line
SPX daily Cash At tht close ;Up against Fib line resistance: RSI still on the way up
chart
Short term indicators getting overbought
Longer term indicators a mixed bag to my eyes
Hi Lara,
re the bear count, would you really expect to get a truncated fifth wave ending Intermediate wave 1 black?
After a move that goes “too far too fast” a truncation is entirely possible.
That third wave down most certainly fits the description of too far too fast.
Hi
Lara,
O.k, your projected detailed examination sounds excellent for the S&P 500, but what about the NDX 100 doesn’t that have weight in this measured move up. When I said highs I was looking specially for NDX 100. What do you think about NDX 100 dragging all the US Indices to higher prices? I got a price target of 4816. Is that likely given the fact you stated slightly higher SPX 2116? Can the S&P stall at the highs while NDX resumes higher? If so, how high can the NDX 100 go from your perspective?
They’re separate markets, they have separate wave counts.
Ultimately I do not expect any of the indices; Nasdaq, DJIA, DJT or S&P500 to make new all time highs.
Lara,
O.k, thanks. I just thought since tech is leading the NDX 100 should go up marginally higher but not by to much. I have been following all US indices and noticed how each moved inline with the S&P over the years.
Thanks,
Options2014
I would disagree that Nasdaq is leading S&P500.
The ATH for S&P was 20th May 2015. The ATH for Nasdaq came after that, 20th July 2015.
The last two swing lows: both markets made their lows 24th August, then again September 29th.
If any index is leading another it may be DJT. That made it’s ATH in November 2014, first of all of them. But the last two lows, same dates as S&P and Nasdaq.
So if one index (most likely DJT) was leading then that relationship may no longer be viable. They seem to be in synch at this time.
Lara,
Thanks – Sorry, I was trying to say on this last final final(NO JINX)run up that NDX will most likely go the highest. We could very well see that. My open target is 4816. Lets see if we can tag it 🙂
My on-going thesis on the extraordinary delusions of crowds was marvelously illustrated by yesterday’s market action. It was supposedly ignited by great confidence in the Fed’s assurances about a rate hike coming in December. If you see this kind of manic response (on low volume no less) on a mere suggestion from the Fed about the possibility of a rate hike, what kind of response do you think we are going to see when they actually state there won’t be one…? Meanwhile Japan quietly enters yet another recession, Abenomics notwithstanding. Consider yourself forewarned, and pay attention to the lady’s analysis.
Thanks vernecarty.
Actually, If you could take a well rounded guess – do you think we can get down to 1900 in December 2015?
This market is so unpredictable the mania could easily continue for several weeks. At some point there is going to be a sudden and collective realization of the market’s financial peril (possibly due to some kind of exogenous shock) and everyone is going to head for the exits at the same time. A lot of circuit breakers are going to trigger and exiting positions could become difficult as bid ask spreads approach ludicrous levels, assuming any trading continues. Scalping this rally is smart, getting comfortable in long positions in this market is not. I think we take out the 2116.48 tomorrow or early next week (seasonal positive bias now in play) and we get a strong move down- I expect this move to take out 1871 cleanly. I think a three month horizon for option players is the safest approach though. These banksters are not going to go quietly 🙂
vernecarty,
I agree on some of your points. I just have a 1% higher marker for my SPX CASH Target which isn’t worth chasing long to the upside but worth waiting for a short entry. This could very well go into December 11, 2015.
Although it does not always show up on regular charts, there are some indicators that show when the smart money is making big bets. Can you think of a more one-sided recent conviction than the current one that the Fed will raise rates in December? You know what they say about the crowd. The point is that there are going to be some early indicators of the smart money getting positioned way ahead of any Fed announcement which is going to be for the victims. I will keep an ear to the ground and post here…
I am trying to “steal” some SPY December 200 expiration puts for a buck. Maybe some market-maker will show me a bit o’ love… 😀
Anybody buying today’s mini dip?
vernecarty,
I would be cautious on the short here since it is only a hand full of points. I have a target retrace around SPX 2067-2070 CASH level maybe in a couple days if you are lucky by tomorrow morning. I draw the line for a downward trend at 2058 on a closing basis.
vernecart
Japan enters recession and nikkei up – doesn’t matter…
Not unusual for equities to lag…