
Upwards movement was expected to end about 2,061.
Price moved higher to reach 2,066.69 and turned downwards from there to complete a red doji.
Summary: The trend is still down. Tomorrow’s target is 2,018. If this is wrong, it may not be low enough. Bear markets can move fast and the rallies can be deep. While price remains below 2,068.24 expect downwards movement tomorrow. At this stage, only a new low below 1,871.91 would invalidate the very unlikely idea that the S&P is in a bull market.
To see how each of the bull and bear wave counts fit within a larger time frame see the Grand Supercycle Analysis.
To see last analysis of weekly and monthly charts click here.
If I was asked to pick a winner (which I am reluctant to do) I would say the bear wave count has a higher probability. It is better supported by regular technical analysis at the monthly chart level, it fits the Grand Supercycle analysis better, and it has overall the “right look”.
New updates to this analysis are in bold.
BULL ELLIOTT WAVE COUNT
DAILY CHART – COMBINATION OR FLAT
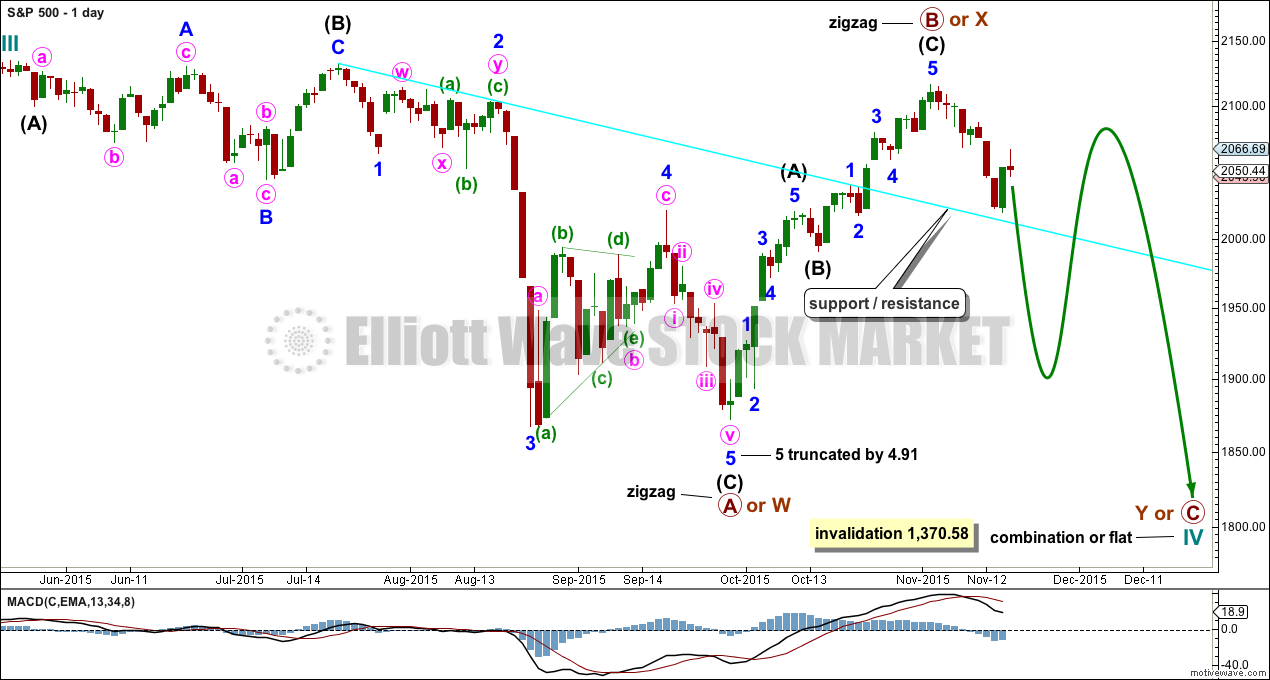
Click chart to enlarge.
Cycle wave IV should exhibit alternation to cycle wave II.
Cycle wave II was a shallow 0.41 zigzag lasting three months. Cycle wave IV should exhibit alternation in structure and maybe also alternation in depth. Cycle wave IV may end when price comes to touch the lower edge of the teal channel which is drawn about super cycle wave V using Elliott’s technique (see this channel on weekly and monthly charts).
Cycle wave IV may end within the price range of the fourth wave of one lesser degree. Because of the good Fibonacci ratio for primary wave 3 and the perfect subdivisions within it, I am confident that primary wave 4 has its range from 1,730 to 1,647.
If a zigzag is complete at the last major low as labelled, then cycle wave IV may be unfolding as a flat, combination or triangle.
Primary wave B or X upwards is a single zigzag. Upwards movement has reached above 2,108.44. Primary wave B has passed the minimum requirement for a flat correction of 90% the length of primary wave A, and so cycle wave IV may be unfolding as a flat correction.
Cycle wave IV may also still unfold as a combination: zigzag – X – flat. Both a flat or combination would provide alternation with the single zigzag of cycle wave II.
If cycle wave IV is unfolding as a combination, then primary wave Y should be a flat correction. Within primary wave Y, minor wave B may make a new high above the start of minor wave A at 2,116.48 as in an expanded flat. There is still no upper invalidation point for this wave count at the daily chart level for this reason.
Primary wave A or W lasted three months. Primary wave Y or C may be expected to be about the same, about three months in total.
DAILY CHART – TRIANGLE
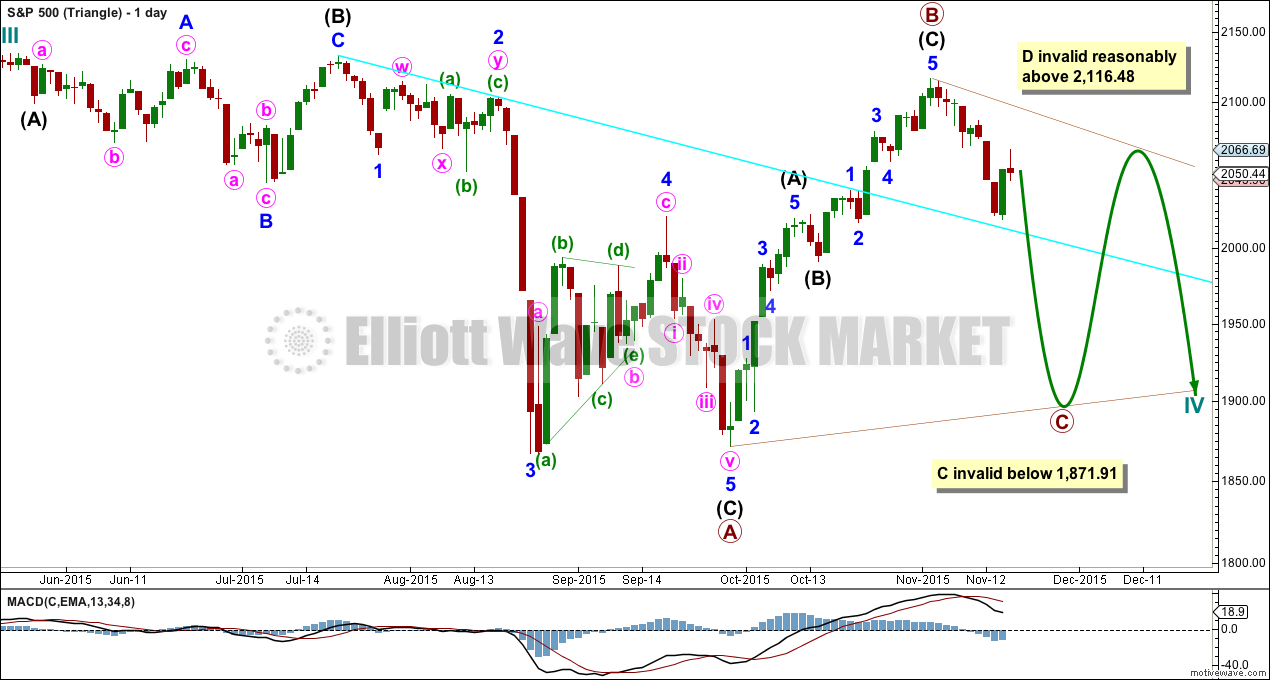
Click chart to enlarge.
Cycle wave IV may unfold as a shallow triangle. This would provide alternation with the 0.41 zigzag of cycle wave II.
Primary wave B may be unfolding as a zigzag.
Primary wave C may unfold as a single or double zigzag. Within primary wave C, minor wave B may not move beyond the start of minor wave A above 2,116.48.
Primary wave C of a barrier or contracting triangle may not move beyond the end of primary wave A at 1,871.91.
The whole structure moves sideways in an ever decreasing range. The purpose of triangles is to take up time and move price sideways. A possible time expectation for this idea may be a total Fibonacci eight or thirteen months, with thirteen more likely. So far cycle wave IV has lasted six months.
HOURLY CHART
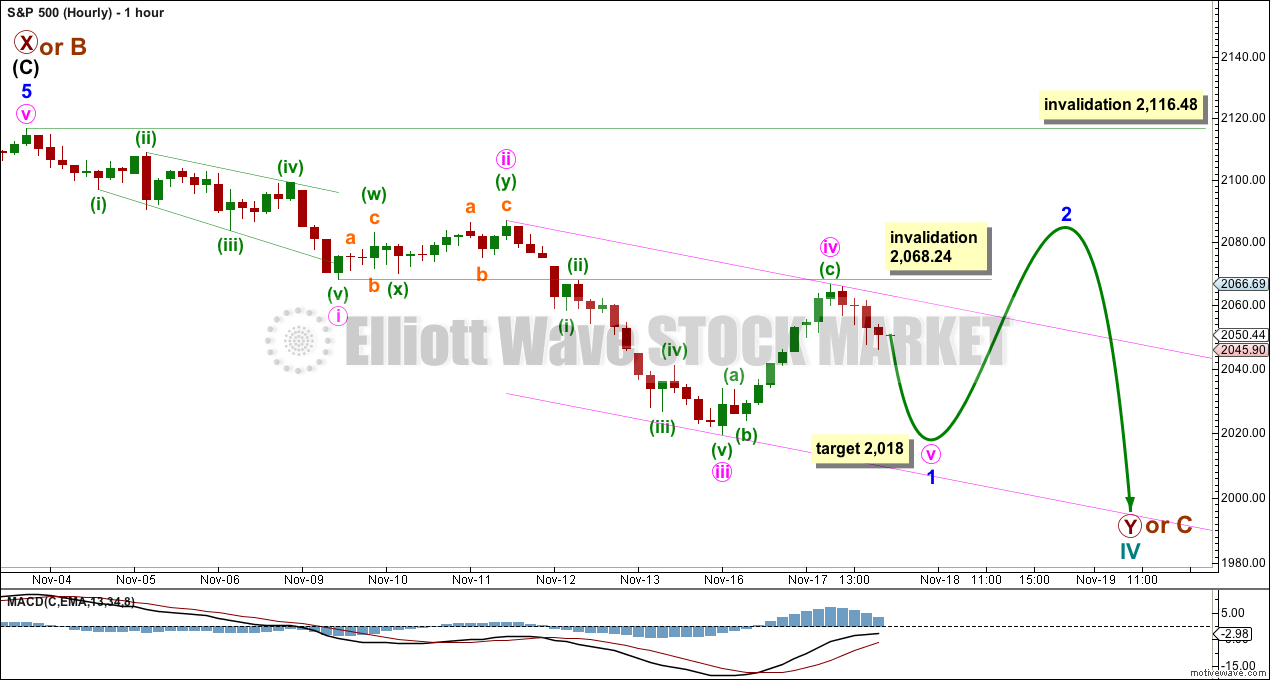
Click chart to enlarge.
This first hourly chart and the one presented below for the bear wave count both work in the same way for both wave counts. Downwards movement may have begun with a leading expanding diagonal for a first wave, followed by a shallow double zigzag for a second wave.
This first idea still looks more likely. The proportions between minute waves ii and iv are better than proportions on the second hourly wave count.
Minute wave iv may have completed during Tuesday’s session as a deep single zigzag. There is alternation between the shallow double zigzag of minute wave ii and the deep single zigzag of minute wave iv. It is not perfect, but it is acceptable.
Redraw the channel about this downwards movement using Elliott’s second technique: draw the first trend line from the ends of minute waves ii to iv, then place a parallel copy on the end of minute wave iii. Minute wave v may end midway within the channel or at the lower edge. Along the way down, corrections should find resistance at the upper edge.
If this wave count is wrong, then the first indication would be a breach of the upper edge of the channel.
At 2,018 minute wave v would reach equality in length with minute wave i. This would complete a five wave impulse downwards. This may be minor wave 1. Minor wave 2 may not move beyond the start of minor wave 1 above 2,116.48.
If the target for minor wave 1 is wrong, then it may not be low enough. Bear markets can move surprisingly fast. Expect any surprises for this wave count to most likely be to the downside.
ALTERNATE BULL ELLIOTT WAVE COUNT
DAILY CHART
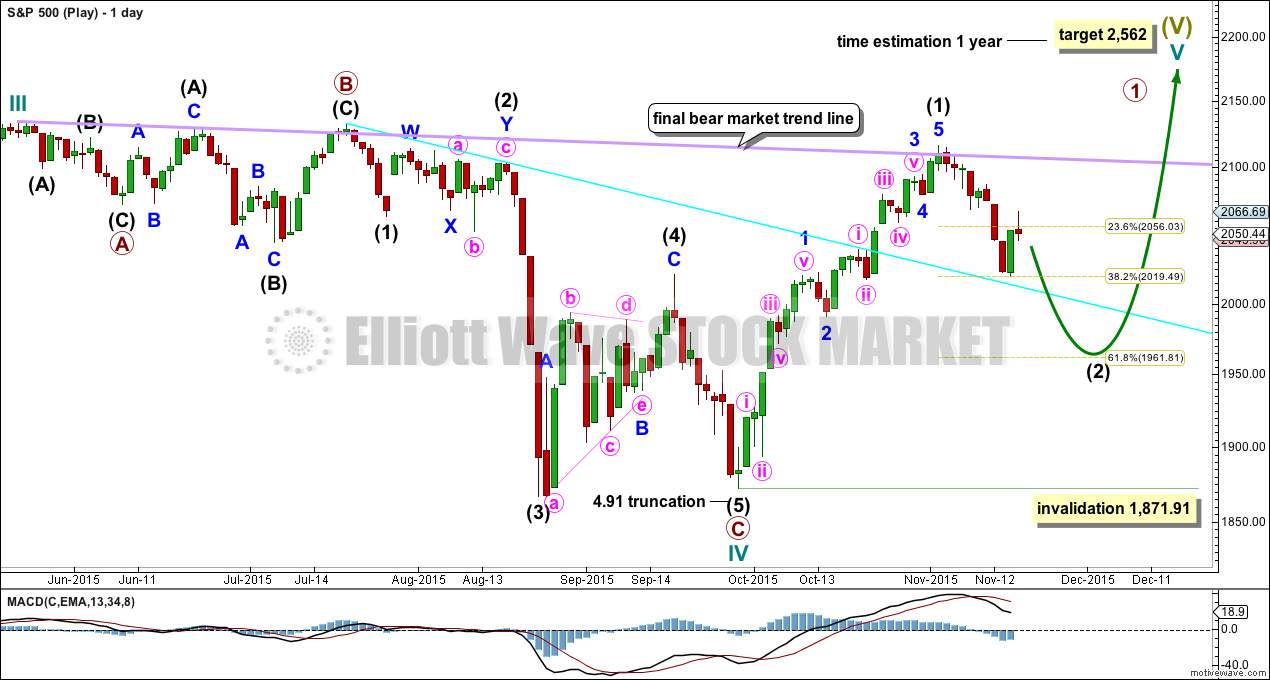
Click chart to enlarge.
It is possible to see cycle wave IV a completed flat correction. This would provide some structural alternation with the zigzag of cycle wave II.
This is a regular flat but does not have a normal regular flat look. Primary wave C is too long in relation to primary wave A. Primary wave C would be 3.84 short of 4.236 the length of primary wave A. While it is possible to also see cycle wave IV as a complete zigzag (the subdivisions for that idea would be labelled the same as the bear wave count below, daily chart) that would not provide structural alternation with the zigzag of cycle wave II, and so I am not considering it.
This idea requires not only a new high but that the new high must come with a clear five upwards, not a three.
At 2,562 cycle wave V would reach equality in length with cycle wave I. Cycle wave I was just over one year in duration so cycle wave V should be expected to also reach equality in duration. Cycle degree waves should be expected to last about one to several years, so this expectation is reasonable. It would be extremely unlikely for this idea that cycle wave V was close to completion, because it has not lasted nearly long enough for a cycle degree wave.
I added a bear market trend line drawn using the approach outlined by Magee in “Technical Analysis of Stock Trends”. When this lilac line is clearly breached by upwards movement that shall confirm a trend change from bear to bull. The breach must be by a close of 3% or more of market value. If it comes with a clear five up, then this wave count would be further confirmed.
While price remains below the bear market trend line, we should assume the trend remains the same: downwards.
The impulse upwards for intermediate wave (1) is today adjusted. The subdivisions fit on the hourly chart. It is possible to see intermediate wave (1) a complete five wave impulse. Intermediate wave (2) may continue lower towards the 0.618 Fibonacci ratio of intermediate wave (1) at 1,962. It may not move beyond the start of intermediate wave (1) below 1,871.91.
This wave count does not have support from regular technical analysis and it has a big problem of structure for Elliott wave analysis. I do not have confidence in this wave count. It is presented as a “what if?” to consider all possibilities.
BEAR ELLIOTT WAVE COUNT
DAILY CHART
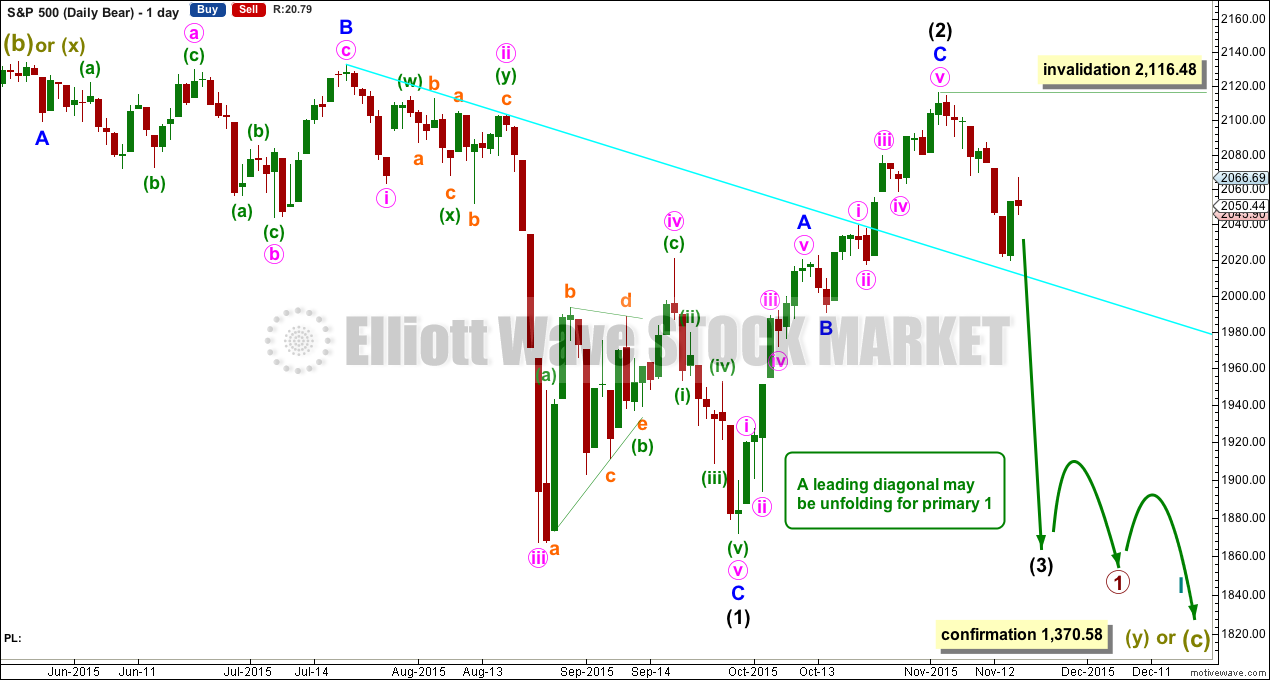
Click chart to enlarge.
This bear wave count has a better fit at Grand Super Cycle degree and is better supported by regular technical analysis at the monthly chart level. But it is a huge call to make, so I present it second, after a more bullish wave count, and until all other options have been eliminated.
There are two ideas presented in this chart: a huge flat correction or a double flat / double combination. The huge flat is more likely. They more commonly have deep B waves than combinations have deep X waves (in my experience).
A huge flat correction would be labelled super cycle (a)-(b)-(c). It now expects a huge super cycle wave (c) to move substantially below the end of (a) at 666.79. C waves can behave like third waves. This idea expects a devastating bear market, and a huge crash to be much bigger than the last two bear markets on the monthly bear chart.
The second idea is a combination which would be labelled super cycle (w)-(x)-(y). The second structure for super cycle wave (y) would be a huge sideways repeat of super cycle wave (a) for a double flat, or a quicker zigzag for a double combination. It is also possible (least likely) that price could drift sideways in big movements for over 10 years for a huge triangle for super cycle wave (y).
The bear wave count sees a leading diagonal for a primary degree first wave unfolding. Within leading diagonals, the first, third and fifth waves are most commonly zigzags but sometimes may appear to be impulses. Here intermediate wave (1) is seen as a complete zigzag.
No second wave correction nor minor wave B may move beyond the start above 2,116.48 within intermediate wave (2).
Intermediate wave (3) must move beyond the end of intermediate wave (1) and it would most likely be a zigzag.
HOURLY CHART
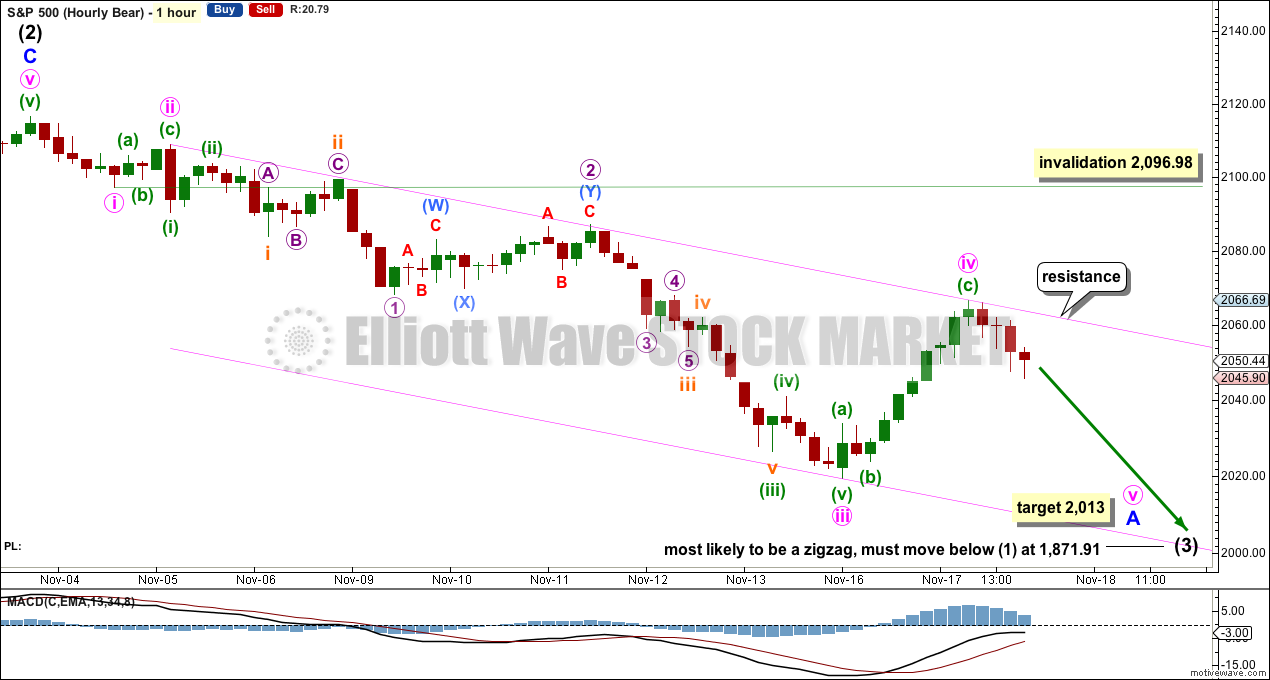
Click chart to enlarge.
Because I have two hourly charts which both expect a five down to be unfolding at the hourly chart level I am using them to illustrate two ideas. Both hourly charts work in the same way for both daily bull and daily bear wave counts.
Because leading expanding diagonals are not very common, and because they are normally followed by deep second waves when they do occur, the first idea presented for the bull wave count has problems.
An impulse is a more common structure for a first (or A) wave. If an impulse is unfolding downwards, then the middle may have recently passed and a series of fourth wave corrections may be underway.
This wave count no longer has the right look at the hourly chart level. The proportions look wrong. This upwards correction looks more like a fourth wave corresponding to the second wave labelled here micro wave 2. However, this wave count remains valid and sometimes the S&P does not always exhibit good proportions. If the first idea is invalidated, then this idea would be used for both bull and bear wave counts at the hourly chart level.
Minute wave iv may not move into minute wave i price territory above 2,096.98.
Minute wave v down may reach 0.618 the length of minute wave iii at 2,013.
When a channel is drawn about this possible impulse downwards the upper edge now looks right. Draw the channel using Elliott’s second technique: the first trend line from the ends of the second to fourth waves, then a parallel copy on the end of the third wave. The lower edge may provide support and the upper edge may provide resistance for corrections against the trend on the way down.
TECHNICAL ANALYSIS
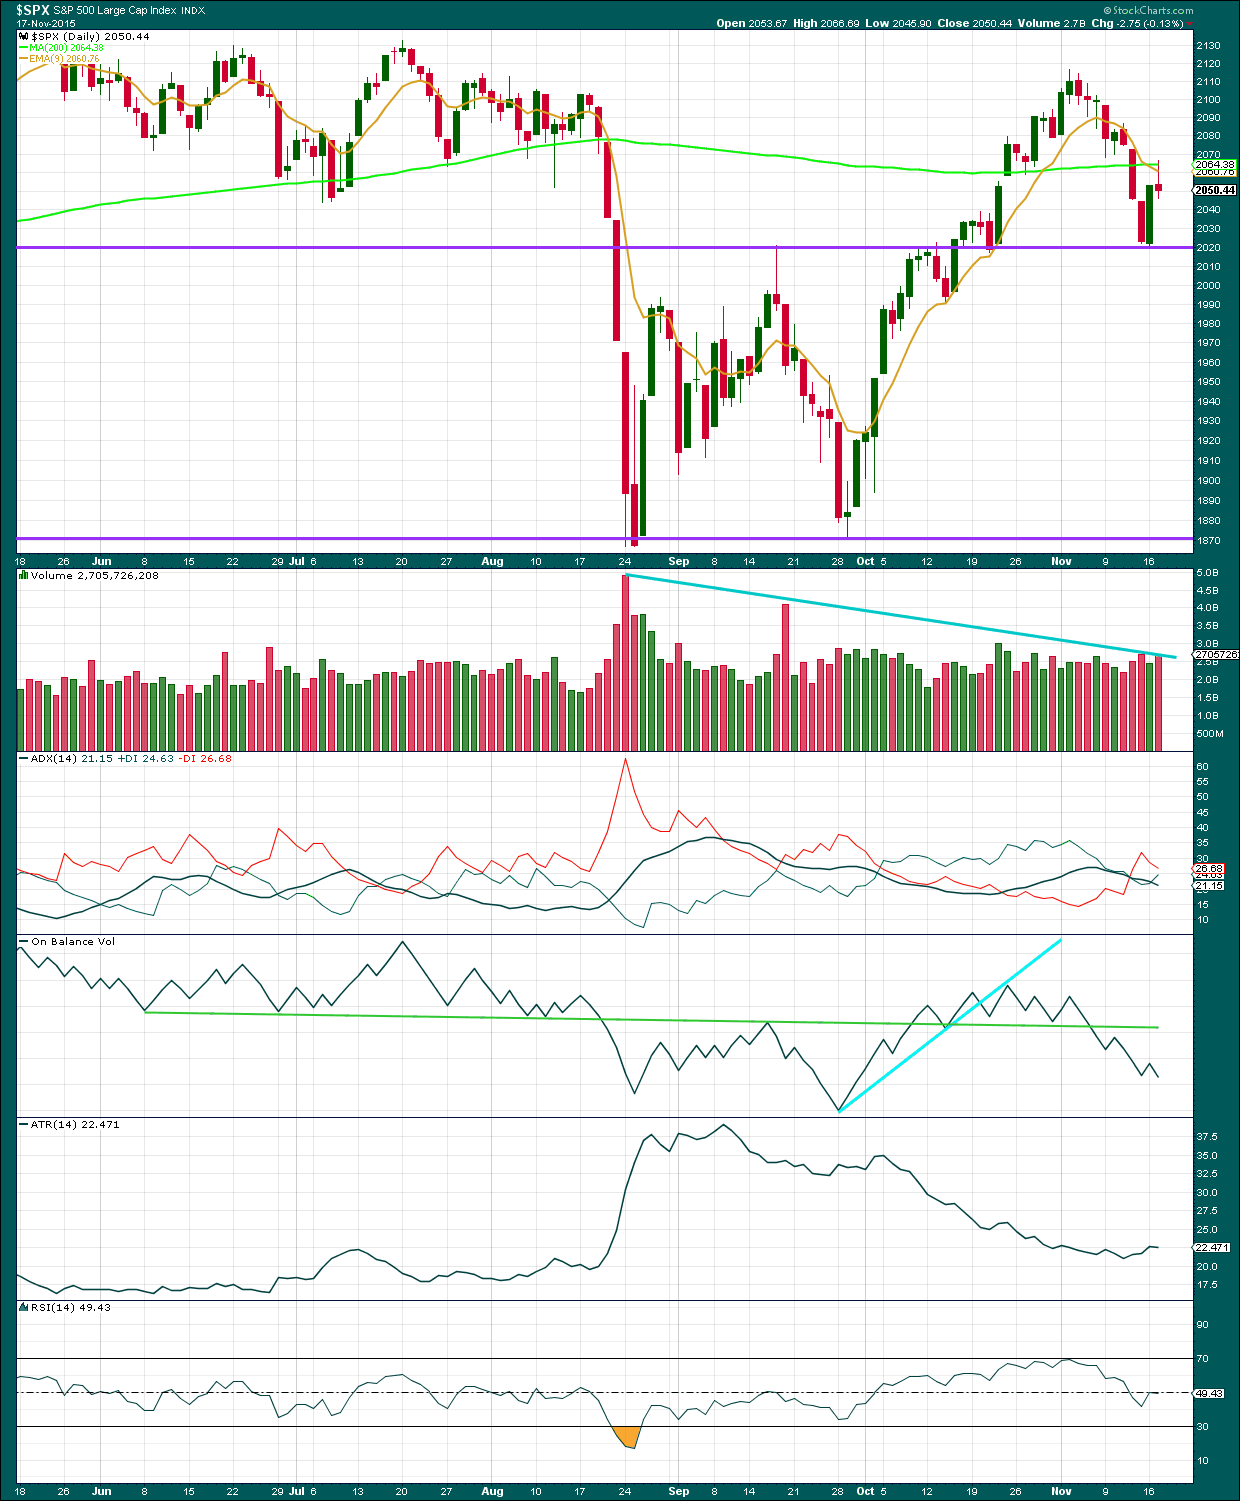
Click chart to enlarge. Chart courtesy of StockCharts.com.
Daily: The bullish engulfing candlestick pattern has not been followed by another green candlestick. At this stage, confidence that price may continue higher from here as indicated by the pattern is low. Price seems to be finding resistance at the 200 day moving average and support at the horizontal trend line. Price will break out of this small zone and volume indicates a downwards breakout is more likely than upwards.
Today’s small red candlestick with a long upper shadow is bearish. Slightly lighter volume though does not well support the fall in price.
The +DX and -DX lines have crossed indicating a trend change. ADX does tend to be a lagging indicator (it is based on moving averages which necessarily are lagging). If the black ADX line turns upwards in the next few days, then a downwards trend would be indicated. For now the ADX line is flat not yet quite indicating a trend.
ATR may be beginning to turn upwards indicating a period of expanding range may be beginning. This would support a new trend.
On Balance Volume is a leading indicator and usually works well with trend lines. At this stage, OBV remains below the green trend line. This line is very shallow, repeatedly tested, reasonably long held, and highly technically significant. The breach of OBV below that line is a reasonably strong bearish signal and supports all wave counts with the exception of the very bullish “alternate bull Elliott wave count” which has no technical support at all.
A note on Dow Theory: for the bear wave count I would wait for Dow Theory to confirm a huge market crash. So far the industrials and the transportation indices have made new major swing lows, but the S&P500 and Nasdaq have not.
S&P500: 1,820.66
Nasdaq: 4,116.60
DJT: 7,700.49 – this price point was breached.
DJIA: 15,855.12 – this price point was breached.
To the upside, for Dow Theory, I am watching each index carefully. If any make new all time highs, that will be noted. If they all make new all time highs, then a continuation of a bull market would be confirmed. So far none have made new all time highs.
This analysis is published about 7:43 p.m. EST.
Hi
All,
I could be wrong on my assumption but todays candle voted to me that the market wants higher pricers – so I am just throwing it out there… Trade safe!
Hi
All,
I made my case for new highs. Please review below….
Best Regards,
-options2014
SOB!
John,
Take a deep breath. Don’t fight the tape!
I am probably the only trader adding to my short positions on this move up. Looks like we may make a slight new recovery high above 2116.48 but I do not believe all-time new highs are in the cards. Impressive though it is, it still looks, walks, and quacks like a dead cat bounce. Hoping to get filled on my stink-bid of one buck for Dec UVXY 50 calls.
A slight new high above 2,116 is now what I’m going to expect too.
This strong upwards day does not look like part of the prior wave down. It’s too high and too big.
This looks like a new wave.
Lara
When you say new wave. What is your target for NDX 100 on this measured move up?
vernecarty,
Believe me I am a bear of bears. However, given the volatility i am temporary bullish and closed all my short and further holding a short at these levels can loose significant value. I would personally just wait until we tap out at 2116+ and then re-short. Those contracts would just get crushed when the market moves up the remaining SPX points on the upside left.
Thanks,
-options2014
Excellent strategy. I closed my long positions on the big move up today and switched tactics for the rest of wave three and five up. I am trying to build a massive short position by opening credit spreads that will let me scalp the rest of the upward move but be ready for the reversal by closing half the spread for a small profit. I don’t mind missing some of this move up to ensure the bear does not have me for lunch when he pounces. I actually like this final manic movement up as it is confirming the upcoming intermediate wave down is going to be a barn burner. Every time UVXY falls below 30 call options one month out is money lying in the corner. It is almost certainly going to make a new 52 week low below 24.34 and when it does…BACK UP THE TRUCK PEOPLE! 😀
vernecarty,
Thanks, I thought about that too but you usually get the best prices at the most extreme moves up for a short position – the key is having the order ready to execute and since I am actually looking at real time quotes I can get out near or around the exit target 2116+. So, we actually might even hit the SPX target 2116+ by this Friday given how fast the futures action is now.
Thanks,
Options2014
vernecarty,
A dead cat bounce would be after a significant low – i think in our case we only pulled back to around 2000 then we sky rocketed higher from 1998 S&P futures just Monday morning and now at 2083 (4% in just 3 days) CRAZY. The strength is clear and the BULLS are still on drugs so let them drive this market higher – all the better for us to SHORT…
Thanks,
options2014
Oh yeah…the higher they go, the harder and the farther they fall. By the way, the idea of the DCB is that it bounces because people do not yet realize that the cat is dead. It will take a new all time high to negate the idea. I suspect the next wave down won’t see any meaningful bounces, dead cat or otherwise. Stay nimble!
I’m still going to have two hourly charts looking at this downwards movement in two different ways.
The first chart (to follow on from the first one above here): will now see minute waves iii, iv and v complete at the last low. The proportion which looked good between minute ii and iv is lost. But it is possible that a five wave impulse ended at the last low which means this upwards movement could be a deep second wave correction. It’s closing in on the 0.618 Fibonacci ratio at 2,079.
The second hourly chart will be the same as that above. It too has a problem of proportion between minute ii and minute iv. This upwards movement may be a fourth wave, not a second wave correction.
Either way this upwards movement is most likely a correction and not the start of a new trend. Even for the very bullish wave count (in which I have no confidence) it should be a B wave.
How high can rallies in bear markets go? Very high indeed. Deep and sharp they often are. All invariably to be fully retraced. And they always make us very nervous and convince us there is no bear market… right before it takes off. I think that is their psychological purpose.
Will spend some time today looking for alternates…. what if that last wave down isn’t an impulse? What if its a zigzag? How would that fit into the bigger picture?
I agree. Earlier this morning I rechecked your hourly charts and started thinking that we had a complete wave down and were now looking at a deep second wave action. If that is the case, the re-capture of the 200 day MA will be short-lived. I still think this is a classic bull trap. Lots of shorts are going to be running for the hills today. 😀
Some analysts who use the Coppock tea leaves combined with Elliott are counting the 2116 high as a lower degree a-wave and the subsequent decline as the b-wave. And what we are seeing now is a c-wave rally to carry the index right back up there and possibly all-time highs.
Their backing was in the weekly Coppock indicators which look bullish for the end of the year apparently. I haven’t looked at the count though.
It is most certainly an idea I am charting and considering.
Lara,
What is the relationship of how the markets react with interest rate changes on the horizon. In general is it a delayed reaction historically or after the fact that it actually happens?
Elliott wave theory states that it is social mood, not anything else, which moves markets.
So interest rate changes don’t move the market. Social mood determines interest rate changes (because that too is a market and would have its own EW count) and social mood determines market movement.
Not a popular concept, but that’s Elliott wave.
Lara,
Thank you. NDX new highs past the year 2000 on deck 4816+ then roll this market over?
S&P hit 2068.44 this morning. Does that change anything?
thx
Norman
It doesn’t mean anything. We got a gap fill at SPX Cash Index – 2075 it should fail here. If not all time highs are in the cards for mid December 2015…
closed at 2083…..
Norman,
Exactly, i gave hypo 2 in my statement following. So, given the bullish candle today the market has voted to me UP – UP and away.
Norman
Gap fill hit SPX 2075 – MAGIC!
Gap, Yup
John
That is right. I say NDX LEADS the way!
vernecarty,
We are moving higher. Might see resistance on the middle bollinger band area 2072.
vernecarty,
Case in point – higher prices supported – this week is Options Expiration – most likely higher prices as usual on SPX on these type of weeks. 2080+ close it out. Would be surprised to see a reversal at 2072 here. The market continues up – no problems – no pull backs – just 1 direction…Up Up and away.
Mid December highs maybe in the cards? Who knows.
I read somewhere this is 1998. Do you buy this is 1998?
Lots of comparisons to 1998 and 1973. My view on the short and intermediate term prospects remains dependent on the on-going battle around the 200 day MA. I believe that analysis shows that currently the trend is down until PROVEN otherwise, which for me is a violation of Lara’s invalidation points and/or a strong CLOSE above the 200 day MA. My opinion is that what is happening right now is a sucker’s rally…nothing more. We’ll see soon enough.
vernecarty
ok
So far, neither VIX nor UVXY confirming new highs. While we could continue higher, I would not be surprised to see a bearish engulfing candlestick develop. The 200 day MA is formidable resistance and for the bull to stay alive he must break through it. Stay alert everybody, market-makers machinations may be afoot…
vernecarty
I don’t know if anything matters. Dollar high, Commodities getting crushed left and right WTIC for instance heading even lower. Just amazing BULLISHNESS really!
vernecarty
How many more years can we grind higher? 3 more sound good?
how many more fakeouts on the VIX?
I think the miners are tracing out final sub-waves of final wave down and very close to a rally. VIX spiked to new low, UVXY did not so far. Although maddening, this move has all the earmarks of a bear-market rally and has to be viewed as a bull trap. Let’s see if 200 day MA is held. Sold my upside hedges at 2072. If 200 day does not hold today, will be adding to my short positions.
vernecarty,
We are going to all time highs. NDX will lead the way 4816+. I checked the year 2000 price – I am going to write it down. We are going to drop from here imo – TECH is to crazy LOL
vernecarty,
A very good detailed statement – “How high can rallies in bear markets go? Very high indeed. Deep and sharp they often are. ” – Lara.
The point is imo we will continue to rise higher and higher and my instincts tell me as I stated before that this whole thing is about the NDX 100 new highs 4816+. Sit tight – this will be a very sharp rise in the next 1-2 weeks up!
Just look at the NDX 100 bullish candle today and it is passed the middle bollinger band. Everything is awesome and everyone has FOMO about FANG….
Thanks,
Posted charts above on the FTSE thread by error !
If upwards movement continues tomorrow, we will have to consider the recent lows may have been a fourth wave correction and the final fifth wave up to new highs is underway. Pretty strong assault on the 200 day MA today.
vernecarty,
Exactly as my point i stated early today before the markets blasted off. 5th waves can extended and my guess is we will have a BLOW OFF TOP the second week of December 2015. I am writing that down….
I think we are going to get the roll-over earlier. I am thinking this possible fifth wave up is of minor degree and should be over no later than sometime next week…especially if VIX makes a new 52 week low soon. VIX is notorious for making new lows on deep second wave corrections before all you-know-what breaks loose. With the transports trading so far below their all-time highs, I think the chances of new all time highs are remote as a DOW theory sell signal remains in place. Be careful out there…
vernecarty,
10.88 is the VIX 52 week low. We closed on print today at 16.85. Usually bull markets have a significant blow off top. This might just be it.
Look around. Nothing matters – who cares anymore – NDX is leading the way up and it needs to fulfill its target of 4816 and then we terminate.
Here is a little project for you. Take a look at the components of the Nasdaq and check out where the rest of the bunch beside FANG are trading. You will be surprised. I am not saying the high beta stocks can’t continue to power the index higher over the short term, but I would not fall in love with this index.
vernecarty,
Thank. I have been looking for the majority of NDX 100 stocks and I agree. My point is NDX 100 should lead and after more thought it could stall out a little over the previous highs. Either way – from an events perspective – I just thought maybe the market should go up during the release of the movie “The Big Short” and then drop but it could happen prior to the release.