
Downwards movement confirmed a third wave down is underway.
Summary: The trend is down. The alternate which allowed for more upwards movement has been invalidated. This may be a big third wave at intermediate degree unfolding. so expect any surprises to be to the downside. If price remains below 2,061.94 tomorrow, then the favoured target would be 2,009. A new high tomorrow above 2,061.94 would indicate a small fourth wave correction which should be over quickly though.
To see how each of the bull and bear wave counts fit within a larger time frame see the Grand Supercycle Analysis.
To see last analysis of weekly and monthly charts go here.
If I was asked to pick a winner (which I am reluctant to do) I would say the bear wave count has a higher probability. It is better supported by regular technical analysis at the monthly chart level, it fits the Grand Supercycle analysis better, and it has overall the “right look”.
New updates to this analysis are in bold.
BULL ELLIOTT WAVE COUNT
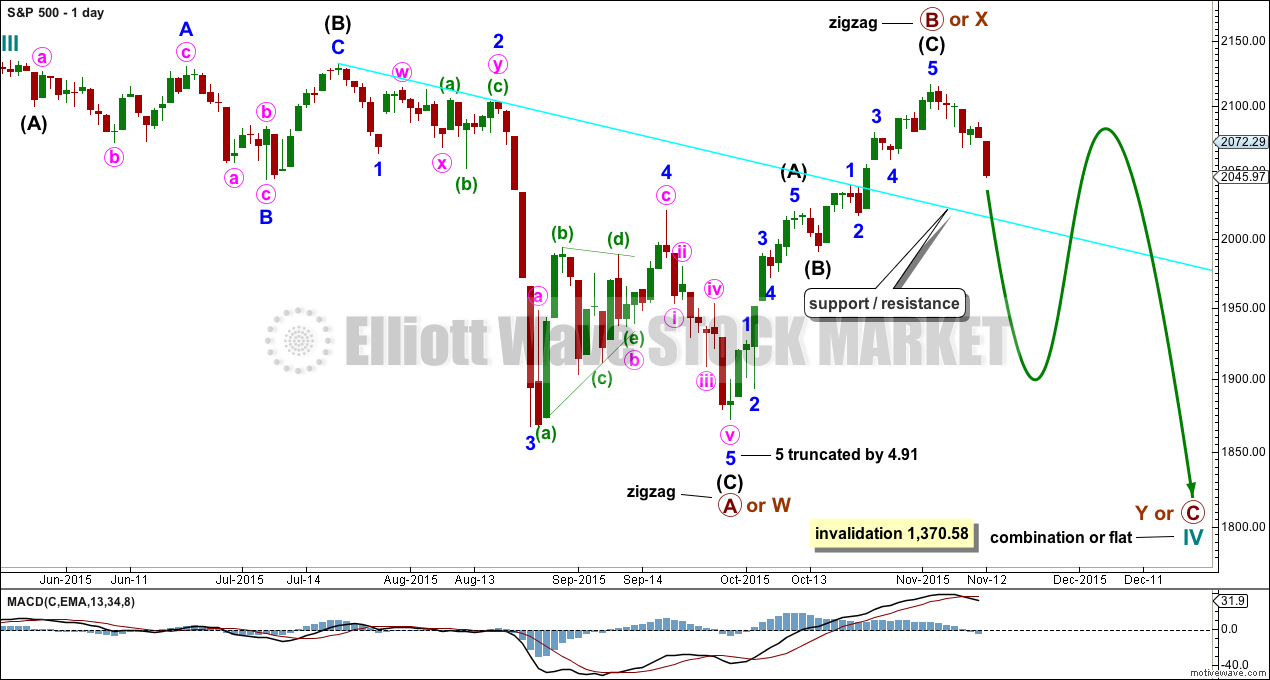
DAILY CHART – COMBINATION OR FLAT
Click chart to enlarge.
Cycle wave IV should exhibit alternation to cycle wave II.
Cycle wave II was a shallow 0.41 zigzag lasting three months. Cycle wave IV should exhibit alternation in structure and maybe also alternation in depth. Cycle wave IV may end when price comes to touch the lower edge of the teal channel which is drawn about super cycle wave V using Elliott’s technique (see this channel on weekly and monthly charts).
Cycle wave IV is may end within the price range of the fourth wave of one lesser degree. Because of the good Fibonacci ratio for primary wave 3 and the perfect subdivisions within it, I am confident that primary wave 4 has its range from 1,730 to 1,647.
If a zigzag is complete at the last major low as labelled, then cycle wave IV may be unfolding as a flat, combination or triangle.
Primary wave B or X upwards is a single zigzag. Upwards movement has reached above 2,108.44. Primary wave B has passed the minimum requirement for a flat correction of 90% the length of primary wave A, and so cycle wave IV may be unfolding as a flat correction.
Cycle wave IV may also still unfold as a combination: zigzag – X – flat. Both a flat or combination would provide alternation with the single zigzag of cycle wave II.
Primary wave B within a flat correction may make a new high above the start of primary wave A at 2,134.72 as in an expanded flat. There is no upper invalidation point for this wave count for that reason. Likewise, X waves within combinations may also move beyond the start of the first structure labelled primary wave W. There is no minimum or maximum length for an X wave within a combination.
At this stage, it is no longer likely that primary wave B or X will continue higher as a double zigzag.
Primary wave A or W lasted three months. Primary wave Y or C may be expected to be about the same, about three months in total.
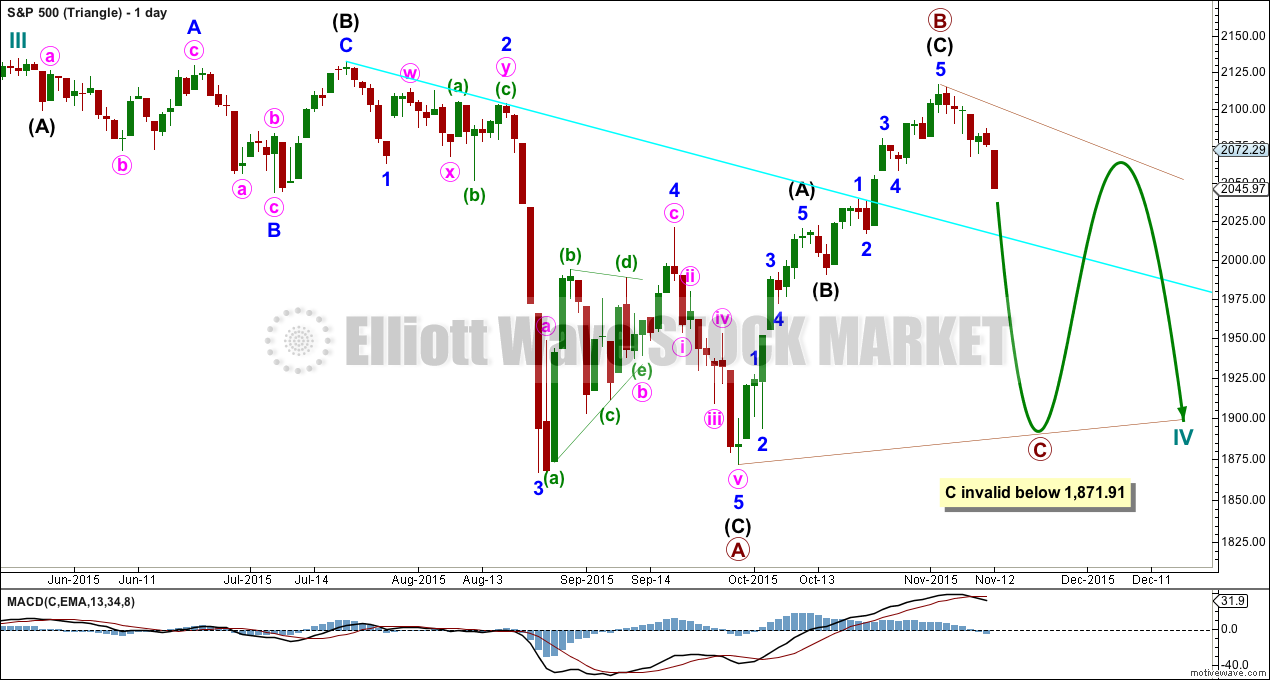
DAILY CHART – TRIANGLE
Click chart to enlarge.
Cycle wave IV may unfold as a shallow triangle. This would provide alternation with the 0.41 zigzag of cycle wave II.
Primary wave B may be unfolding as a zigzag.
Primary wave B may move beyond the start of primary wave A at 2,134.72 as in a running triangle. There is no upper invalidation point for this wave count for that reason.
Primary wave C of a barrier or contracting triangle may not move beyond the end of primary wave A at 1,871.91.
The whole structure moves sideways in an ever decreasing range. The purpose of triangles is to take up time and move price sideways.
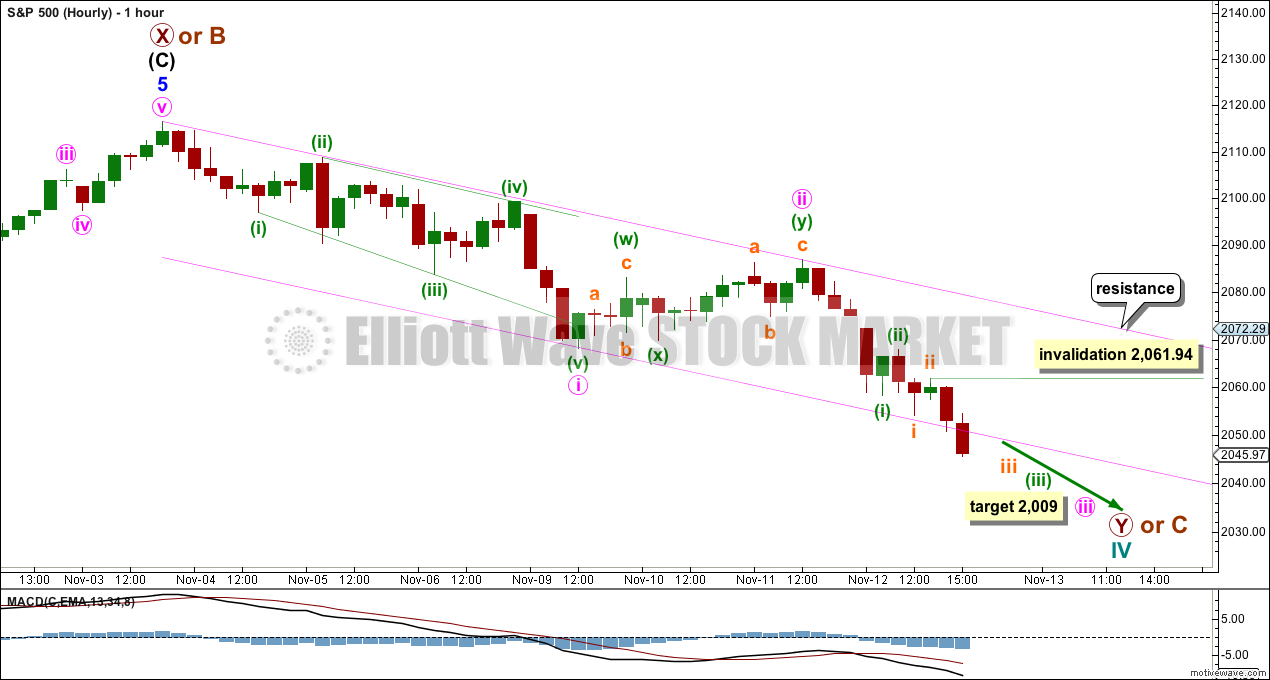
HOURLY CHART
Click chart to enlarge.
This first hourly chart and the one presented below for the bear wave count both work in the same way for both wave counts. Downwards movement may have begun with a leading expanding diagonal for a first wave, followed by a shallow double zigzag for a second wave. A third wave down may be underway and would reach 1.618 the length of minute wave i at 2,009.
The first of two overlapping first and second waves may be complete within minute wave iii. Some increase in downwards momentum would be expected for this wave count.
The pink channel is a base channel drawn about minute waves i and ii. Downwards movement in the last hour of the session breached the lower edge of that channel. Once there is a full hourly candlestick below the lower edge of the channel it will be confirming a third wave underway. The lower edge of the channel may then provide some resistance. For now the upper edge may provide resistance.
No second wave correction may move beyond the start of its first wave above 2,061.94 within subminuette wave iii. If this invalidation point is breached tomorrow, then the scenario presented on the next hourly chart for the bear wave count will be correct.
ALTERNATE BULL ELLIOTT WAVE COUNT
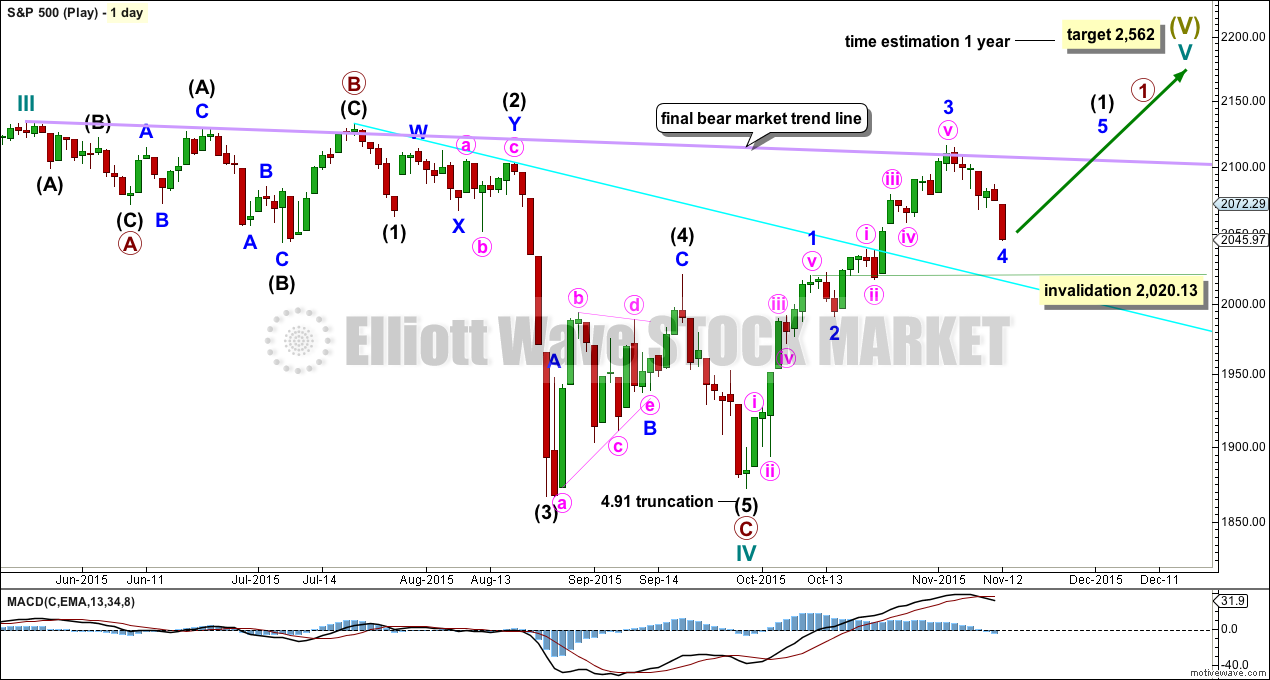
DAILY CHART
Click chart to enlarge.
It is possible to see cycle wave IV a completed flat correction. This would provide some structural alternation with the zigzag of cycle wave II.
This is a regular flat but does not have a normal regular flat look. Primary wave C is too long in relation to primary wave A. Primary wave C would be 3.84 short of 4.236 the length of primary wave A. While it is possible to also see cycle wave IV as a complete zigzag (the subdivisions for that idea would be labelled the same as the bear wave count below, daily chart) that would not provide structural alternation with the zigzag of cycle wave II, and so I am not considering it.
This idea requires not only a new high but that the new high must come with a clear five upwards, not a three.
At 2,562 cycle wave V would reach equality in length with cycle wave I. Cycle wave I was just over one year in duration so cycle wave V should be expected to also reach equality in duration. Cycle degree waves should be expected to last about one to several years, so this expectation is reasonable. It would be extremely unlikely for this idea that cycle wave V was close to completion, because it has not lasted nearly long enough for a cycle degree wave.
I added a bear market trend line drawn using the approach outlined by Magee in “Technical Analysis of Stock Trends”. When this lilac line is clearly breached by upwards movement that shall confirm a trend change from bear to bull. The breach must be by a close of 3% or more of market value. If it comes with a clear five up, then this wave count would be further confirmed.
While price remains below the bear market trend line, we should assume the trend remains the same: downwards.
Minor wave 3 should be complete. Minor wave 4 may not move into minor wave 1 price territory below 2,020.13.
This wave count does not have support from regular technical analysis and it has a big problem of structure for Elliott wave analysis. I do not have confidence in this wave count. It is presented as a “what if?” to consider all possibilities.
BEAR ELLIOTT WAVE COUNT
DAILY CHART
Click chart to enlarge.
This bear wave count has a better fit at Grand Super Cycle degree and is better supported by regular technical analysis at the monthly chart level. But it is a huge call to make, so I present it second, after a more bullish wave count, and until all other options have been eliminated.
There are two ideas presented in this chart: a huge flat correction or a double flat / double combination. The huge flat is more likely. They more commonly have deep B waves than combinations have deep X waves (in my experience).
A huge flat correction would be labelled super cycle (a)-(b)-(c). It now expects a huge super cycle wave (c) to move substantially below the end of (a) at 666.79. C waves can behave like third waves. This idea expects a devastating bear market, and a huge crash to be much bigger than the last two bear markets on the monthly bear chart.
The second idea is a combination which would be labelled super cycle (w)-(x)-(y). The second structure for super cycle wave (y) would be a huge sideways repeat of super cycle wave (a) for a double flat, or a quicker zigzag for a double combination. It is also possible (least likely) that price could drift sideways in big movements for over 10 years for a huge triangle for super cycle wave (y).
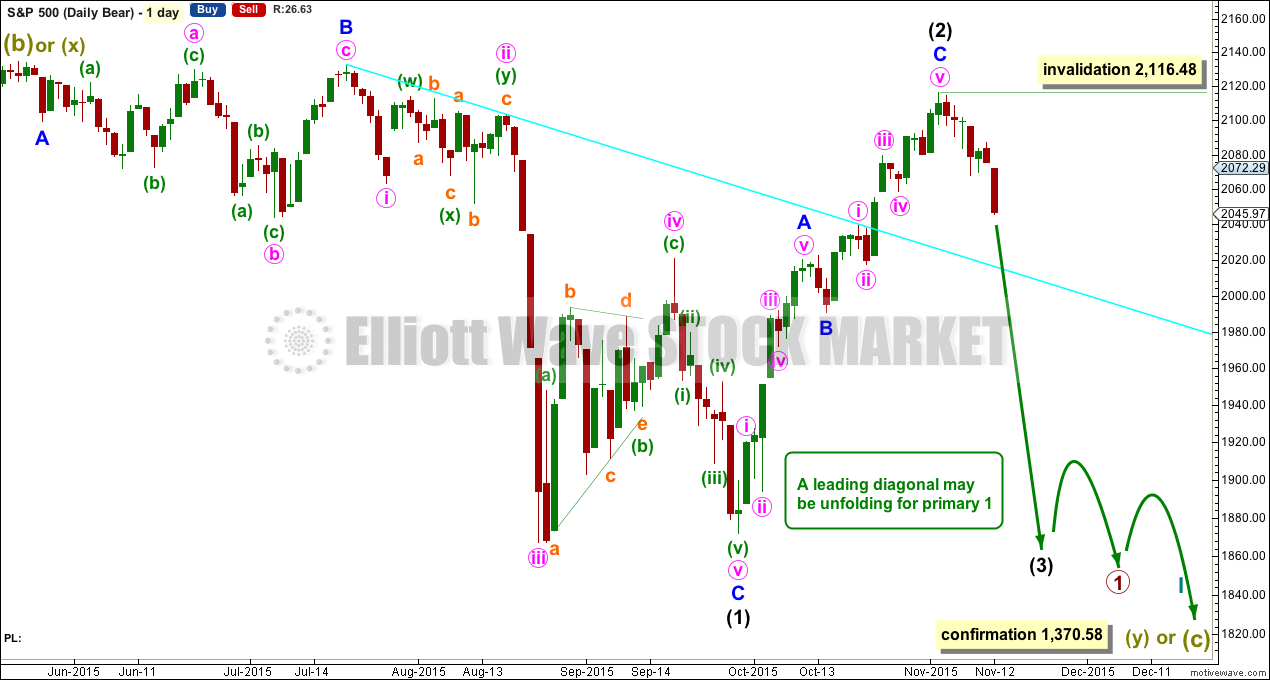
The bear wave count sees a leading diagonal for a primary degree first wave unfolding. Within leading diagonals, the first, third and fifth waves are most commonly zigzags but sometimes may appear to be impulses. Here intermediate wave (1) is seen as a complete zigzag.
No second wave correction nor minor wave B may move beyond the start above 2,116.48 within intermediate wave (2).
Intermediate wave (3) should unfold downwards when intermediate wave (2) is complete. It must move beyond the end of intermediate wave (1) and it would most likely be a zigzag.
HOURLY CHART
Click chart to enlarge.
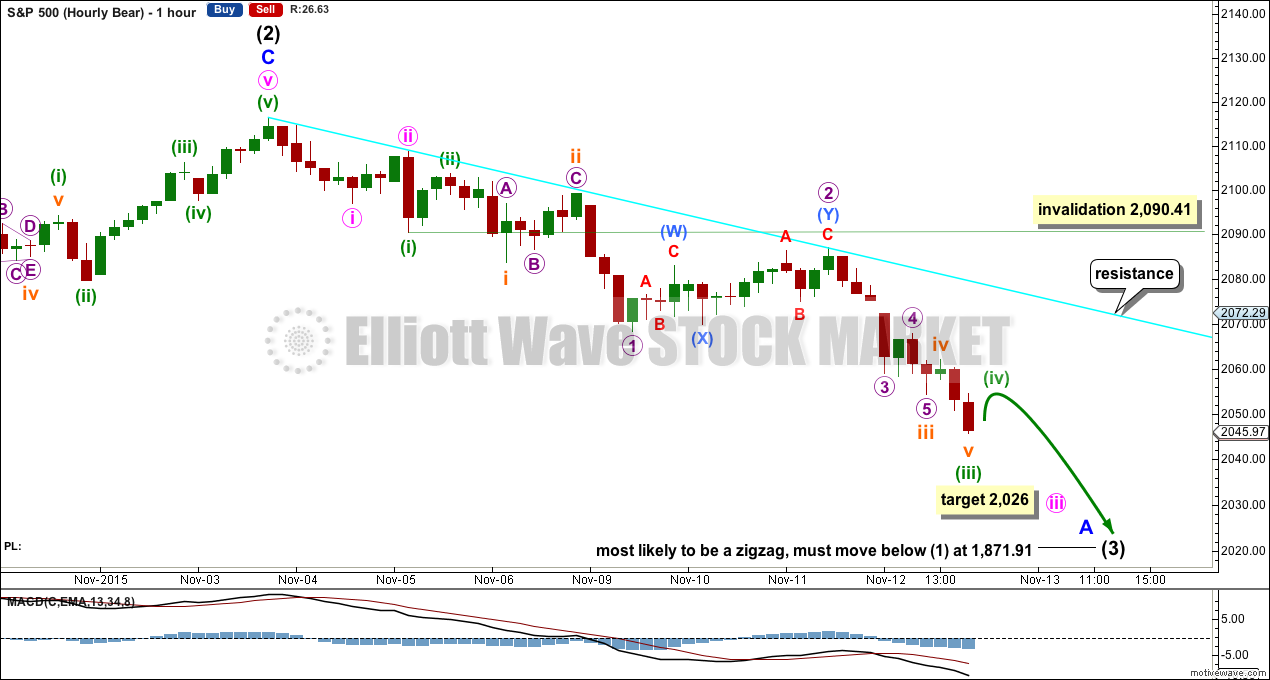
Because I have two hourly charts which both expect a five down to be unfolding at the hourly chart level I am using them to illustrate two ideas. Both hourly charts work in the same way for both daily bull and daily bear wave counts.
Because leading expanding diagonals are not very common, and because they are normally followed by deep second waves when they do occur, the first idea presented for the bull wave count has problems.
An impulse is a more common structure for a first (or A) wave. If an impulse is unfolding downwards, then the middle may have recently passed and a series of fourth wave corrections may be underway.
There is no Fibonacci ratio between subminuette waves i and iii.
At 2,026 minute wave iii would reach 4.236 the length of minute wave i.
When markets open tomorrow minuette wave (iv) may not move into minuette wave (i) price territory above 2,101.57.
TECHNICAL ANALYSIS
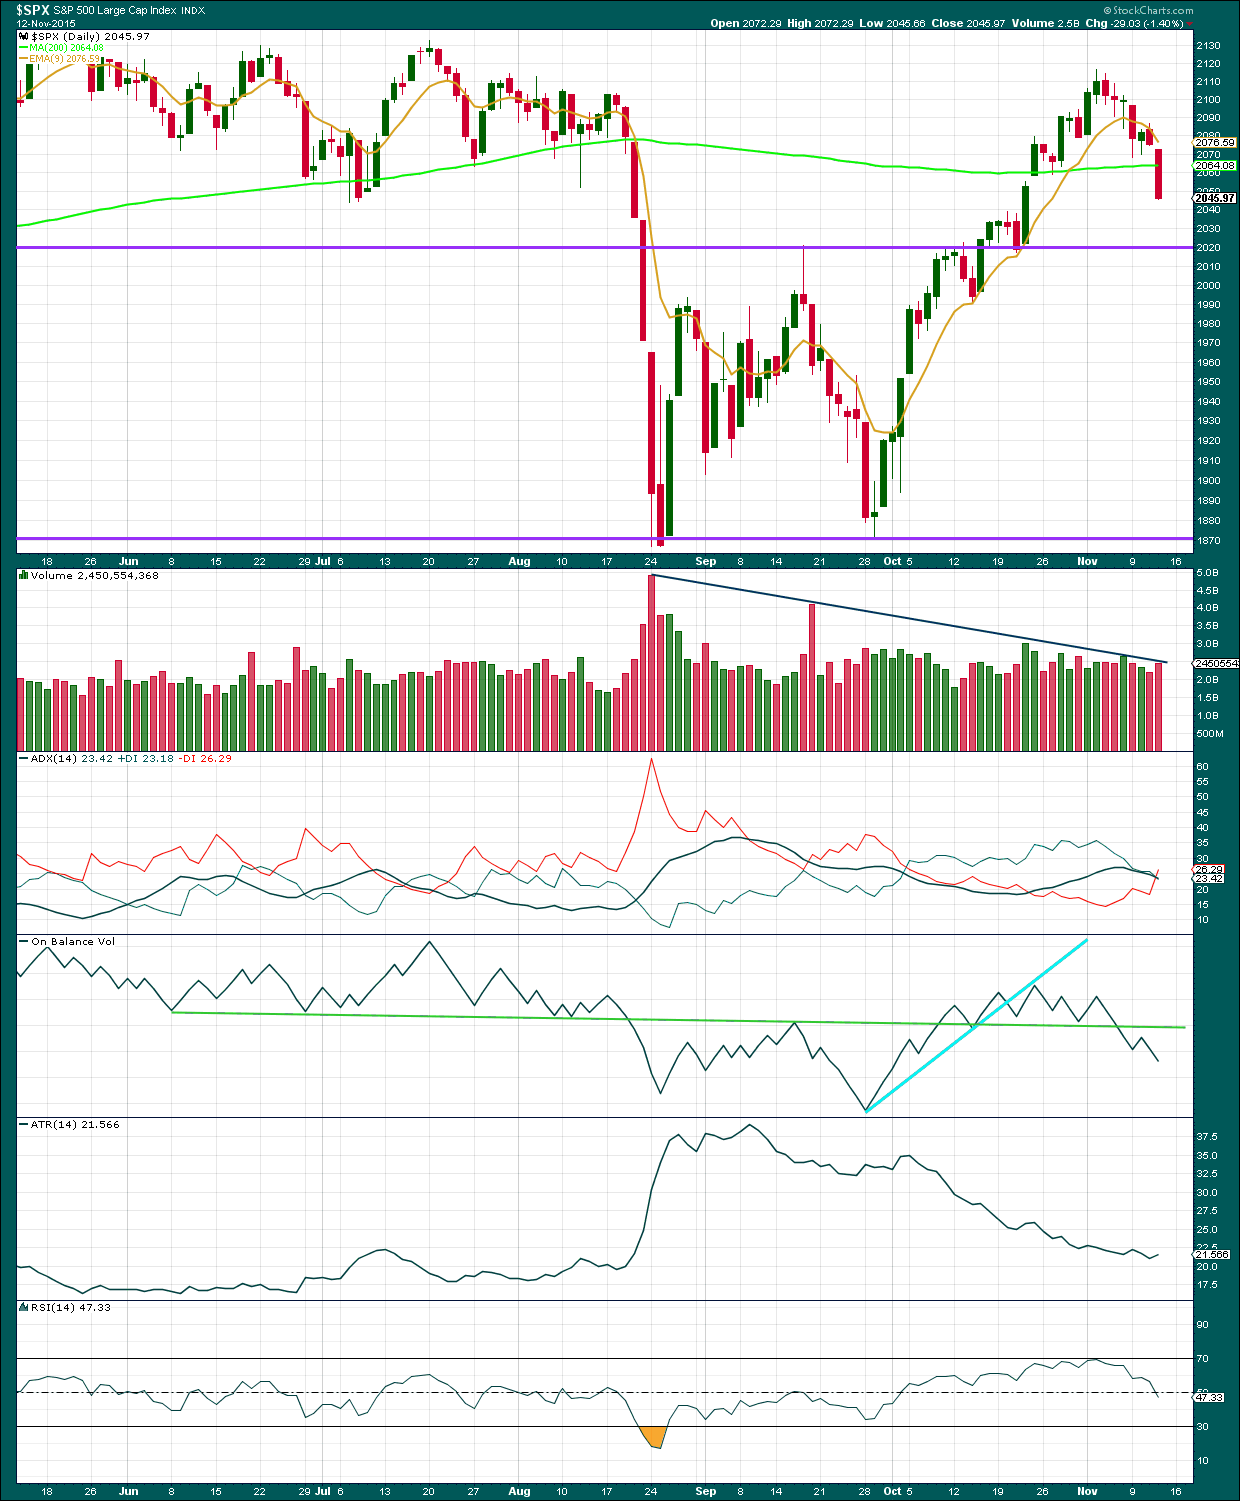
Click chart to enlarge. Chart courtesy of StockCharts.com.
Daily: An increase in volume for a strong downwards day supports the downwards trend.
The +DX and -DX lines have crossed today indicating a trend change. ADX does tend to be a lagging indicator (it is based on moving averages which necessarily are lagging). If the black ADX line turns upwards in the next few days, then a downwards trend would be indicated. For now ADX does not indicate a trend is in place.
ATR still agrees. The range price has been moving in has been declining, more typical of a consolidation than a trend. A trend should be expected to develop; after a period of declining range price does tend to again expand.
Price has moved strongly below the 200 day moving average and closed below it. The next area for support may be the horizontal trend line about 2,020. Along the way down, price may now find resistance at the 9 day EMA.
On Balance Volume is a leading indicator and usually works well with trend lines. At this stage, OBV remains below the green trend line. This line is very shallow, repeatedly tested, reasonably long held, and highly technically significant. The breach of OBV below that line is a reasonably strong bearish signal and supports all wave counts with the exception of the very bullish “alternate bull Elliott wave count” which has no technical support at all.
A note on Dow Theory: for the bear wave count I would wait for Dow Theory to confirm a huge market crash. So far the industrials and the transportation indices have made new major swing lows, but the S&P500 and Nasdaq have not.
S&P500: 1,820.66
Nasdaq: 4,116.60
DJT: 7,700.49 – this price point was breached.
DJIA: 15,855.12 – this price point was breached.
To the upside, for Dow Theory, I am watching each index carefully. If any make new all time highs, that will be noted. If they all make new all time highs, then a continuation of a bull market would be confirmed. So far none have made new all time highs.
This analysis is published about 06:58 p.m. EST.
The target at 2,026 on the bear hourly is inadequate. Although that was where a small correction looks to have turned up, that’s not the end of minute wave iii. There aren’t enough subdivisions in there for a complete impulse… yet.
The target for 2,009 on the first hourly chart remains valid. If it’s met in two more trading sessions then minute iii would last a Fibonacci five days. That will be my expectation at this stage.
The channel drawn on the first hourly chart may now be used for resistance at the lower edge. Which means that if that works corrections along the way down may be more shallow than deep.
I’ll be expecting another red candlestick as most likely for Monday.
Have a fabulous weekend everybody!
Thanks Lara you too!
I still think based on other factors such as options expiration next week we get a good hard sell off down on markets and maybe even down to 1871 by the end of November and then bounce into December 2015.
ES Hourly back tested and retreated from the Black S/R and red channel line
SPX HR cash is stuck in the middle of no where still inside it’s channel (red lines)
Here is the Right ES HR chart (àX#!)
Looks like 2020 support holding… for now. Due for a bit of bounce but would not want to be long going into the weekend…still way too much exuberance, irrational or otherwise…
SPX Hourly : price broke down through gap & dashed red channel line.
Main targets (Lara’s) in cyan
Daily Lara’s targets in Cyan
38.2 Fib line and black S/R line may cause interference
Indicators : Hourly time frame getting over extended to the downside
ES Daily: Will be watching the thick black S/R line
ES Hourly is at the bottom of it’s channel: The black line S/R was given to me by a poster from another site and described it as a Fibonacci cluster area on long term charts he had been tracking ……..and it seems to be in play…….I did not try to research it.
Both day & HR ES charts are as of 2:20 PM Euro time
OK….Re the Fibo cluster: Weekly ES: 2037 area is a strong S/R level
Thank you for sharing your charts John. I’m watching them each day and it’s most helpful to see a slightly different view on this market.
Hi Lara,
I miss the videos!
Just thought I’d through that out there!
Have a nice weekend!
P.S…
You made mention of a target of 2009 for the S&P, is that solely for Friday’s target?
Thanks!
Hi Lisa, I know. Quite a few members do miss the daily videos. But as I explained when they went, something had to give in terms of my workload. If I want to keep doing this long term the workload had to be reduced, after it was increased by the addition of a bunch of regular technical analysis.
The 2,009 target isn’t for one day. If minute iii lasts a Fibonacci five days (minute i if it was a diagonal lasted a Fibonacci 3 days) then the target may be met in two more trading days.
Hi Lara, if you could give your thoughts near the end of the trading day (especially if wave count is invalidated) same as you tend to do with gold, it would be very useful and more than make up for the loss of video (hopefully would not take up too much of your time). It is very useful to confirm that our own alternate count is on track if you haven’t published an alternate scenario.
I realise this is not an intraday service and you are under no obligation to do so.
I understand the sentiment and I will make every effort to do this for members when I can.
The problem comes with the amount of time it takes to form an Elliott wave opinion on a market each day. When I make a comment on the Gold website it is after I have spent some time on the hourly chart and often also the five minute chart checking subdivisions and looking for alternates. I almost always have the time to do this each morning (I get up about 6am) for one market. I’m in the “zone” with that market so go on to finish charts and complete the analysis. Then I switch zones to another market.
By the time Gold is done NY is close to closing. By the time I have an idea of what the S&P is doing NY is closed.
I’m going to trial switching from one to the other before NY closes and see if that’s still efficient, so that your request (and other members have made the same request too) is met.
Lets see how that goes next week.