
Upwards movement invalidated the hourly Elliott wave count.
Summary: A new low below 2,050.09 would provide confidence in the expectation that a third wave down is underway. Short term, while price remains above 2,050.09, it is possible that a second wave correction may yet move price higher. The invalidation point is at 2,116.48.
To see how each of the bull and bear wave counts fit within a larger time frame see the Grand Supercycle Analysis.
To see last analysis of weekly and monthly charts go here.
If I was asked to pick a winner (which I am reluctant to do) I would say the bear wave count has a higher probability. It is better supported by regular technical analysis at the monthly chart level, it fits the Grand Supercycle analysis better, and it has overall the “right look”.
New updates to this analysis are in bold.
BULL ELLIOTT WAVE COUNT
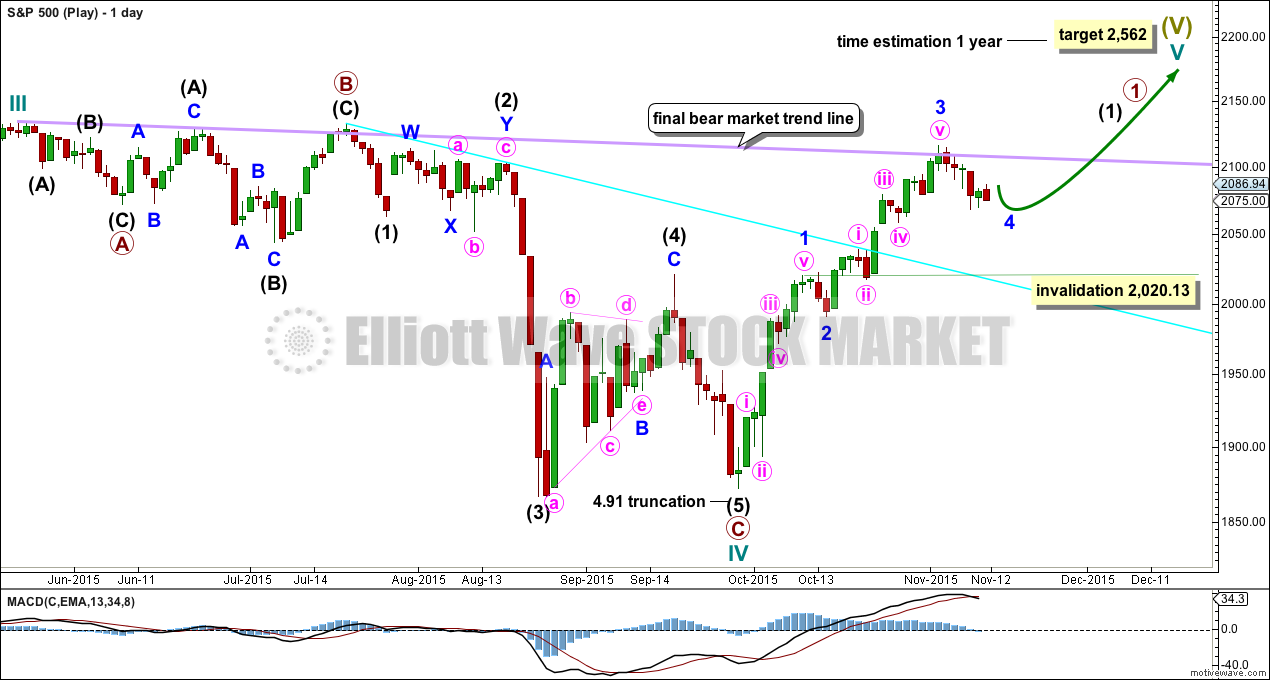
DAILY CHART – COMBINATION OR FLAT
Click chart to enlarge.
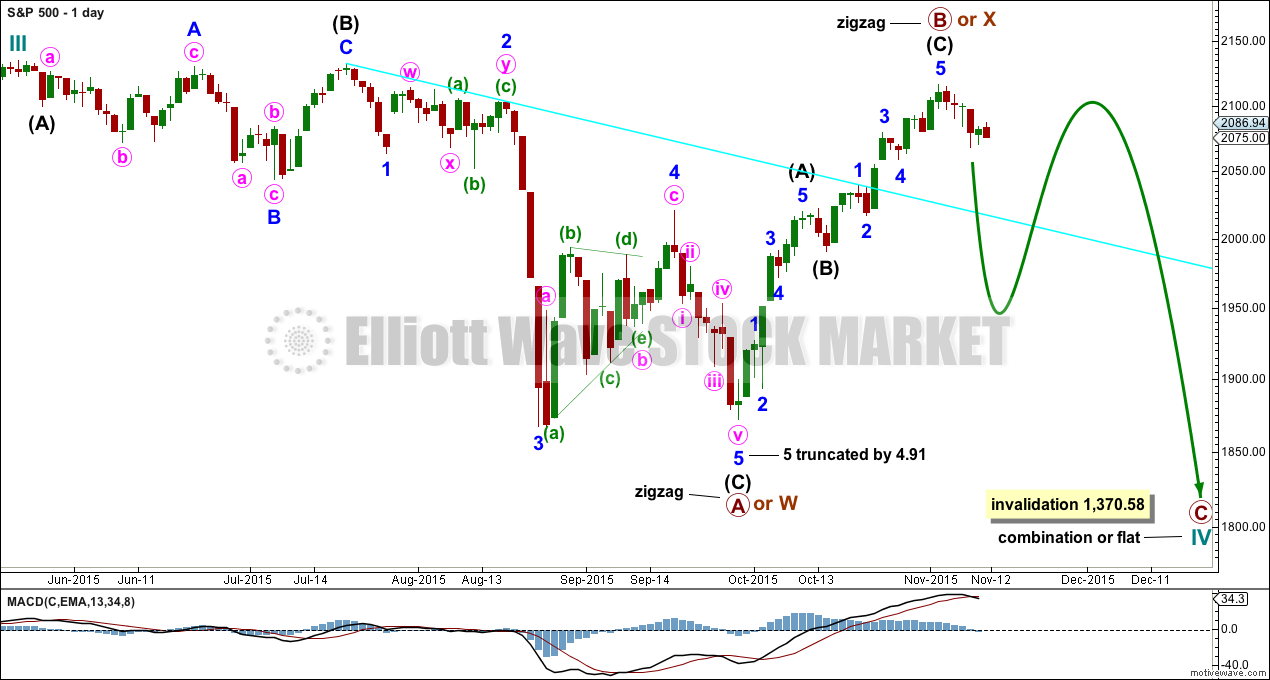
Cycle wave IV should exhibit alternation to cycle wave II.
Cycle wave II was a shallow 0.41 zigzag lasting three months. Cycle wave IV should exhibit alternation in structure and maybe also alternation in depth. Cycle wave IV may end when price comes to touch the lower edge of the teal channel which is drawn about super cycle wave V using Elliott’s technique (see this channel on weekly and monthly charts).
Cycle wave IV is may end within the price range of the fourth wave of one lesser degree. Because of the good Fibonacci ratio for primary wave 3 and the perfect subdivisions within it, I am confident that primary wave 4 has its range from 1,730 to 1,647.
If a zigzag is complete at the last major low as labelled, then cycle wave IV may be unfolding as a flat, combination or triangle.
Primary wave B or X upwards is a single zigzag. Upwards movement has reached above 2,108.44. Primary wave B has passed the minimum requirement for a flat correction of 90% the length of primary wave A, and so cycle wave IV may be unfolding as a flat correction.
Cycle wave IV may also still unfold as a combination: zigzag – X – flat. Both a flat or combination would provide alternation with the single zigzag of cycle wave II.
Primary wave B within a flat correction may make a new high above the start of primary wave A at 2,134.72 as in an expanded flat. There is no upper invalidation point for this wave count for that reason. Likewise, X waves within combinations may also move beyond the start of the first structure labelled primary wave W. There is no minimum or maximum length for an X wave within a combination.
At this stage, it is still possible that primary wave B or X could yet continue higher as a double zigzag. The possibility of more upwards movement must be accepted while there is not a clear five down on the hourly chart. So far downwards movement on the hourly chart is a series of overlapping first and second waves complete, and now a corresponding series of fourth and fifth waves are needed to complete an impulse to the downside on the hourly chart. While this is incomplete the possibility of a double zigzag moving price higher must be accepted to exist. The alternate hourly wave count looks at this idea.
DAILY CHART – TRIANGLE
Click chart to enlarge.
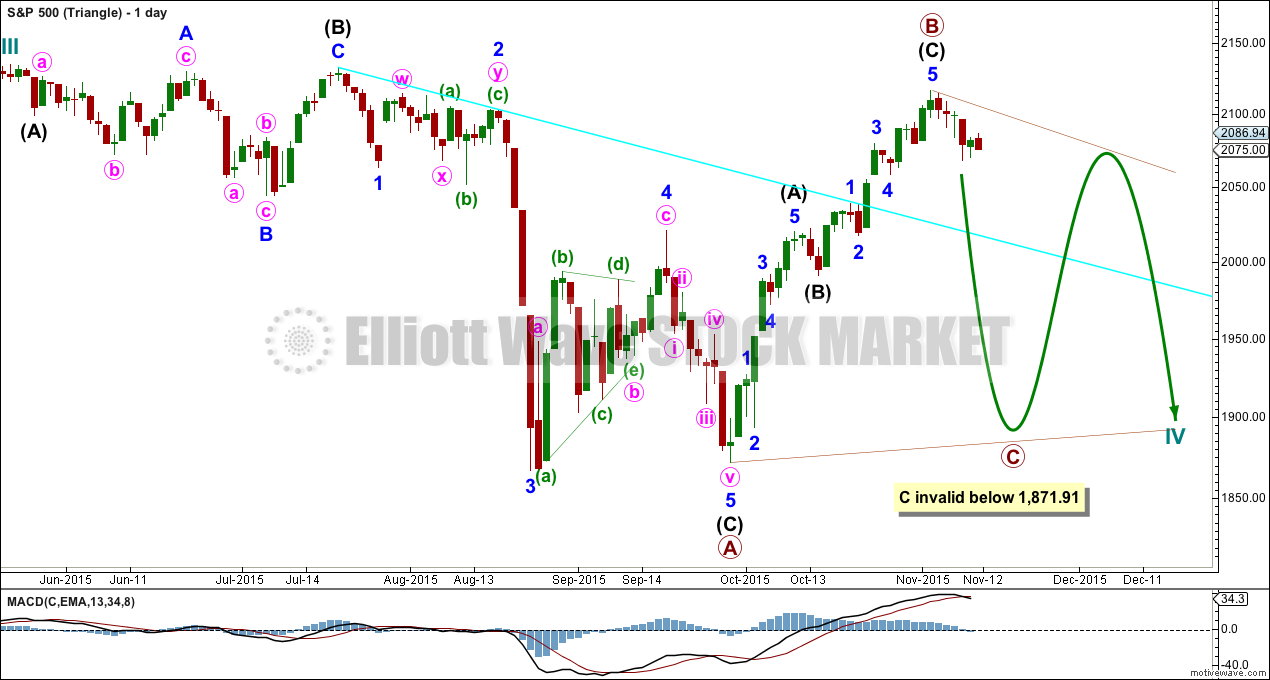
Cycle wave IV may unfold as a shallow triangle. This would provide alternation with the 0.41 zigzag of cycle wave II.
Primary wave B may be unfolding as a zigzag.
Primary wave B may move beyond the start of primary wave A at 2,134.72 as in a running triangle. There is no upper invalidation point for this wave count for that reason.
Primary wave C of a barrier or contracting triangle may not move beyond the end of primary wave A at 1,871.91.
The whole structure moves sideways in an ever decreasing range. The purpose of triangles is to take up time and move price sideways.
The hourly charts below work in exactly the same way for both of these daily charts.
MAIN HOURLY CHART
Click chart to enlarge.
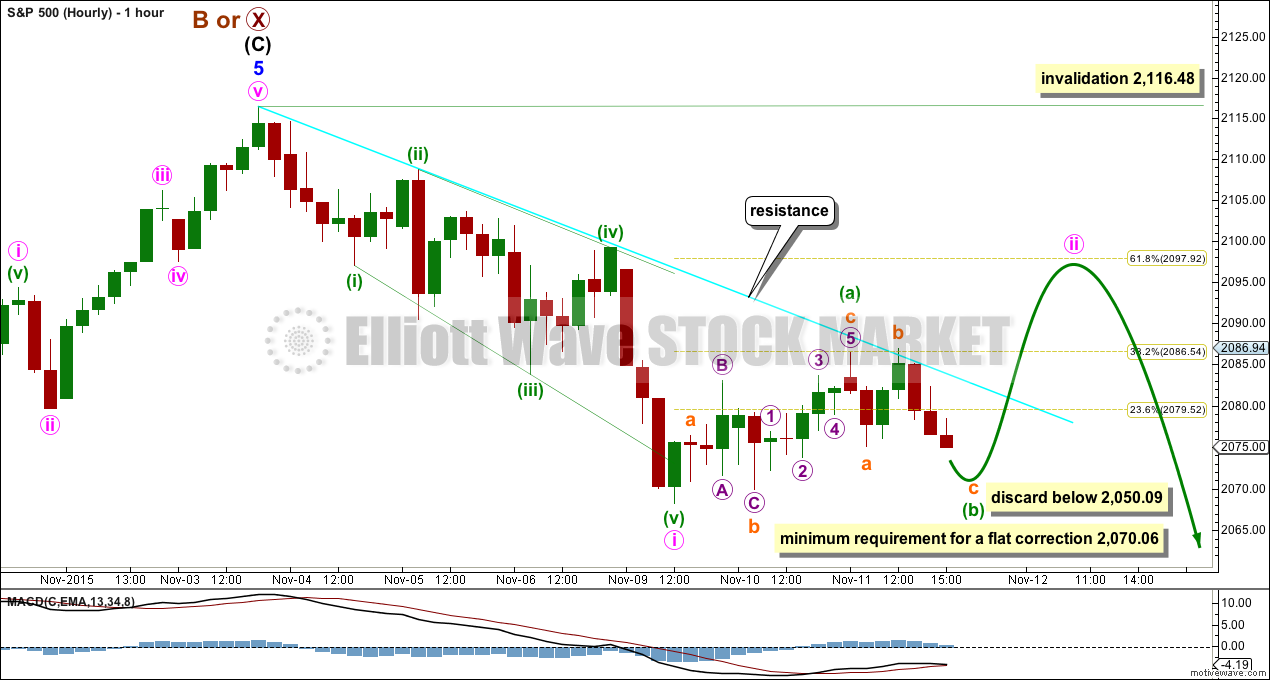
Both this hourly chart and the bear hourly chart today see a leading expanding diagonal complete downwards for minute wave i. This structure meets all rules for a leading diagonal. Leading expanding diagonals are not very common, but this is the only structure which fits at this stage.
Second wave corrections to follow first wave leading diagonals are normally very deep. This one may be unfolding as a flat correction.
Minuette wave (a) fits as a zigzag within minute wave ii. Minuette wave (b) may be an incomplete flat correction. The minimum requirement for a B wave within a flat is 90% of the A wave, which gives a minimum price point for subminuette wave b to move down to at 2,070.06.
There is no maximum limit for a B wave within a flat, but there is an Elliott wave convention that states when the potential B wave reaches twice the length of the A wave that the idea of a flat unfolding has such a low probability it should be discarded. This price point would be at 2,050.09.
If price moves below 2,050.09 in the next day or so, then the scenario presented for the hourly bear wave count should be used.
If minute wave ii is incomplete, then it may reach up to the 0.618 Fibonacci ratio at 2,098.
Minute wave ii may not move beyond the start of minute wave i above 2,116.48.
ALTERNATE HOURLY CHART
Click chart to enlarge.
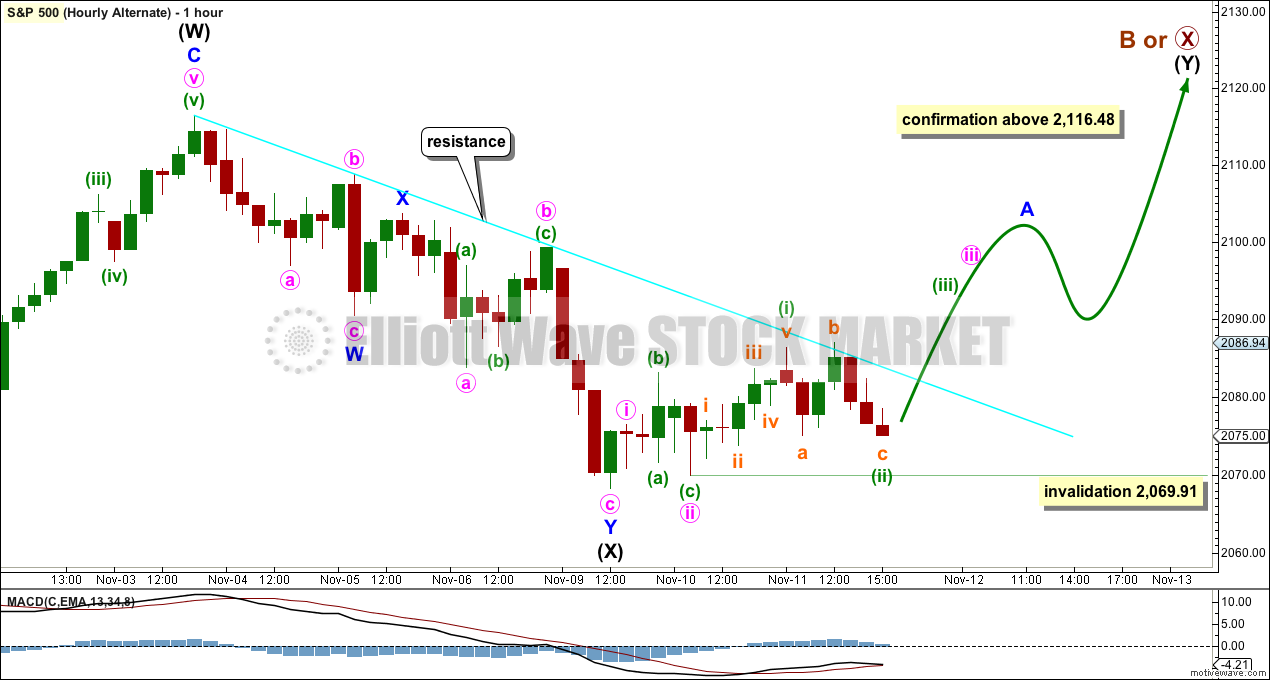
The zigzag labelled intermediate wave (W) may have been only the first zigzag within a double. The double may be joined by a completed “three”, a complete double zigzag in the opposite direction.
The multiple would be very unlikely to be a combination. Their X waves are normally much deeper as they have a sideways form. Double zigzags are different. They should have a clear slope against the trend one degree higher, so their X waves are normally relatively quick and shallow.
This means that intermediate wave (Y) should be a zigzag. Minuette wave (ii) may not move beyond the start of minuette wave (i) below 2,069.91.
Within multiples the sub waves of W, Y and Z (if there is one) may only themselves subdivide as simple A-B-C (or A-B-C-D-E in the case of triangles) corrective structures. This is because the maximum number of corrective structures within a multiple is three. To label W, Y and Z as multiples themselves violates the rule as it increases the maximum beyond three. However, X waves are not counted as a corrective structure within a multiple because they are joining structures. They may be any corrective structure.
Within double zigzags, the second zigzag does not normally exhibit a Fibonacci ratio to the first. The only way to calculate a target for a second zigzag to end within a double is to use the ratio of the A and C waves within it. This can only be done when A and B are complete and the beginning of C is known.
This alternate wave count has a lower probability than the main wave count. It should only be used if confirmed with a new high above 2,116.48.
ALTERNATE BULL ELLIOTT WAVE COUNT
DAILY CHART
Click chart to enlarge.
It is possible to see cycle wave IV a completed flat correction. This would provide some structural alternation with the zigzag of cycle wave II.
This is a regular flat but does not have a normal regular flat look. Primary wave C is too long in relation to primary wave A. Primary wave C would be 3.84 short of 4.236 the length of primary wave A. While it is possible to also see cycle wave IV as a complete zigzag (the subdivisions for that idea would be labelled the same as the bear wave count below, daily chart) that would not provide structural alternation with the zigzag of cycle wave II, and so I am not considering it.
This idea requires not only a new high but that the new high must come with a clear five upwards, not a three.
At 2,562 cycle wave V would reach equality in length with cycle wave I. Cycle wave I was just over one year in duration so cycle wave V should be expected to also reach equality in duration. Cycle degree waves should be expected to last about one to several years, so this expectation is reasonable. It would be extremely unlikely for this idea that cycle wave V was close to completion, because it has not lasted nearly long enough for a cycle degree wave.
I added a bear market trend line drawn using the approach outlined by Magee in “Technical Analysis of Stock Trends”. When this lilac line is clearly breached by upwards movement that shall confirm a trend change from bear to bull. The breach must be by a close of 3% or more of market value. If it comes with a clear five up, then this wave count would be further confirmed.
While price remains below the bear market trend line, we should assume the trend remains the same: downwards.
Minor wave 3 should be complete. Minor wave 4 may not move into minor wave 1 price territory below 2,020.13.
BEAR ELLIOTT WAVE COUNT
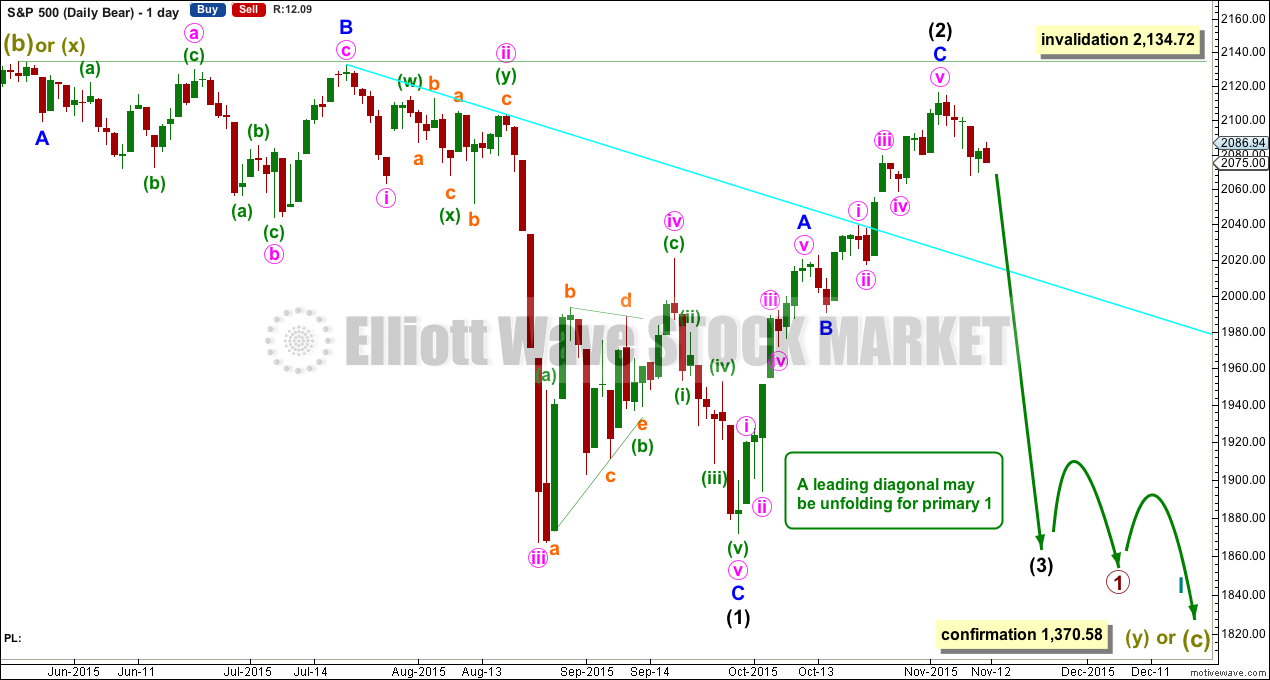
DAILY CHART
Click chart to enlarge.
This bear wave count has a better fit at Grand Super Cycle degree and is better supported by regular technical analysis at the monthly chart level. But it is a huge call to make, so I present it second, after a more bullish wave count, and until all other options have been eliminated.
There are two ideas presented in this chart: a huge flat correction or a double flat / double combination. The huge flat is more likely. They more commonly have deep B waves than combinations have deep X waves (in my experience).
A huge flat correction would be labelled super cycle (a)-(b)-(c). It now expects a huge super cycle wave (c) to move substantially below the end of (a) at 666.79. C waves can behave like third waves. This idea expects a devastating bear market, and a huge crash to be much bigger than the last two bear markets on the monthly bear chart.
The second idea is a combination which would be labelled super cycle (w)-(x)-(y). The second structure for super cycle wave (y) would be a huge sideways repeat of super cycle wave (a) for a double flat, or a quicker zigzag for a double combination. It is also possible (least likely) that price could drift sideways in big movements for over 10 years for a huge triangle for super cycle wave (y).
The bear wave count sees a leading diagonal for a primary degree first wave unfolding. Within leading diagonals, the first, third and fifth waves are most commonly zigzags but sometimes may appear to be impulses. Here intermediate wave (1) is seen as a complete zigzag.
Intermediate wave (2) may not move beyond the start of intermediate wave (1) above 2,134.72.
Intermediate wave (3) should unfold downwards when intermediate wave (2) is complete. It must move beyond the end of intermediate wave (1) and it would most likely be a zigzag.
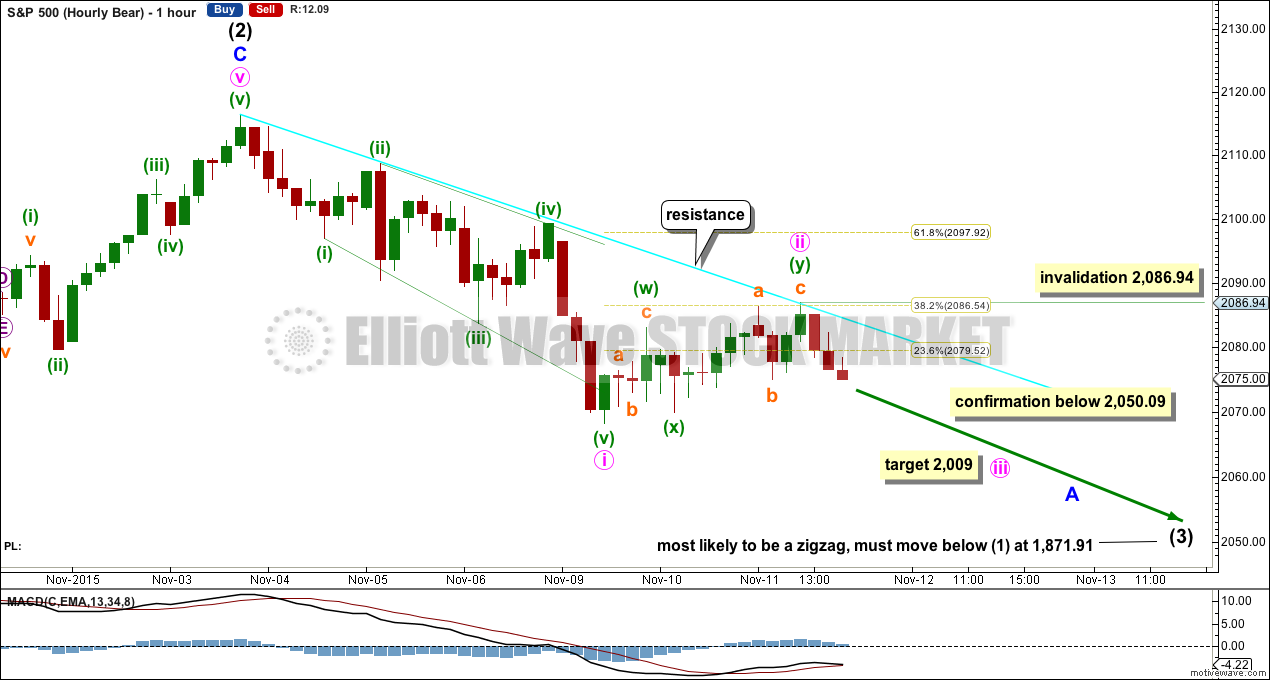
HOURLY CHART
Click chart to enlarge.
All the subdivisions at the hourly chart level are the same for both this hourly chart and the main bull hourly chart today, up to the end of a leading expanding diagonal for minute wave i.
Thereafter, this hourly chart looks at the possibility that the following correction for minute wave ii may be complete. It will subdivide as a double zigzag and may have ended at the 0.382 Fibonacci ratio of minute wave i.
Second wave corrections following leading diagonals are normally very deep, but they don’t have to be. This idea necessarily has a lower probability than the scenario presented for the first hourly chart above, because this idea looks at a less likely outcome for minute wave ii.
If price makes a new low below 2,050.09, then a third wave down would be most likely. At 2,009 minute wave iii would reach 1.618 the length of minute wave i.
No second wave correction may move beyond its start above 2,086.94 within minute wave iii. A new high above 2,086.94 would confirm that minute wave ii is not over and is continuing higher. At that stage, expect it to end close to the 0.618 Fibonacci ratio as per the first hourly chart.
TECHNICAL ANALYSIS
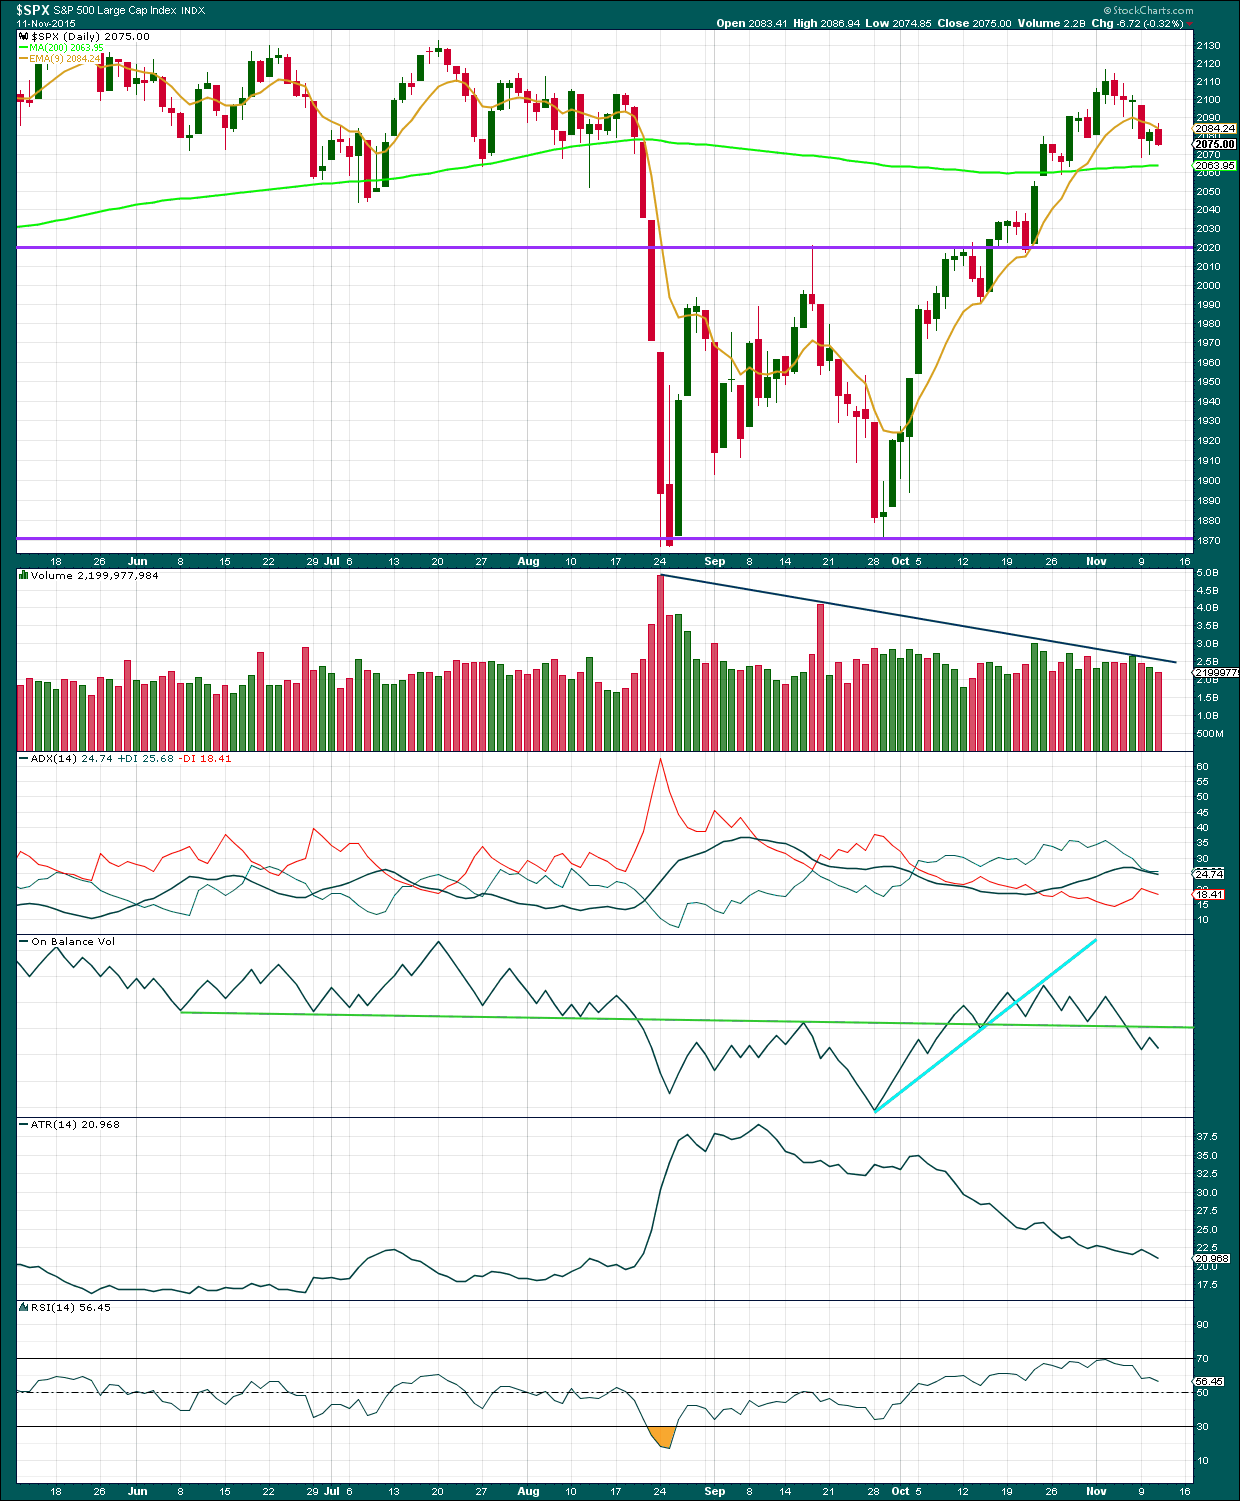
Click chart to enlarge. Chart courtesy of StockCharts.com.
Daily: Volume has declined for a downwards day. On its own, this is not concerning for the wave count. If price is in a small correction, then light volume would be expected. This fits the hourly wave count which expects that today was part of a consolidation within a downwards trend.
ADX is declining indicating the market is not trending. ADX does tend to be a lagging indicator. ATR so far agrees though; with the range price is moving in, continuing to decline, no trend is yet evident. If the market is currently consolidating, then it may find support at the 200 day moving average. A little more downwards movement to that line may be expected until Stochastics reaches oversold.
On Balance Volume is a leading indicator and usually works well with trend lines. At this stage, OBV remains below the green trend line. This line is very shallow, repeatedly tested, reasonably long held, and highly technically significant. The breach of OBV below that line is a reasonably strong bearish signal and supports all wave counts with the exception of the very bullish “alternate bull Elliott wave count” which has no technical support at all.
A note on Dow Theory: for the bear wave count I would wait for Dow Theory to confirm a huge market crash. So far the industrials and the transportation indices have made new major swing lows, but the S&P500 and Nasdaq have not.
S&P500: 1,820.66
Nasdaq: 4,116.60
DJT: 7,700.49 – this price point was breached.
DJIA: 15,855.12 – this price point was breached.
To the upside, for Dow Theory, I am watching each index carefully. If any make new all time highs, that will be noted. If they all make new all time highs, then a continuation of a bull market would be confirmed. So far none have made new all time highs.
This analysis is published about 07:48 p.m. EST.
Good call, Lara.
btw–do you have any plans to update GDX? looks like we may have completed 5-waves down.
MR
I should be able to get to GDX and USD Index in the next few days.
Nasdaq next…. working on that now 🙂
The propaganda from central bankers about “possible” further stimulus has not worked. Draghi’s bluff has been called and European markets closed at the lows. If they are going to affect market action going forward, they are now going to have to deploy actual capital and buy the indices at the very least. Of course this is what they have been doing all along as the markets’ advance has been extremely narrow, led by a minority of stocks. It is now looking like the PPT is trying to hold onto the 200 day MA and it will be interesting see how bears in the US respond. Wise to take short-side profits on the current dip…just in case…
…. and it closes below the 200 day moving average.
Next line of support at 2,020.
That is huge. If it does not re-take it immediately tomorrow I am going to assume intermediate three has arrived, albeit stealthily…kinda like the ending diagonal did….
I used to think that same view but then I reviewed more documents and it is almost entirely impossible to control the world markets.
Reason being:
If they could control it why did they let the 2008 financial crisis or the flash crash happen? I tend to question the power they have on markets.
I think they only care really about the bond market and not the equities market.
It seems like the PPT is only allowed to intervene under stanley fisher if the situation drops below a 40% plunge.
I guess we will never ever know the real answer.
But i have been there questioning it, believe me especially with all that has just happened the past 2 years….
You are absolutely right in that their influence is limited, but they do have influence, especially when their efforts are co-ordinated. The view of some that they are all-powerful and can ultimately control the market is an absolute illusion of which many will be disabused during the coming meltdown. The fact that they failed miserably in 2008 does not mean they did not try. What they have done this cycle is simply delayed the inevitable, and ensured that the bang, when this most recent bubble they have inflated bursts, will be much louder than the last time around. You are right on the money about the bond market, which totally dwarfs the equities market and which I believe will trigger the next crisis. The central banks will be utterly powerless to stem the tide once world wide rates embark on their unstoppable march upward.
Most central banks are by and large technically insolvent and higher rates will be their undoing.
O.k that sounds reasonable. I guess they have run out of bullets creating deflation. Other note – I just think it so fascinating the technical patterns that have developed since 2014 on the weekly SPX chart. Jut look at that head and shoulders – what a beauty!
Battle lines drawn around 200 day SMA. If the bears take it out convincingly, look out below!
If you had short positions you should definitely be taking profits on this dip. Do not leave profits sitting in this market…ever!!
That is hard with options and timing is difficult with sloppy price action.
But good point, I have been burned to many times before joining this site 🙂
A few suggestions which may be helpful
Never pay market price when entering your short positions.
Place a buy to open order at least ten per cent below the current bid for the strike price you want (for options) and you are already ahead of the game when you get filled on volatility if you are right about the trend.
Beware avarice. As soon as you get filled enter a sell to close order at a reasonable profit target.
The number one error option traders make is allowing winning trades to become loosing ones because of greed or inattention. Following stop-losses goes with out saying. This is especially true in this market.
I sold most of my short positions today and re-entered new ones as the down-trend was confirmed.
You are right that it is difficult, but not impossible.
Thank you so much for this helpful insight for other members vernecarty.
Your experience is welcome.
You are most welcome great leader!
Excellent point – options pricing is fun. I have traded 2-3 years straight options only.
Many have been burned after joining as well.
Losses are a part of trading and should be expected.
Keep position sizes small (3% or less)
Make sure you understand the trend. (the reason we subscribe)
Know when you are wrong and the market right (stop loss).
It sounds as if you have had some bad trades but hang in there and learn from your mistakes.
That’s right – the pain trade is always there.
But i got to tell you – despite still being net net negative for me this year – there is no business like trading options and futures!
It’s just fun.
I’ve learned so much it’s truly a rewarding field….
And if I may add.
Write down your trade plan.
You need reinforcement. The brain likes to be reminded.
Oh yes, great points. I was just pointing out that even with good EW theory this market is throwing lots of curve balls. Especially with central bank manipulation.
I agree. I think the intervention is evidencing itself in the greater complexity of the wave forms.
Vernecarty–how can we position for the big move down if are out of shorts?
Every trader should have short, medium and long term outlooks on the market. I have been bearish on the market for well over a year now but if I were not willing to make short and medium term trades based on price action, I would have missed an awful lot of opportunities. Lara has made an excellent case for a new down-trend and possibly the start of a huge bear market so presumably most of us who agree with that viewpoint should already be in long term short positions.
I agree but corrections are in phases from all the charts I studied. This one should be a sharp move back down to 1871 over the next 6-7 days and possibly bust through to 1820. The target is 1740 ish area and it could all happen. The Vix high must be retested 53+.
No jinx….
Another thing…just because you take profits on a short position does not preclude continuing to be short. You can take profits on half the position, and/or you can roll a portion of your position to remain short.
Good points. I guess it all depends on which instruments you use.
Futures that is easy.
Options no so easy. Time decay is vital and strike price. So, it can be a 50/50 bet and I have been there down to expiration for conviction of the move up or down….
HR SPX Cash hitting support at dashed trend line & a gap fill
Oh well ……………….. Will they go after the opening gap?
They attempted and got smashed. Probably won’t get filled this week.
On the Hourly ES H&S failed , broke through neck line
Daily pre market ES Price testing support on the lower channel top (red line)
The 4 time frames are near alignment for a down trend
Banksters are failing in their attempts so far to push the market to new highs and the bears are skittish about selling. The smart thing to do in the current environment is sell the rallies and buy the dips using small position sizes and IMMEDIATELY take profits…unless there is a decisive break of the 200 day MA. We are eventually going to get a a huge waterfall down which will again be massively bought in a desperate attempt to delay the inevitable. Be ready.
I agree. I think the great buy the dip game is over. The super cycle as Lara mentioned makes the most logical sense to complete now to the downside. I am curious what happens at the 1820 and corresponding nasdaq lows. This will be interesting. I had a target of 1573 SPX cash. Jan-Mar 2016 possibly?
Tradeem well!
Repost since it is todays question:
Hi
Lara,
Thanks. So, we are heading higher on the SPX now? What if we continue lower for the next 5 days.
Do you see the head and shoulders on the daily? The target is 2000-1991? Does that look right to you?
In all your years of experience how long can this narrow leadership of the 8 mega big stocks
FANG
and a hand full of other TECH companies keep the INDEX at all time highs?
Does this look like 1998 to you from a chart perspective?
The hourly wave count presented for the bear was the right one.
If I have alternate views I always try to provide price points which invalidate / confirm different wave counts.
o.k understood!
Hi
Lara,
Good post. How long can the amazing aging bulls of 6.5 years keep this market grinding higher and higher. This is getting pretty ridiculous with 6 weekly spx candles green and this week barely down and we are heading into Thursday and Friday and every rookie trader on a stock twits is calling for higher bull prices and not showing any evidence or good charts for the move higher? The index is only down -2.5% from an amazing move from late September 1871 to Early November 2116. This is getting beyond ridicules now don’t you think?
Do you think we are trending up?
You do give a probability – but is says 3 months. Is that 3 months from today we decline to say oh 1950?
No. My analysis favours the very bearish wave count.
I have no confidence in the bullish alternate which sees a new bull market. There is no technical support for it.
That’s the only bull wave count I have.
Not sure where you get 3 months from, if you could state which chart that is noted under I’ll be able to address that part of your question.
My mistake, I overlooked the chart DAILY CHART – COMBINATION OR FLAT. I interoperated as 3 months but that was just 3 waves actually.
Usually with all your years of experience. How long do corrections last?
Lara,
Sorry, What is the time estimation to get to SPX 1950 or 1900 or a complete 100% retracement back down to 1871? 4-5 days from now –
NO JINX!