Downwards movement was expected.
Summary: Upwards movement is still very likely to be over. A new low below 2,058.84 would provide more confidence that the trend has changed. If a new high is seen, then the possible target for upwards movement to end remains at 2,121.
To see how each of the bull and bear wave counts fit within a larger time frame see the Grand Supercycle Analysis.
To see last analysis of weekly and monthly charts go here.
If I was asked to pick a winner (which I am reluctant to do) I would say the bear wave count has a higher probability. It is better supported by regular technical analysis at the monthly chart level, it fits the Grand Supercycle analysis better, and it has overall the “right look”.
New updates to this analysis are in bold.
BULL ELLIOTT WAVE COUNT
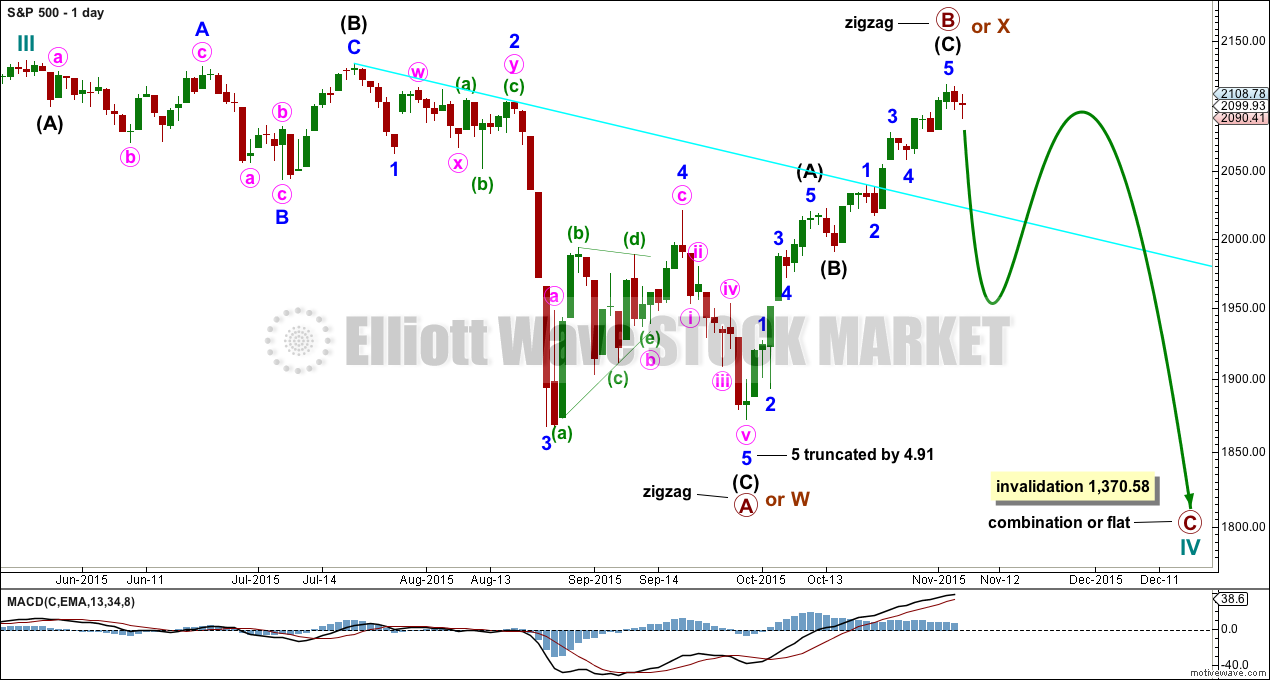
DAILY CHART – COMBINATION OR FLAT
Cycle wave IV should exhibit alternation to cycle wave II.
Cycle wave II was a shallow 0.41 zigzag lasting three months. Cycle wave IV should exhibit alternation in structure and maybe also alternation in depth. Cycle wave IV may end when price comes to touch the lower edge of the teal channel which is drawn about super cycle wave V using Elliott’s technique (see this channel on weekly and monthly charts).
Cycle wave IV is may end within the price range of the fourth wave of one lesser degree. Because of the good Fibonacci ratio for primary wave 3 and the perfect subdivisions within it, I am confident that primary wave 4 has its range from 1,730 to 1,647.
If a zigzag is complete at the last major low as labelled, then cycle wave IV may be unfolding as a flat, combination or triangle.
Primary wave B or X upwards is a single zigzag. Upwards movement has reached above 2,108.44. Primary wave B has passed the minimum requirement for a flat correction of 90% the length of primary wave A, and so cycle wave IV may be unfolding as a flat correction.
Cycle wave IV may also still unfold as a combination: zigzag – X – flat. Both a flat or combination would provide alternation with the single zigzag of cycle wave II.
Primary wave B within a flat correction may make a new high above the start of primary wave A at 2,134.72 as in an expanded flat. There is no upper invalidation point for this wave count for that reason. Likewise, X waves within combinations may also move beyond the start of the first structure labelled primary wave W. There is no minimum or maximum length for an X wave within a combination.
DAILY CHART – TRIANGLE
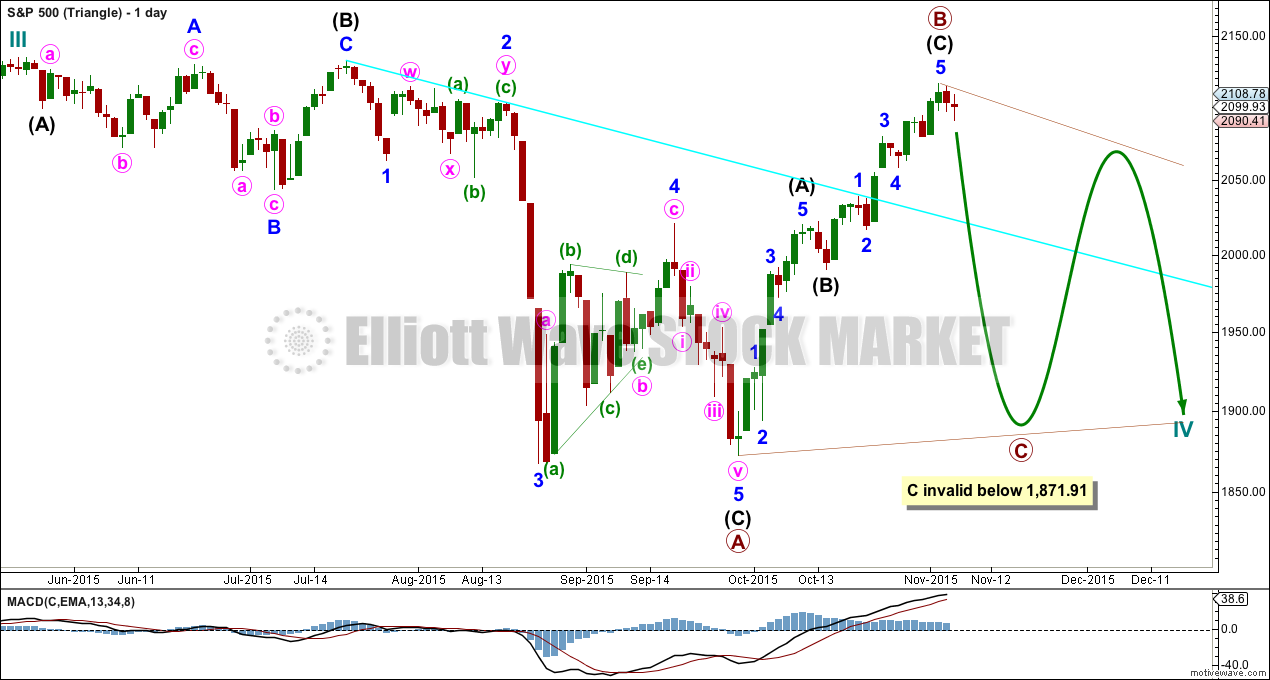
Cycle wave IV may unfold as a shallow triangle. This would provide alternation with the 0.41 zigzag of cycle wave II.
Primary wave B may be unfolding as a zigzag.
Primary wave B may move beyond the start of primary wave A at 2,134.72 as in a running triangle. There is no upper invalidation point for this wave count for that reason.
Primary wave C of a barrier or contracting triangle may not move beyond the end of primary wave A at 1,871.91.
The whole structure moves sideways in an ever decreasing range. The purpose of triangles is to take up time and move price sideways.
The hourly chart below works in exactly the same way for both of these daily charts, and so only one hourly chart for these two ideas will be presented today.
HOURLY CHART
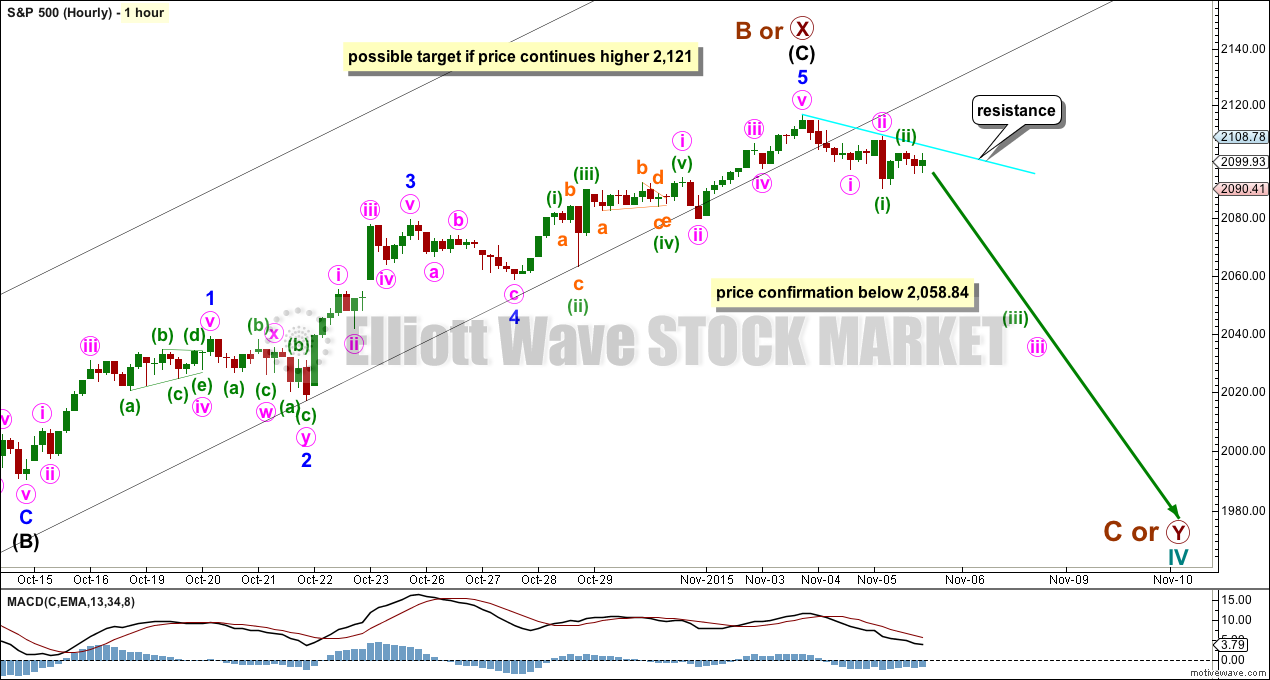
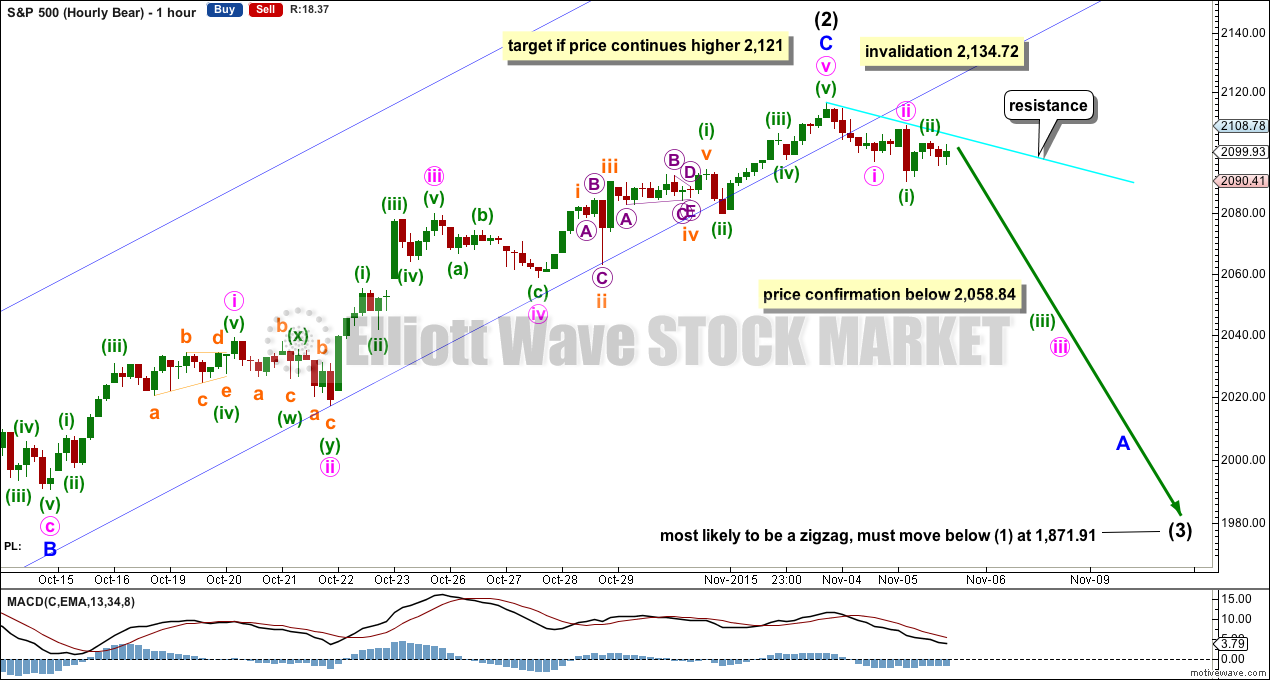
Downwards movement labelled minute waves i and ii and minuette wave (i) subdivides 5-3-5. Given that the channel is breached, this is most likely to be the start of a new impulse downwards. However, a zigzag also subdivides 5-3-5. Early tomorrow, if there is a new low below the low for Thursday at 2,090.41, then a little more confidence may be had in the idea of a trend change.
Price may find resistance short term at the small blue trend line. If price breaks above that line, it would be an early indication that the wave count may be wrong and primary wave B or X may yet move higher.
A new low below 2,058.84 could not be a second wave correction within minor wave 5. At that stage, minor wave 5 would have to be over. This would provide strong price confirmation of a trend change.
ALTERNATE BULL ELLIOTT WAVE COUNT
DAILY CHART
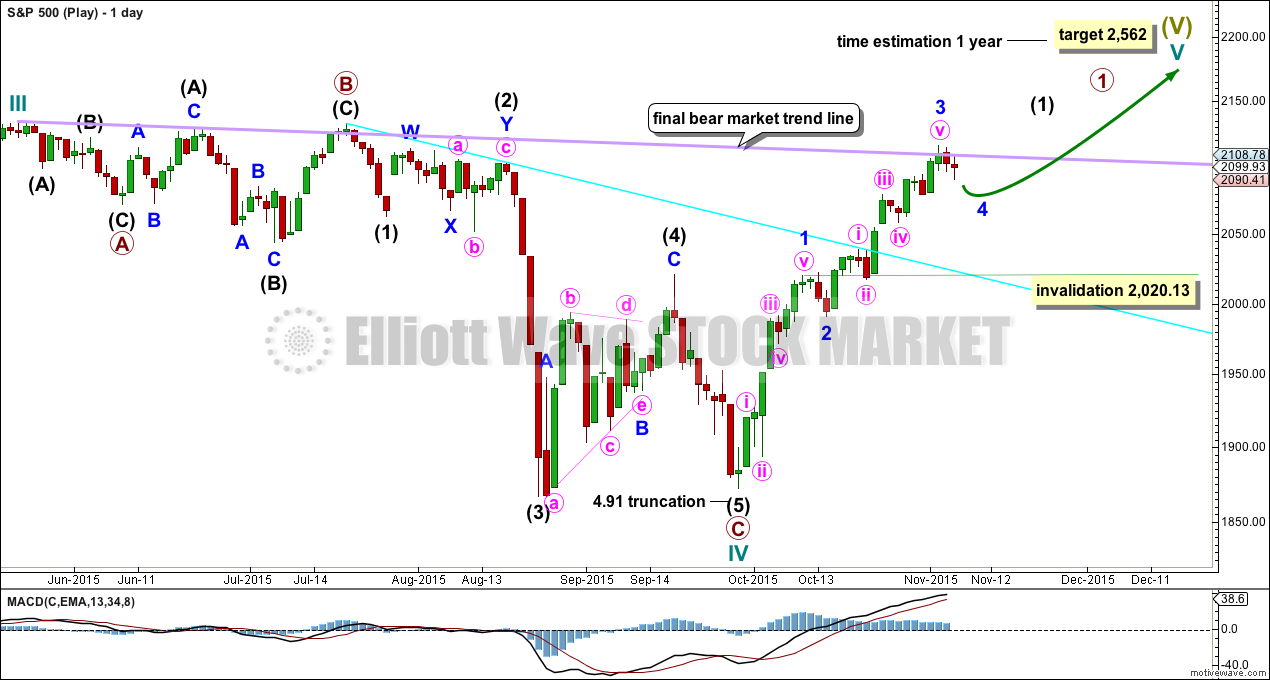
It is possible to see cycle wave IV a completed flat correction. This would provide some structural alternation with the zigzag of cycle wave II.
This is a regular flat but does not have a normal regular flat look. Primary wave C is too long in relation to primary wave A. Primary wave C would be 3.84 short of 4.236 the length of primary wave A. While it is possible to also see cycle wave IV as a complete zigzag (the subdivisions for that idea would be labelled the same as the bear wave count below, daily chart) that would not provide structural alternation with the zigzag of cycle wave II, and so I am not considering it.
This idea requires not only a new high but that the new high must come with a clear five upwards, not a three.
At 2,562 cycle wave V would reach equality in length with cycle wave I. Cycle wave I was just over one year in duration so cycle wave V should be expected to also reach equality in duration. Cycle degree waves should be expected to last about one to several years, so this expectation is reasonable. It would be extremely unlikely for this idea that cycle wave V was close to completion, because it has not lasted nearly long enough for a cycle degree wave.
I added a bear market trend line drawn using the approach outlined by Magee in “Technical Analysis of Stock Trends”. When this lilac line is clearly breached by upwards movement that shall confirm a trend change from bear to bull. The breach must be by a close of 3% or more of market value. If it comes with a clear five up, then this wave count would be further confirmed.
While price remains below the bear market trend line, we should assume the trend remains the same: downwards.
Minor wave 3 should be complete. Minor wave 4 may not move into minor wave 1 price territory below 2,020.13.
BEAR ELLIOTT WAVE COUNT
DAILY CHART
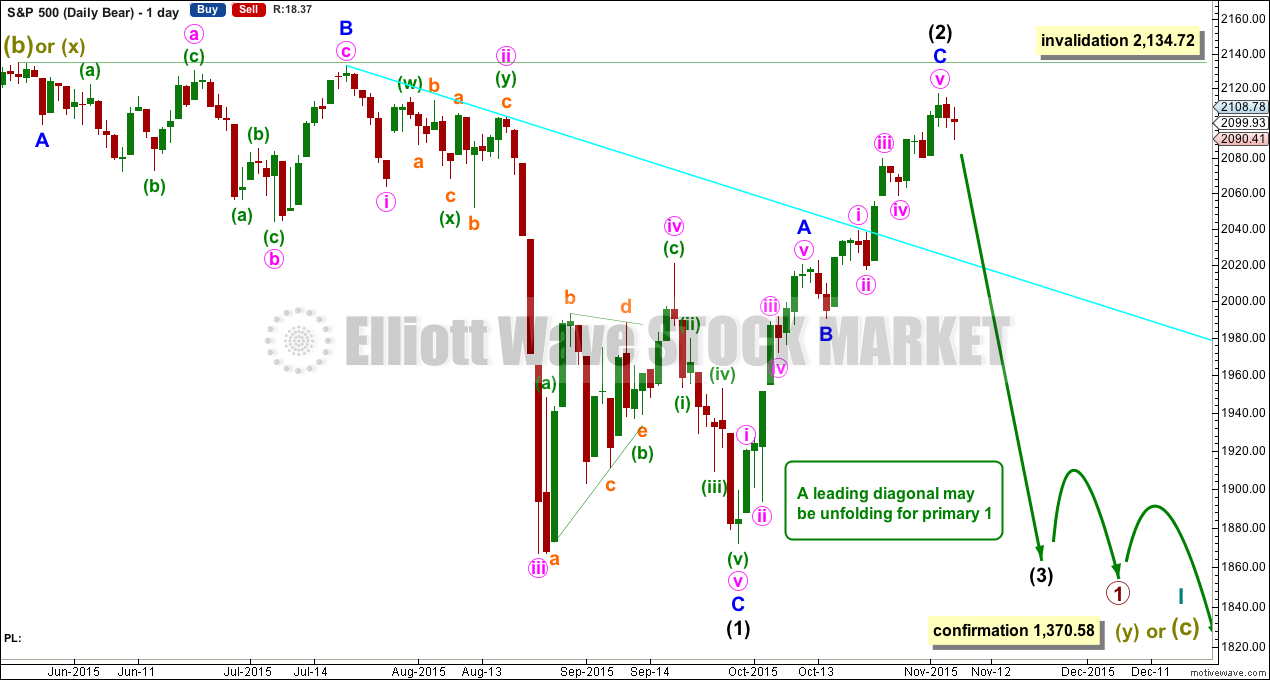
This bear wave count has a better fit at Grand Super Cycle degree and is better supported by regular technical analysis at the monthly chart level. But it is a huge call to make, so I present it second, after a more bullish wave count, and until all other options have been eliminated.
There are two ideas presented in this chart: a huge flat correction or a double flat / double combination. The huge flat is more likely. They more commonly have deep B waves than combinations have deep X waves (in my experience).
A huge flat correction would be labelled super cycle (a)-(b)-(c). It now expects a huge super cycle wave (c) to move substantially below the end of (a) at 666.79. C waves can behave like third waves. This idea expects a devastating bear market, and a huge crash to be much bigger than the last two bear markets on the monthly bear chart.
The second idea is a combination which would be labelled super cycle (w)-(x)-(y). The second structure for super cycle wave (y) would be a huge sideways repeat of super cycle wave (a) for a double flat, or a quicker zigzag for a double combination. It is also possible (least likely) that price could drift sideways in big movements for over 10 years for a huge triangle for super cycle wave (y).
The bear wave count sees a leading diagonal for a primary degree first wave unfolding. Within leading diagonals, the first, third and fifth waves are most commonly zigzags but sometimes may appear to be impulses. Here intermediate wave (1) is seen as a complete zigzag.
Intermediate wave (2) may not move beyond the start of intermediate wave (1) above 2,134.72.
Intermediate wave (3) should unfold downwards when intermediate wave (2) is complete. It must move beyond the end of intermediate wave (1) and it would most likely be a zigzag.
HOURLY CHART
The zigzag upwards for intermediate wave (2) is seen in exactly the same way as the zigzag upwards for primary wave B or X for the first two wave counts. The degree of labelling for this idea is one degree lower.
Intermediate wave (3) is most likely to be a zigzag, if this is a third wave within a leading diagonal. It must move beyond the end of intermediate wave (1) at 1,871.91. It is likely to move reasonably below that point.
Actionary waves within diagonals do not normally exhibit Fibonacci ratios to each other. The best target calculation method for intermediate wave (3) would be to use the ratios of minor waves A and C within it. That can only be done when minor waves A and B are complete, so that the length of minor wave A is known and the start of minor wave C is known.
TECHNICAL ANALYSIS
Click chart to enlarge. Chart courtesy of StockCharts.com.
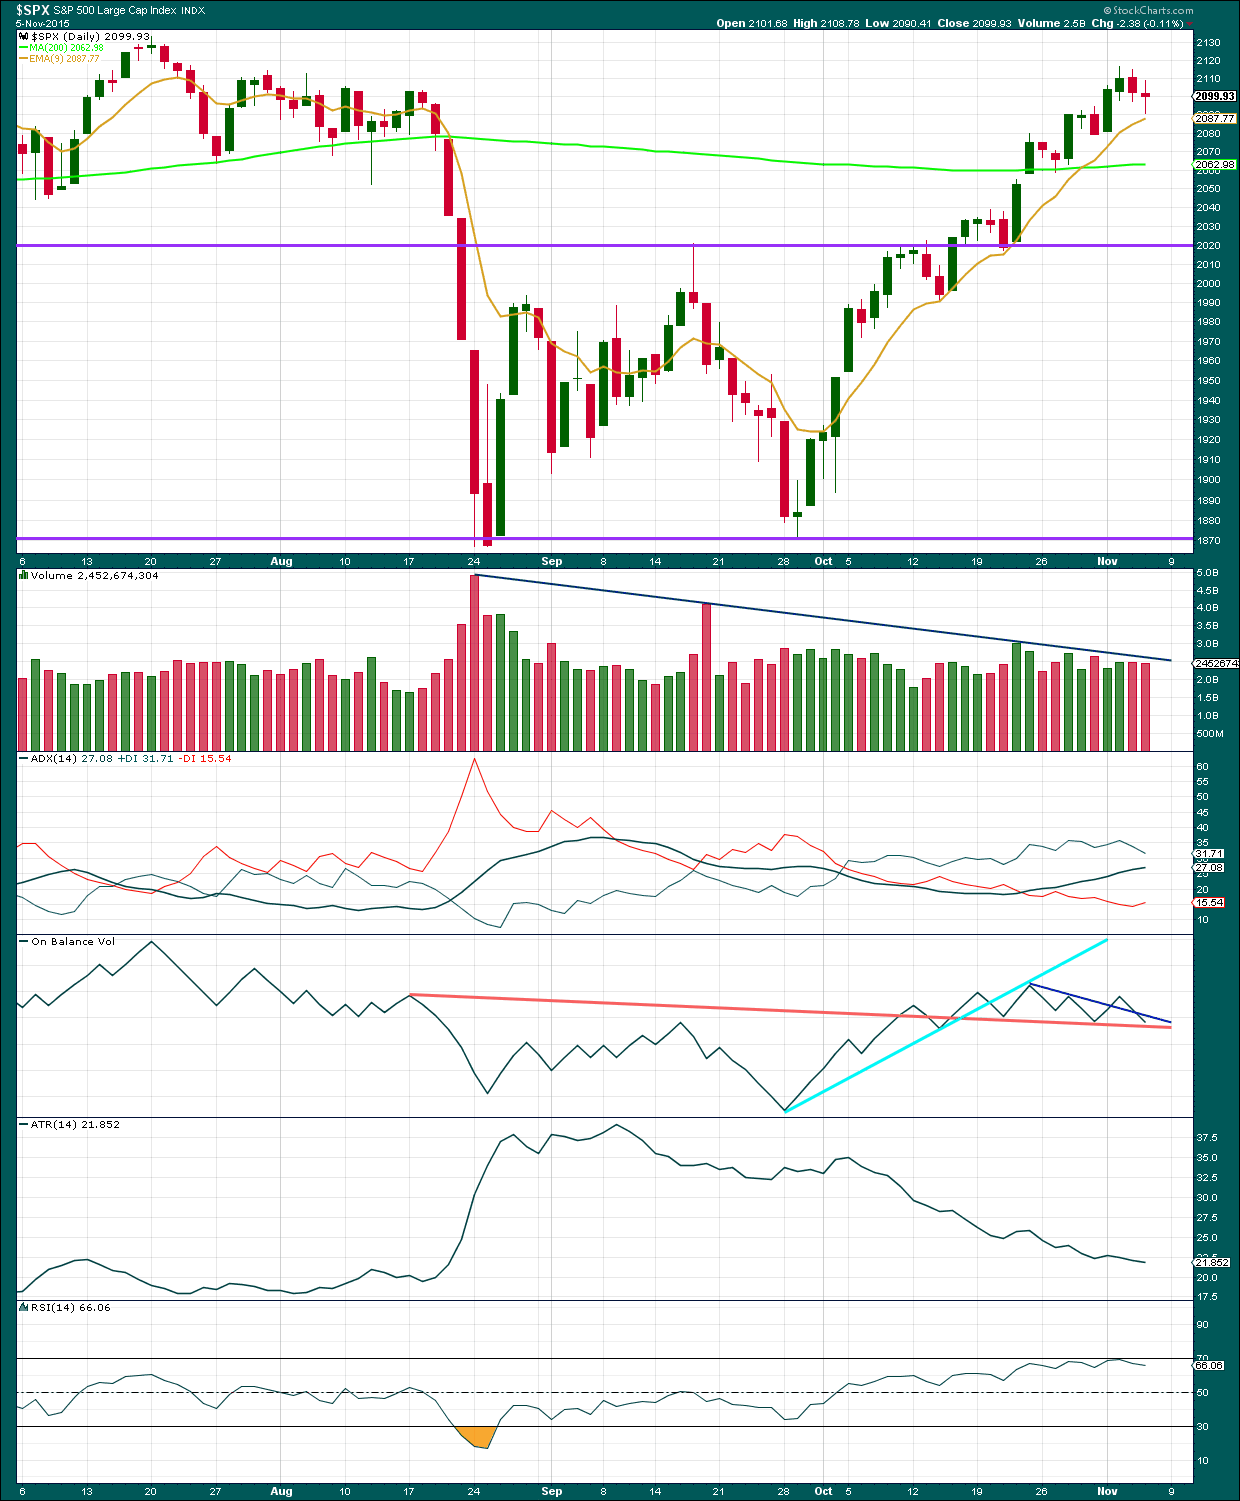
Daily: Volume is not supporting this downwards movement which is a cause for concern. Volume is not necessary for price to fall, but when price falls on light or declining volume less confidence can be had in a downwards trend.
The upwards breakout above the upper horizontal line and move above the 200 day SMA is the most bullish picture from the S&P 500 for months. It gives some concern to the bear wave count, but it is not enough to fully support the very bullish alternate wave count. The picture at the monthly chart level remains very bearish. We have not had technical confirmation of an end to the bear market yet.
The black ADX line is still above 20 and rising indicating an upwards trend is in place.
The shorter Exponential Moving Average at 9 days is reasonably well showing where price is finding support.
Average True Range continues to decline. The rise in price is not accompanied by a rise in range, which is unusual. This is more typical of price behaviour during a consolidation, not a trend. ATR along with declining momentum at the hourly chart level and a decline in volume suggest that this upwards movement for price is weak and is likely to end soon.
On Balance Volume is a leading indicator. OBV will often indicate which direction price will move when OBV breaks above/below support/resistance. At this time, OBV has come to again touch the orange trend line. Although this one is reasonably short held, shallow, and tested a few times so it is reasonably technically significant. If OBV breaks below that line tomorrow or in the next few days, it would be a bearish indication and more confidence may be had in a trend change.
A note on Dow Theory: for the bear wave count I would wait for Dow Theory to confirm a huge market crash. So far the industrials and the transportation indices have made new major swing lows, but the S&P500 and Nasdaq have not.
S&P500: 1,820.66
Nasdaq: 4,116.60
DJT: 7,700.49 – this price point was breached.
DJIA: 15,855.12 – this price point was breached.
To the upside, for Dow Theory, I am watching each index carefully. If any make new all time highs, that will be noted. If they all make new all time highs, then a continuation of a bull market would be confirmed. So far none have made new all time highs.
This analysis is published about 07:20 p.m. EST.

The nature of the exogenous shock is now crystal clear. Every talking head in the universe is confidently predicting a FED rate hike based on this morning’s jobs report. They are right in that the number completely strips the FED of any more lame excuses for not coming of a six year ZIRP. You can imagine the global consternation when they REFUSE to move on rates this year. They won’t raise rates by a single basis point because they CANNOT. As soon as the crowd figures this out the global bond market is going to implode as yields go through the ceiling. The jig’s up.
ES as of 2PM Euro time Price is again hovering around upper channel line.
VIX …………………..
Bouncing in between fibs
Timing Cycles There are 3 cycle bottoms between mid Nov and end of Dec.
Does anyone have cycle knowledge? I will try to find out more
SPX HR found the hourly 50 MA
On familiar ground once again. Has anyone kept count of how often we have been at the fore-front of what we thought was a 1-2, 1-2 count leading into a third of a third only to have Mr Market throw us a curve ball? Today’s doji does not at all seem like the stuff third waves are made of so it could be deja vu all over again 😀
One thing is certain- when the next leg come it will probably be unexpected and continue for some time. This has got to be the longest topping process ever.
I agree. That long legged green doji is bullish.
I’m not comfortable with the 1-2, 1-2 count. Not at all. I want price to make a new low below 2,058.84 before I’ll have confidence in the idea that the next wave down has begun.
It did work once before though remember. The last fall off a cliff began with the necessary 1-2, 1-2 1-2. And a third wave did show up.
So you are thinking we have higher to go Lara?
No, I don’t.
But I want to consider all possibilities.
If it is going to go higher then at this stage a double zigzag would be the only way it would look reasonable. And so I’ve charted it, even tough it doesn’t look right. Then I can figure out what price point needs to be breached to invalidate the idea, and so below that price point more confidence can be had in a trend change.
And I’ve been wrong before. I don’t want to be caught out without an alternate to road map what may happen next if the wave count is invalidated.
AAII sentiment is now higher than it was at the all-time highs and that is a contrary indicator. It seems to me that there is every possibility that this was a very sneaky intermediate second wave correction in a bear market as it has accomplished exactly what Elliott Wave Theory says second waves do to trader psychology. This movement even has me thinking bullish thoughts, and THAT, is very, very bearish 😀