
A channel breach indicates the zigzag is complete.
Targets may now be calculated for the next wave.
Summary: Both wave counts now expect downwards movement for at least a few days. The target for the bear wave count is 1,778. The bull wave count may see a zigzag down for a C wave of a triangle which must end above 1,871.91, or a three wave structure down for an A wave of a flat correction.
To see how each of the bull and bear wave counts fit within a larger time frame see the Grand Supercycle Analysis.
To see last analysis of weekly and monthly charts go here.
If I was asked to pick a winner (which I am reluctant to do) I would say the bear wave count has a higher probability. It is better supported by regular technical analysis at the monthly chart level, it fits the Grand Supercycle analysis better, and it has overall the “right look”.
New updates to this analysis are in bold.
BULL ELLIOTT WAVE COUNT
DAILY CHART – COMBINATION
Click chart to enlarge.
Cycle wave IV should exhibit alternation to cycle wave II. Cycle wave IV may find support at the teal channel on the weekly and monthly charts.
Cycle wave II was a shallow 0.41 zigzag lasting three months. Cycle wave IV should exhibit alternation in structure and maybe also alternation in depth. Cycle wave IV may end when price comes to touch the lower edge of the teal channel which is drawn about super cycle wave V using Elliott’s technique.
Cycle wave IV is likely to end within the price range of the fourth wave of one lesser degree. Because of the good Fibonacci ratio for primary wave 3 and the perfect subdivisions within it, I am confident that primary wave 4 has its range from 1,730 to 1,647.
If a zigzag is complete at the last major low as labelled, then cycle wave IV may be unfolding as a flat, combination or triangle.
The possibile structures for cycle wave IV may now be narrowed down to either a combination or a triangle. A flat may at this stage be ruled out because the B wave did not reach 90% of the A wave. I will separate the two ideas out into two daily charts.
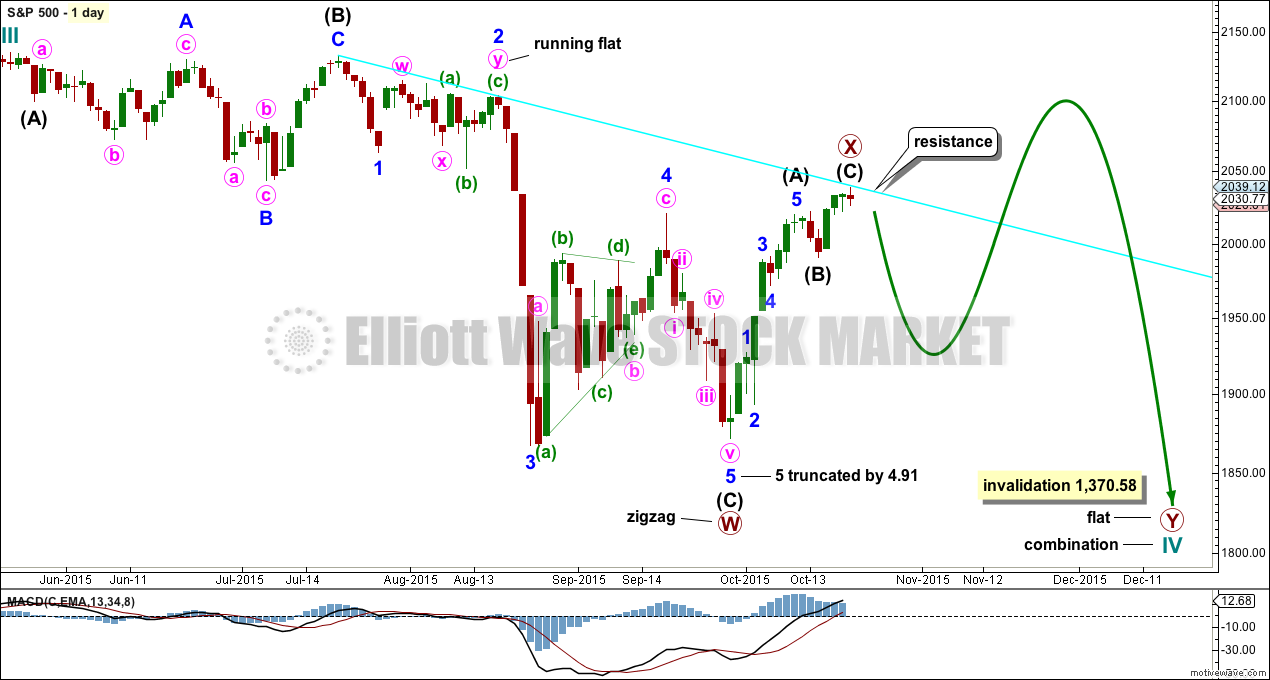
This first chart looks at a possible combination. The first structure in the double combination is a zigzag labelled primary wave W. The double is now joined by a complete three in the opposite direction, a zigzag labelled primary wave X. The second structure must be a flat correction.
Note: If the second structure were to be a triangle, then the whole of cycle wave IV would fit as a triangle. This possibility is looked at in the second daily chart. If the second structure were to be a zigzag, then that would make cycle wave IV a double zigzag which is different from a double combination, and would show inadequate alternation with the single zigzag of cycle wave II. For these reasons this first chart looks only at a possible flat correction for primary wave Y.
At this stage, primary wave B looks like it may be unfolding as a zigzag. This may still change though, if the degree of labelling within it is moved down one degree. It may be that only minor wave A is unfolding as a zigzag, if intermediate wave (B) is to be a longer lasting flat, triangle or combination.
Because there is now a five wave structure upwards on the hourly chart, this confirms that intermediate wave (B) (or maybe minor wave A within intermediate wave (B) ) was an expanded flat correction. Primary wave B or X (or minor wave A) may be subdividing so far as a simple zigzag. The structure may be close to complete, or intermediate wave (C) may extend and continue next week. I will use the wide channel on the hourly chart below to indicate when this upwards movement is over.
DAILY CHART – TRIANGLE
Click chart to enlarge.
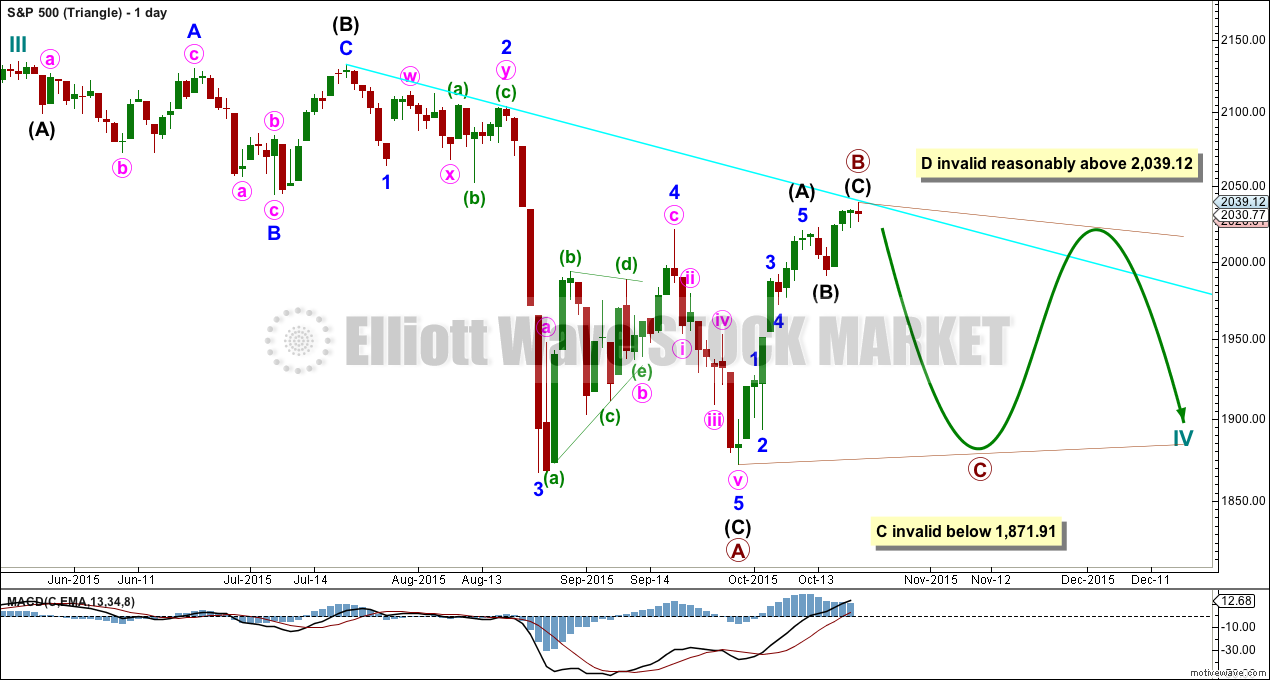
Cycle wave IV may unfold as a shallow triangle. This would provide alternation with the 0.41 zigzag of cycle wave II.
One of the five sub waves of a triangle is sometimes about 0.618 the length of its predecessor. Here primary wave B may now be a complete zigzag at 0.636 the length of primary wave A. Upwards movement may end due to resistance at the aqua blue trend line.
A single or double zigzag may unfold downwards for primary wave C. On the hourly chart, it should begin with a clear five down for a move at primary degree.
Primary wave C of a barrier or contracting triangle may not move beyond the end of primary wave A at 1,871.91.
I will consider only barrier or contracting triangle types as expanding triangles are very rare, the rarest of all Elliott Wave structures. I would only consider this possibility if it shows itself to be true. It has an exceptionally low probability.
When primary wave C is complete, then primary wave D upwards may not move beyond the end of primary wave C for a contracting triangle above 2,039.12.
For a barrier triangle, primary wave D may end about the same level as primary wave C at 2,039.12 as long as the B-D trend line is essentially flat. What this means in practice is that D can end slightly above B at 2,039.12. This is the only Elliott Wave rule which is not black and white.
The final wave of the triangle for primary wave E may not move beyond the end of primary wave C.
The whole structure moves sideways in an ever decreasing range. The purpose of triangles is to take up time and move price sideways.
At the hourly chart level, this idea requires a five down to begin the A wave of a single or double zigzag. The subdivisions are the same, so only one hourly chart is presented for these two daily charts for cycle wave IV.
HOURLY CHART
Click chart to enlarge.
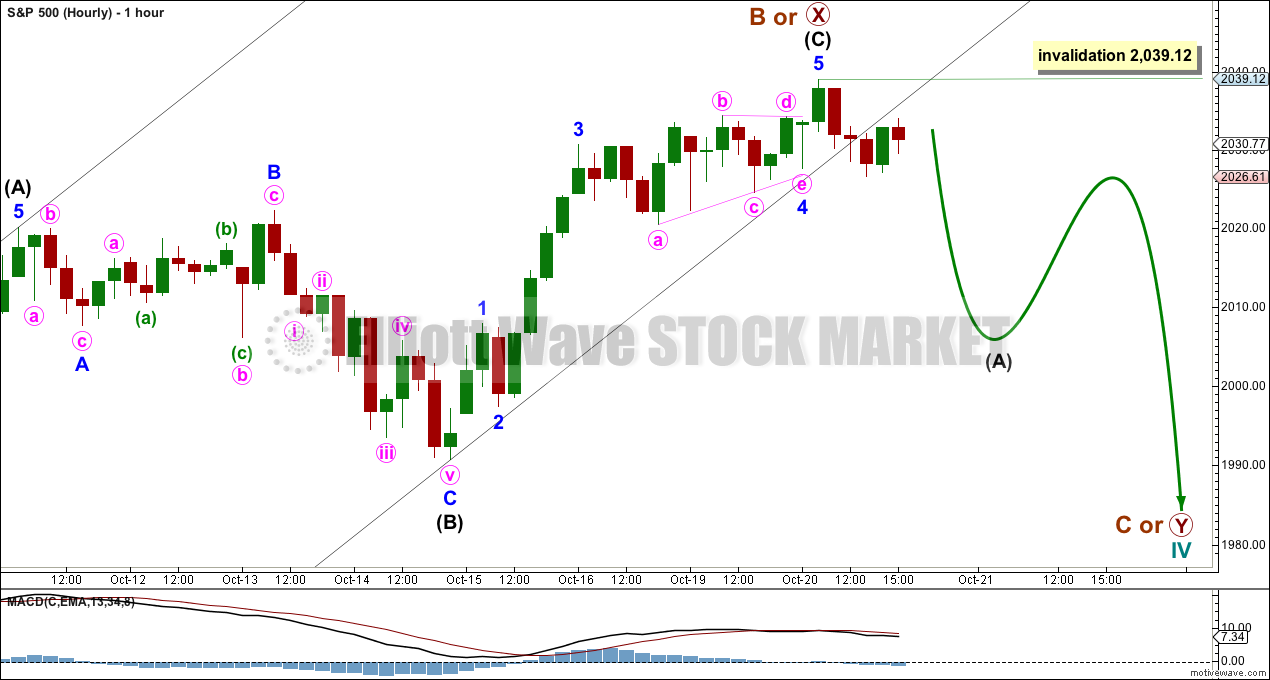
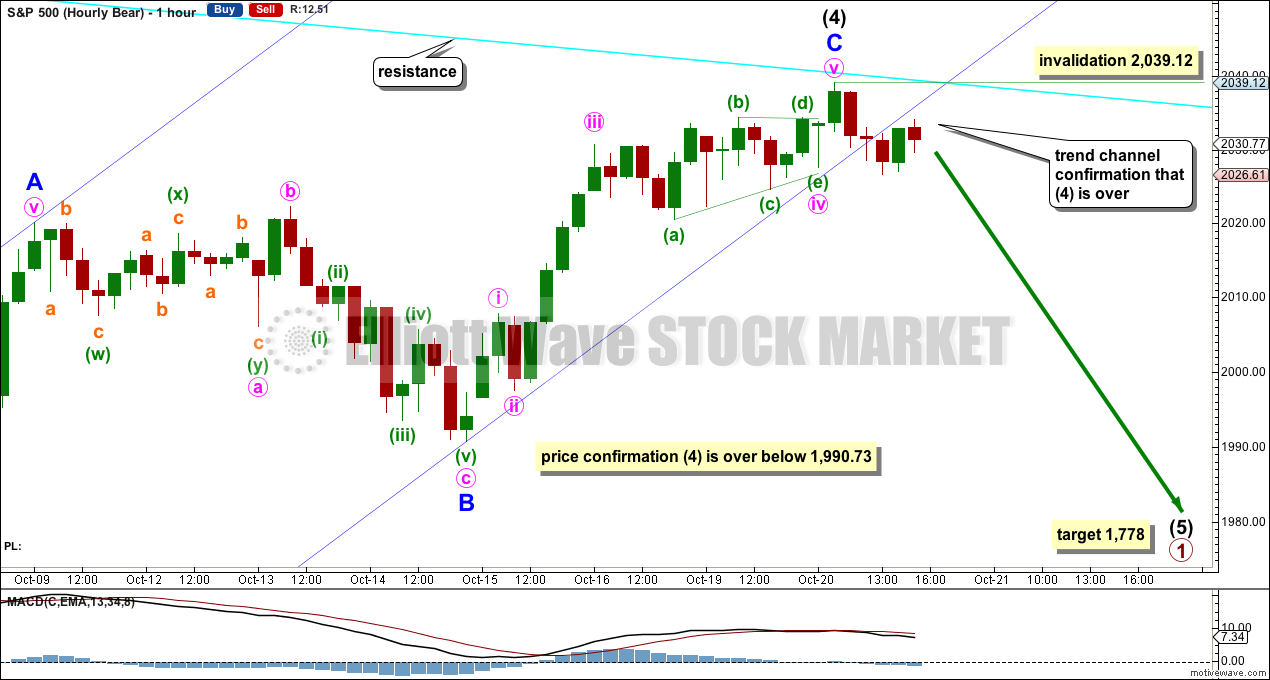
There is now a clear breach of the channel containing the zigzag labelled primary wave X. Downwards movement will subdivide as a five on the five minute chart. It is highly likely that upwards movement is over here because the channel is breached and the structure of intermediate wave (C) is complete.
Primary wave Y must begin with a five wave structure down at the hourly chart level.
If cycle wave IV is a combination, then primary wave Y must be a flat correction, so intermediate wave (A) must be a three wave structure. It would most likely be a zigzag, but it may also be a flat or combination. It may not be a triangle.
If cycle wave IV is a triangle, then primary wave C downwards may be a single or double zigzag.
These different ideas may require separate hourly wave counts once the first five down is complete. For now this one will do.
No second wave correction may move beyond the start of its first wave above 2,039.12 within the first five down.
ALTERNATE BULL ELLIOTT WAVE COUNT
DAILY CHART
Click chart to enlarge.
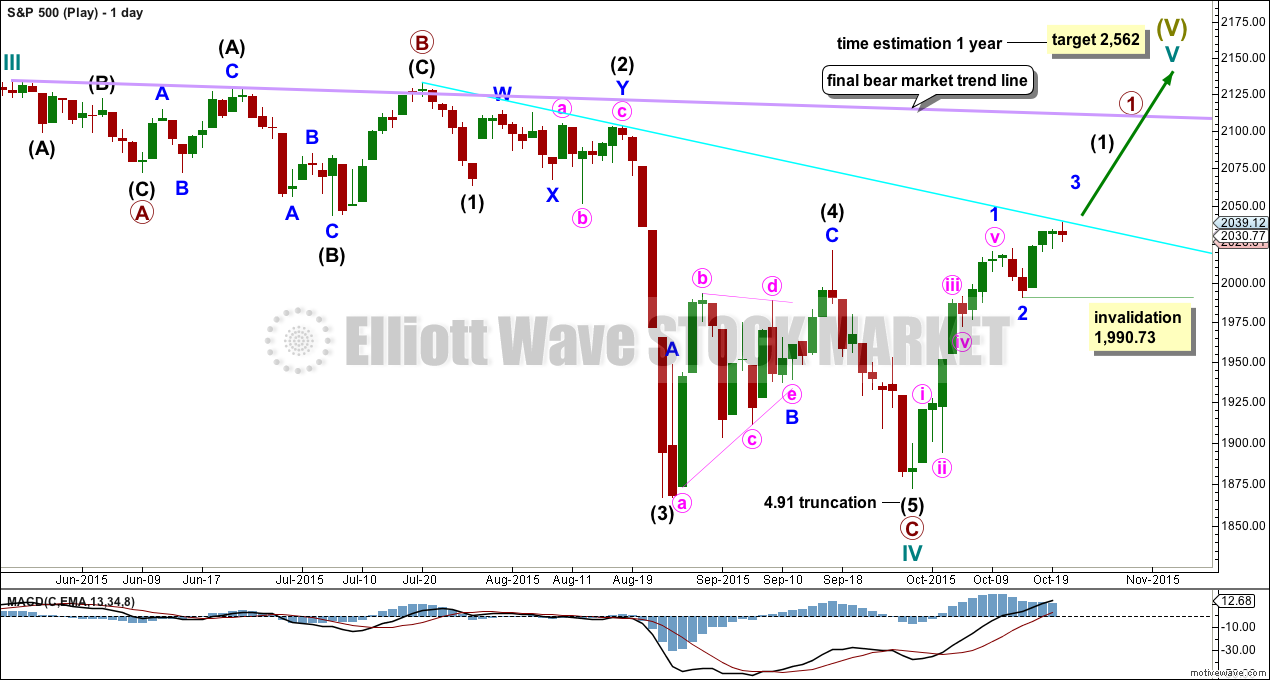
It is possible to see cycle wave IV a completed flat correction. This would provide some structural alternation with the zigzag of cycle wave II.
This is a regular flat but does not have a normal regular flat look. Primary wave C is too long in relation to primary wave A. Primary wave C would be 3.84 short of 4.236 the length of primary wave A. While it is possible to also see cycle wave IV as a complete zigzag (the subdivisions for that idea would be labelled the same as the bear wave count below, daily chart) that would not provide structural alternation with the zigzag of cycle wave II, and so I am not considering it.
This idea requires not only a new high but that the new high must come with a clear five upwards, not a three.
At 2,562 cycle wave V would reach equality in length with cycle wave I. Cycle wave I was just over one year in duration so cycle wave V should be expected to also reach equality in duration.
I added a bear market trend line drawn using the approach outlined by Magee in “Technical Analysis of Stock Trends”. When this lilac line is clearly breached by upwards movement that shall confirm a trend change from bear to bull. If it comes with a clear five up, then this wave count would be further confirmed.
While price remains below the bear market trend line, we should assume the trend remains the same: downwards.
The invalidation point for this idea now must be moved up. Minor wave 2 is a complete expanded flat correction and minor wave 3 is beginning. No second wave correction may move beyond its start below 1,990.73 within minor wave 3.
BEAR ELLIOTT WAVE COUNT
DAILY CHART
Click chart to enlarge.
This bear wave count has a better fit at Grand Super Cycle degree and is better supported by regular technical analysis at the monthly chart level. But it is a huge call to make, so I present it second, after a more bullish wave count, and until all other options have been eliminated.
There are two ideas presented in this chart: a huge flat correction or a double flat / double combination. The huge flat is more likely. They more commonly have deep B waves than combinations have deep X waves (in my experience).
A huge flat correction would be labelled super cycle (a)-(b)-(c). It now expects a huge super cycle wave (c) to move substantially below the end of (a) at 666.79. C waves can behave like third waves. This idea expects a devastating bear market, and a huge crash to be much bigger than the last two bear markets on the monthly bear chart.
The second idea is a combination which would be labelled super cycle (w)-(x)-(y). The second structure for super cycle wave (y) would be a huge sideways repeat of super cycle wave (a) for a double flat, or a quicker zigzag for a double combination. It is also possible (least likely) that price could drift sideways in big movements for over 10 years for a huge triangle for super cycle wave (y).
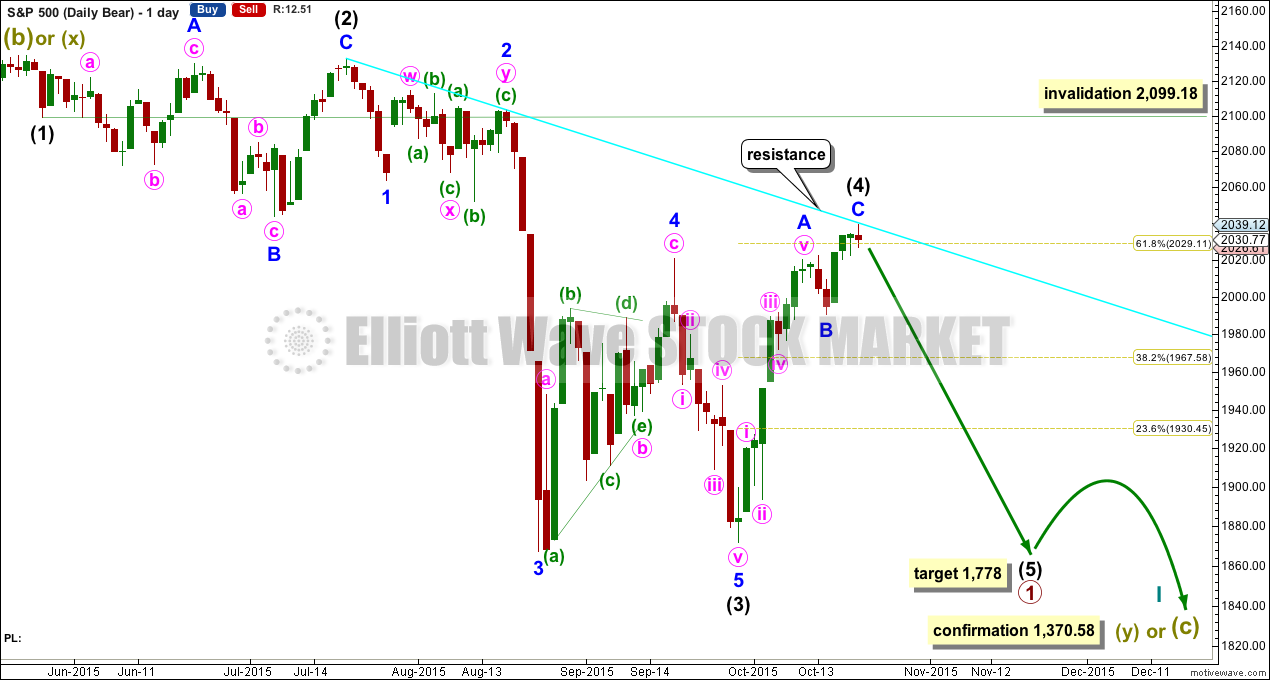
I am now seeing a third wave complete at the last major low for intermediate wave (3). Intermediate wave (3) is 17.31 longer than 6.854 the length of intermediate wave (1).
Minor wave 5 is seen as complete and slightly truncated.
A channel drawn using Elliott’s technique no longer works. Sometimes fourth waves aren’t contained within such a channel, which is why Elliott developed a second technique to use when they breach the channel.
Intermediate wave (2) was a very deep 0.95 expanded flat lasting 38 sessions. Intermediate wave (4) should exhibit alternation, is most likely to be more shallow, and be a quicker zigzag or zigzag multiple.
Intermediate wave (4) may have ended as a single zigzag in a total 15 sessions, with no Fibonacci duration. It may have ended when price found resistance at the aqua blue trend line.
If intermediate wave (4) continues higher (and it technically could as a double zigzag, although this has a low probability), then it may not move into intermediate wave (1) price territory above 2,099.18.
A new low below 1,990.73 would provide price confirmation that intermediate wave (4) is over. At that stage, I would move the invalidation point on the daily chart down to the high of intermediate wave (4).
HOURLY CHART
Click chart to enlarge.
Minute wave iv continued further sideways as a barrier triangle. This was followed by a typically short brief fifth wave. There is no Fibonacci ratio between minor waves A and C.
Ratios within minor wave C are: there is no Fibonacci ratio between minute waves iii and i, and minute wave v is 0.93 longer than 0.618 the length of mintute wave i.
At 1,778 intermediate wave (5) would reach equality in length with intermediate wave (3).
No second wave correction may move beyond the start of its first wave above 2,039.12 within intermediate wave (5).
TECHNICAL ANALYSIS
Click chart to enlarge. Chart courtesy of StockCharts.com.
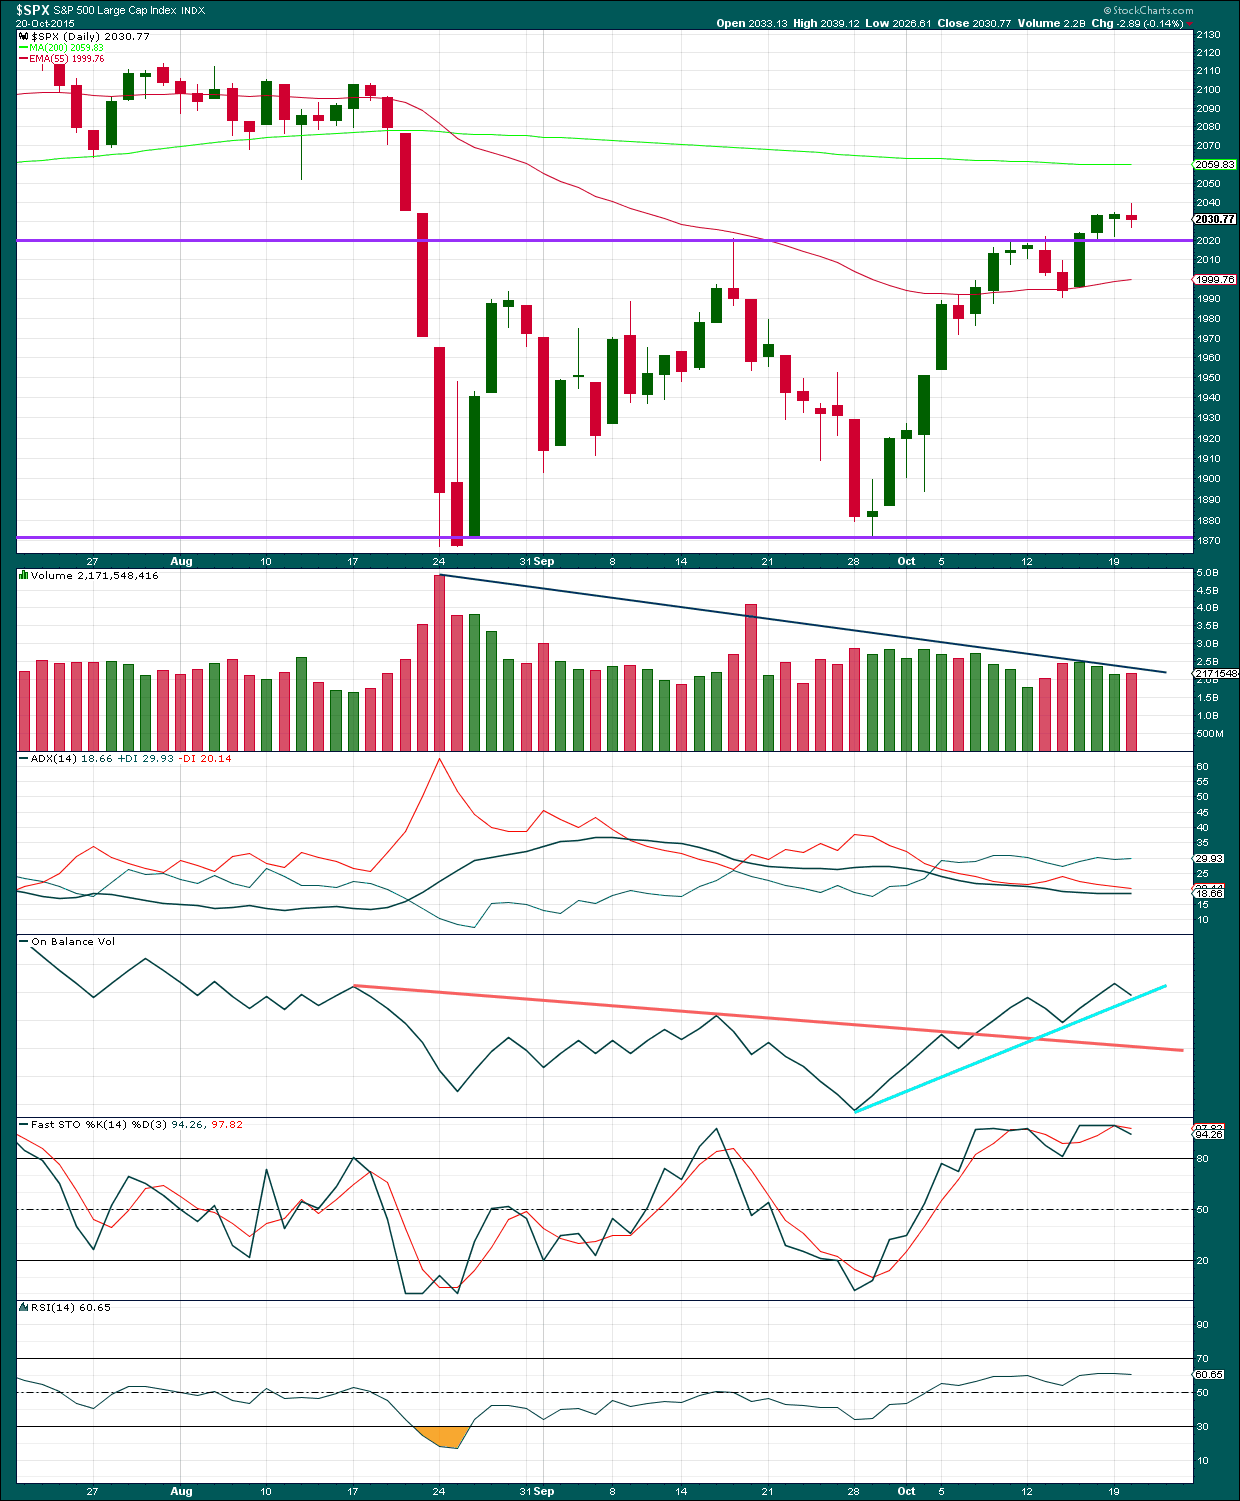
Daily: Tuesday’s small red doji comes on light volume, slightly higher than the prior green candlestick. This candlestick represents a balance of bulls and bears, indecision, with the bears slightly in charge and showing a slight increase in activity with a slight increase in volume.
Price may have found some support at the horizontal trend line. All Elliott wave counts expect price to break back below that trend line very soon. There is some support for that idea in that the break above the trend line was not likely a breakout as it came on declining volume. An upwards breakout more reliably comes on an increase in volume. If price does manage to break below support at the trend line, I would have more confidence in the Elliott wave counts.
The black ADX line is flat and below 20 indicating the market is not trending. Overall volume is declining while price moves sideways. During this sideways consolidation contained within support and resistance lines it is a downwards day which shows clearly strongest volume. This indicates the breakout is most likely to be down. This trick does not always work, but it works often enough to be a good indicator of the breakout direction.
A range bound system should be used while price remains range bound. The idea outlined here is simple, and simple is usually best. When Stochastics reaches overbought and price reaches resistance expect the end of the upwards swing and a downwards swing to begin. Expect the downwards swing to continue until Stochastics reaches oversold and price reaches support. The problem with this approach (and the reason why trading a range bound market is inherently very risky) is neither Stochastics nor support / resistance lines will show exactly where and when price will turn as they are only general guides. Stochastics can remain extreme for a few days and price can overshoot support / resistance before turning back. Trading a range bound market must be done only with careful money management. Alternatively, step aside and wait for a clear trend to emerge before reentering this market.
Volume overall is still declining during this consolidation, an upwards breakout is not indicated.
On Balance Volume has come to touch the short held bright blue trend line. This may provide a little support, but this line is not very technically significant.
A note on Dow Theory: for the bear wave count I would wait for Dow Theory to confirm a huge market crash. So far the industrials and the transportation indices have made new major swing lows, but the S&P500 and Nasdaq have not.
S&P500: 1,820.66
Nasdaq: 4,116.60
DJT: 7,700.49 – this price point was breached.
DJIA: 15,855.12 – this price point was breached.
This analysis is published about 08:44 p.m. EST.
Hi Lara,
I see that we went to a new high subsequent to your publication.
At what degree is a five wave reversal valid? Can it be as low as a minute or should it be at an hourly or 15 min degree for firmer confirmation of a trend change?
There was a slight new high the day before, for the 20th. I must assume that is what you mean by “we went to a new high subsequent to your publication”, which would have been subsequent to publication of last analysis, not this one.
at what degree is a five wave reversal valid? A very good question.
It is valid at the degree that the following movement travels to would be a short answer. For example (and the following comment should be read alongside the first hourly chart above) the low of the session for 21st was below the end of the fourth wave triangle. The reversal would be valid at minor degree; minor wave 5 cannot be continuing because a new low is made below its start.
When there is a new low below the start of intermediate wave (C) then the reversal would be valid at intermediate degree. At that stage intermediate wave (C) could not be continuing.