
Some upwards movement was expected for Thursday, but a little more downwards movement to 1,986 – 1,984 was expected first which did not happen.
Summary: The S&P remains within a consolidation; the Elliott wave count has the consolidation as either a fourth wave or B wave. If upwards movement continues tomorrow, then the correction may be almost over. The target is at 2,047 but may be too high. Look for upwards movement to find strong resistance and end if price comes up to touch the bright aqua blue trend line. Alternatively, a new low below 2,007.86 would indicate the correction will be more complicated and longer lasting. A target for downwards movement would then be at 1,976.
To see how each of the bull and bear wave counts fit within a larger time frame see the Grand Supercycle Analysis.
To see last analysis of weekly and monthly charts go here.
If I was asked to pick a winner (which I am reluctant to do) I would say the bear wave count has a higher probability. It is better supported by regular technical analysis at the monthly chart level, it fits the Grand Supercycle analysis better, and it has overall the “right look”.
New updates to this analysis are in bold.
BULL ELLIOTT WAVE COUNT
DAILY CHART
Click chart to enlarge.
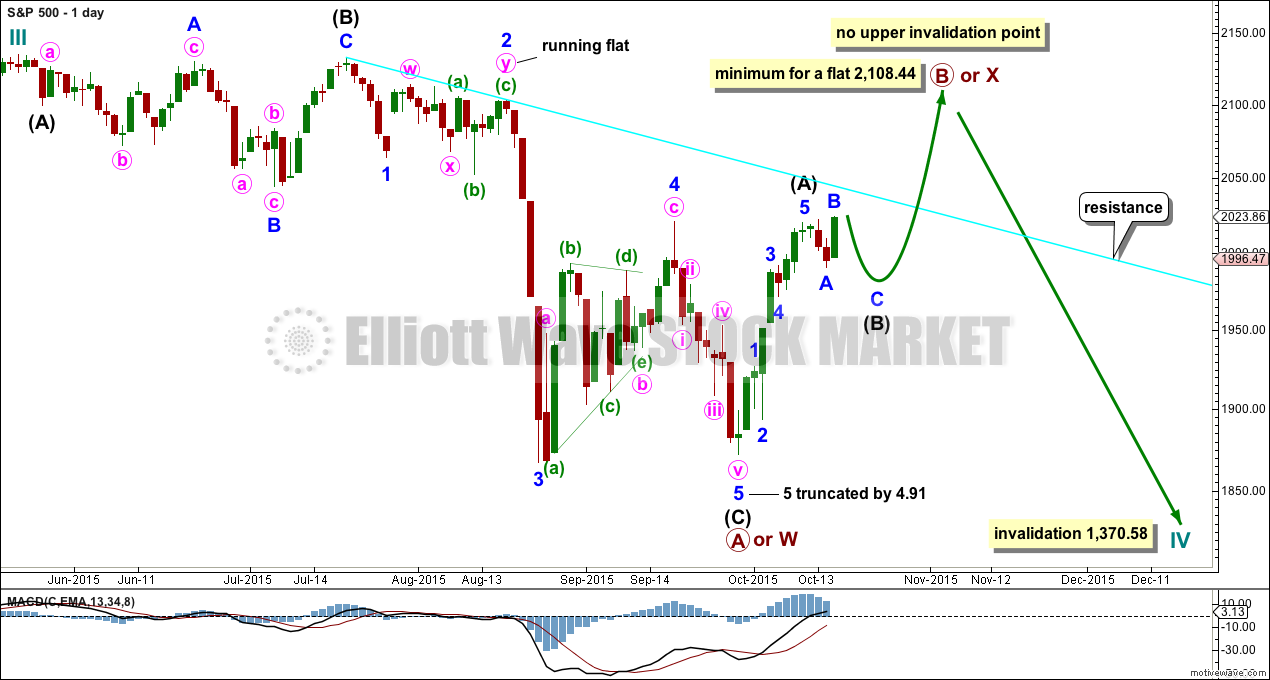
Cycle wave IV should exhibit alternation to cycle wave II. Cycle wave IV may find support at the teal channel on the weekly and monthly charts.
Cycle wave II was a shallow 0.41 zigzag lasting three months. Cycle wave IV should exhibit alternation in structure and maybe also alternation in depth. Cycle wave IV may end when price comes to touch the lower edge of the teal channel which is drawn about super cycle wave V using Elliott’s technique.
Cycle wave IV is likely to end within the price range of the fourth wave of one lesser degree. Because of the good Fibonacci ratio for primary wave 3 and the perfect subdivisions within it, I am confident that primary wave 4 has its range from 1,730 to 1,647.
If a zigzag is complete at the last major low as labelled, then cycle wave IV may be unfolding as a flat, combination or triangle.
If cycle wave IV is a flat correction, then within it primary wave B must subdivide as a corrective structure (a three or a triangle) and must end at least 90% the length of primary wave A at 2,108.44. Primary wave B of an expanded flat may make a new all time high above 2,134.72. There is no upper invalidation point for this idea.
If cycle wave IV is a combination, then it would be labelled primary waves W-X-Y. Primary wave X may be any corrective structure and it has no minimum requirement, unlike the B wave within a flat. X waves within combinations are most often deep corrections to achieve the purpose of a sideways movement. X waves may move beyond the start of W waves. There is no upper invalidation point for this idea either.
If cycle wave IV is a triangle, then primary wave B upwards has no minimum requirement, must subdivide as a three wave structure (most likely a zigzag), and may also make a new all time high as in a running triangle. There is no upper invalidation point for this idea either.
Of all Elliott waves it is B waves which exhibit the greatest variety in structure and form. They are extremely difficult to analyse. Often, it is only when they are complete that their structure can be determined.
At this stage, primary wave B looks like it may be unfolding as a zigzag. This may change though.
The question about this wave count today is whether or not intermediate wave (B) is complete. If the degree of labelling on the hourly chart below is correct, then it is only two thirds complete. If the degree of labelling on the hourly bear chart is correct, then intermediate wave (B) would be complete at Wednesday’s low. Both possibilities are equally likely for this wave count.
HOURLY CHART
Click chart to enlarge.
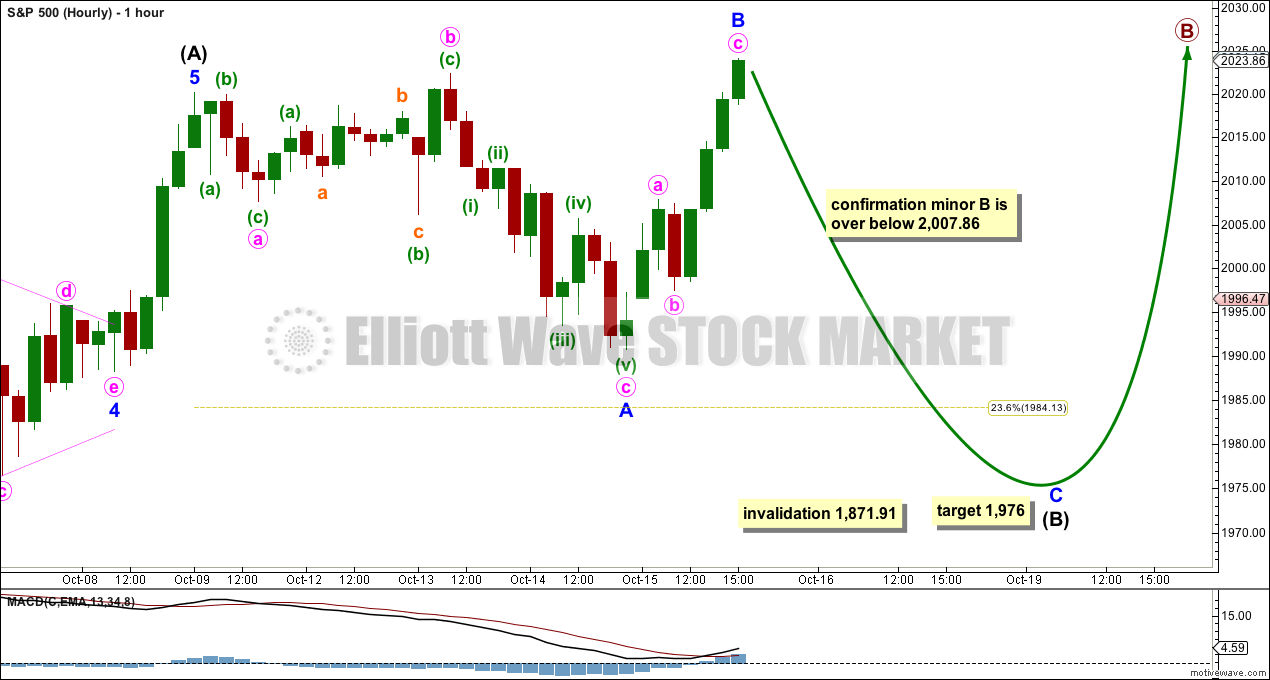
Intermediate wave (B) may be an incomplete expanded flat correction. It may also be an incomplete running triangle, or combination.
If intermediate wave (B) is an expanded flat as labelled, then within it minor wave B may be over as a 1.14 length of minor wave A. At 1,976 minor wave C would reach 1.618 the length of minor wave A.
If intermediate wave (B) is a running triangle, then minor wave B within it is a complete zigzag. Minor wave C should unfold downwards as a single or double zigzag which may not move beyond the end of minor wave A below 1,990.73. A triangle could continue sideways in an ever decreasing range for several days.
If intermediate wave (B) is a combination, then within it minor wave A would be relabelled minor wave W, an expanded flat. The double may be joined by a completed three in the opposite direction as a zigzag. Minor wave B would be relabelled as minor wave X. A second corrective structure may unfold about there for minor wave Y as either a flat (for a double flat) or a zigzag or triangle for a double combination.
Equally as likely, the degree of labelling within minor wave A may be moved up one degree because intermediate wave (B) may have ended there as an expanded flat correction. The hourly bear wave count chart illustrates this idea and works in exactly the same way for this wave count.
The variety possible for B waves makes them very difficult to analyse. This is why at the start of this movement I was careful to state that analysis would focus on identifying when this B wave is over, and it is impossible for me to be accurate about the pathway price may take while it unfolds. That is still the case today.
A new low below 2,007.86 would confirm the upwards wave labelled minor wave B is complete and was a three wave structure. That would be strong indication that intermediate wave (B) would not be over and would be continuing yet further, mostly sideways.
ALTERNATE BULL ELLIOTT WAVE COUNT
DAILY CHART
Click chart to enlarge.
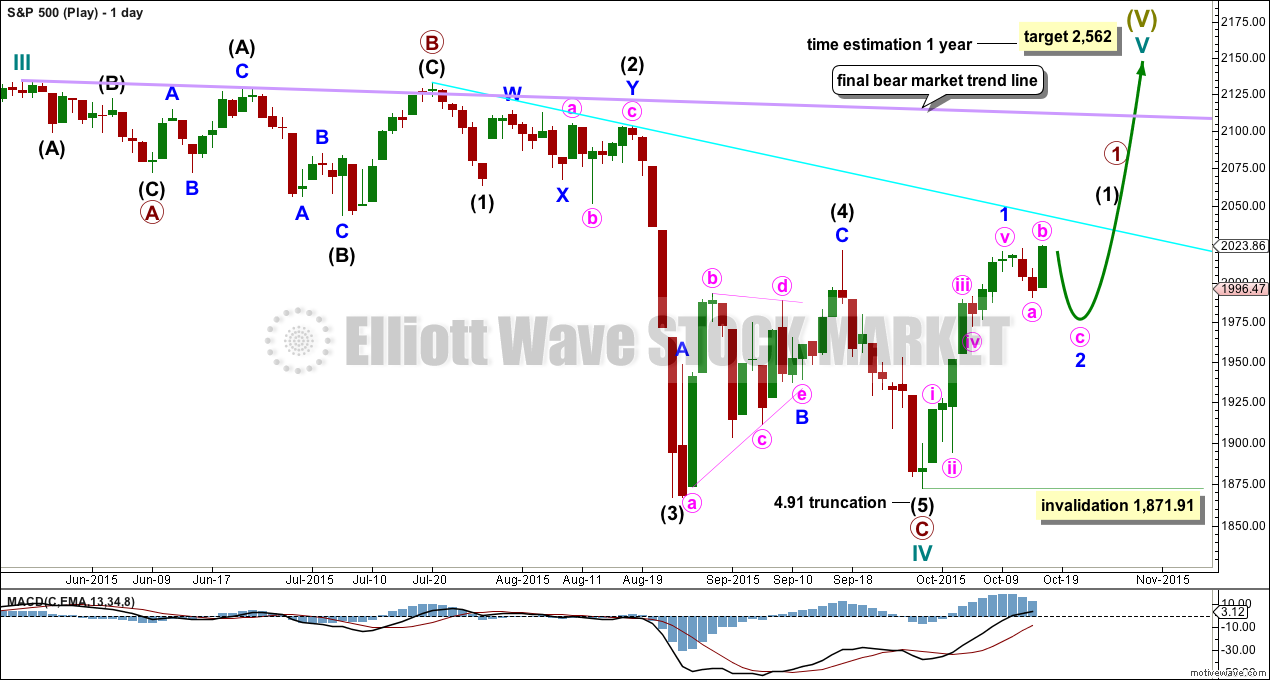
It is possible to see cycle wave IV a completed flat correction. This would provide some structural alternation with the zigzag of cycle wave II.
This is a regular flat but does not have a normal regular flat look. Primary wave C is too long in relation to primary wave A. Primary wave C would be 3.84 short of 4.236 the length of primary wave A. While it is possible to also see cycle wave IV as a complete zigzag (the subdivisions for that idea would be labelled the same as the bear wave count below, daily chart) that would not provide structural alternation with the zigzag of cycle wave II, and so I am not considering it.
This idea requires not only a new high but that the new high must come with a clear five upwards, not a three.
At 2,562 cycle wave V would reach equality in length with cycle wave I. Cycle wave I was just over one year in duration so cycle wave V should be expected to also reach equality in duration.
I added a bear market trend line drawn using the approach outlined by Magee in “Technical Analysis of Stock Trends”. When this lilac line is clearly breached by upwards movement that shall confirm a trend change from bear to bull. If it comes with a clear five up, then this wave count would be further confirmed.
While price remains below the bear market trend line, we should assume the trend remains the same: downwards.
BEAR ELLIOTT WAVE COUNT
DAILY CHART
Click chart to enlarge.
This bear wave count has a better fit at Grand Super Cycle degree and is better supported by regular technical analysis at the monthly chart level. But it is a huge call to make, so I present it second, after a more bullish wave count, and until all other options have been eliminated.
There are two ideas presented in this chart: a huge flat correction or a double flat / double combination. The huge flat is more likely. They more commonly have deep B waves than combinations have deep X waves (in my experience).
A huge flat correction would be labelled super cycle (a)-(b)-(c). It now expects a huge super cycle wave (c) to move substantially below the end of (a) at 666.79. C waves can behave like third waves. This idea expects a devastating bear market, and a huge crash to be much bigger than the last two bear markets on the monthly bear chart.
The second idea is a combination which would be labelled super cycle (w)-(x)-(y). The second structure for super cycle wave (y) would be a huge sideways repeat of super cycle wave (a) for a double flat, or a quicker zigzag for a double combination. It is also possible (least likely) that price could drift sideways in big movements for over 10 years for a huge triangle for super cycle wave (y).
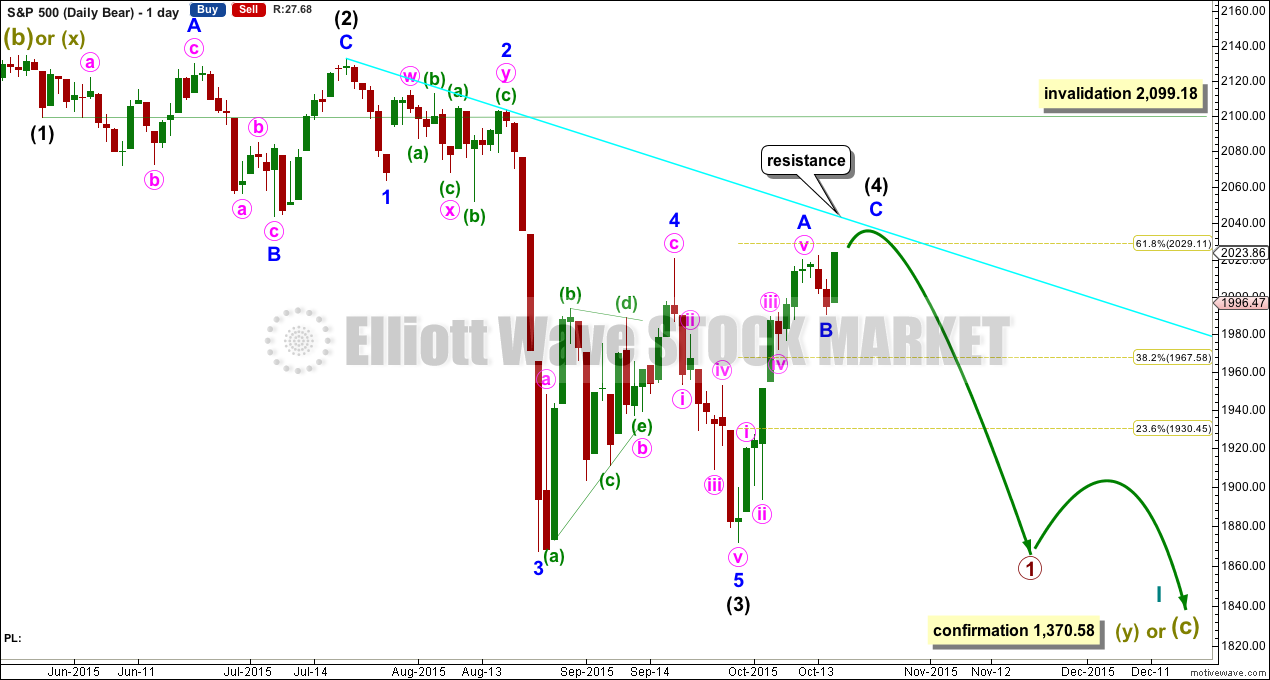
I am now seeing a third wave complete at the last major low for intermediate wave (3). Intermediate wave (3) is 17.31 longer than 6.854 the length of intermediate wave (1).
Minor wave 5 is seen as complete and slightly truncated.
A channel drawn using Elliott’s technique no longer works. Sometimes fourth waves aren’t contained within such a channel, which is why Elliott developed a second technique to use when they breach the channel.
Intermediate wave (2) was a very deep 0.95 expanded flat lasting 38 sessions. Intermediate wave (4) should exhibit alternation, is most likely to be more shallow, and be a quicker zigzag or zigzag multiple. It may not move into intermediate wave (1) price territory above 2,099.18.
At this stage, it looks like intermediate wave (4) is unfolding as a zigzag.
Intermediate wave (4) may be almost over. It may end in a total Fibonacci 21 sessions which would see it continue now for a further 9 sessions. Alternatively, at this stage, it is also possible it may come to a quicker end: a further one session would see it complete in a total Fibonacci 13 sessions.
HOURLY CHART
Click chart to enlarge.
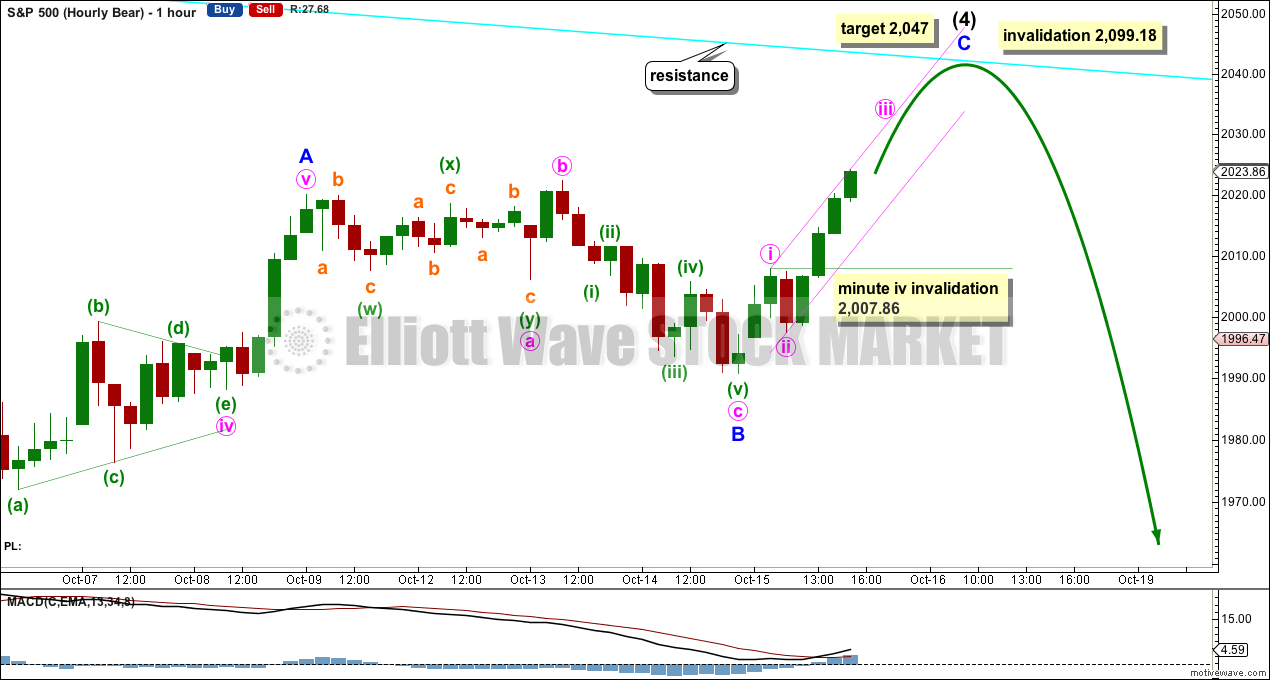
Intermediate wave (4) for this bear wave count is seen as unfolding as a zigzag in exactly the same way as primary wave B for the first wave count.
Minor wave B may have been complete at Wednesday’s low. It did not continue any lower.
Minor wave C must subdivide as a five wave structure and may be an incomplete impulse. Minor wave C requires minute waves iv and v to complete it, and minute wave iv may not move into minute wave i price territory below 2,007.86.
Draw an acceleration channel about minor wave C: draw the first trend line from the high of minute wave i to the last high, as price moves higher redraw this line, then place a parallel copy on the low of minute wave ii. When minute wave iii is complete this would be a channel drawn using Elliott’s first technique and it may show where minute wave iv finds support. Minute wave v may end either midway within the channel or about the upper edge.
Once minor wave C looks like a five wave impulse a subsequent breach of the lower edge of this channel would indicate minor wave C would likely be over, so intermediate wave (4) may then be a complete zigzag.
At 2,047 minor wave C would reach 0.382 the length of minor wave A. This target may be too high though because it would expect an overshoot of the bright aqua blue trend line which may provide strong resistance.
Intermediate wave (4) may not move into intermediate wave (1) price territory above 2,099.18.
Alternatively, it is equally as likely that minor wave B is incomplete as per the first hourly chart above. The degree of labelling within minor wave B may be moved down one degree; this may have only been minute wave a within minor wave B. Only a clear five up would invalidate that idea.
TECHNICAL ANALYSIS
DAILY CHART
Click chart to enlarge. Chart courtesy of StockCharts.com.
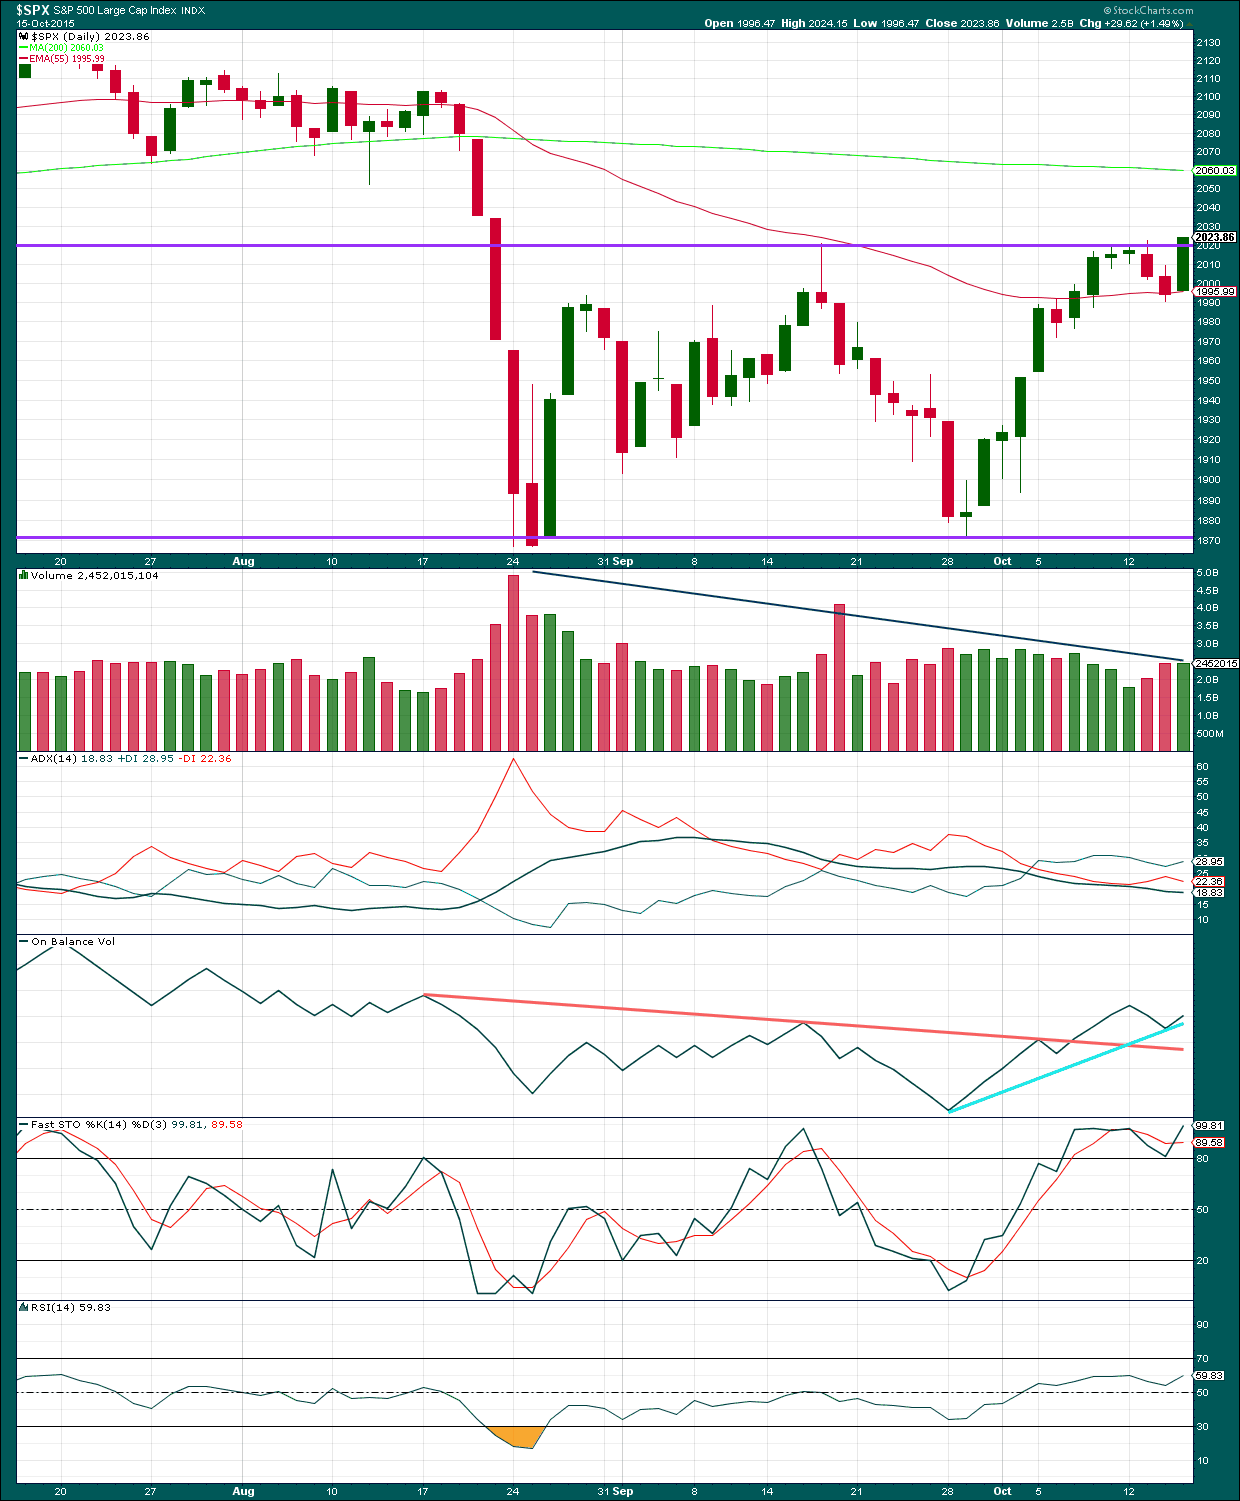
The horizontal lines of resistance and support outwards contain all recent sideways movement. To reliably indicate a breakout one of these lines needs to be breached. If a breach comes on increased volume, then a breakout would be indicated.
The black ADX line points slowly lower indicating the market is not trending. Overall volume is declining while price moves sideways. During this sideways consolidation contained within support and resistance lines it is a downwards day which shows clearly strongest volume. This indicates the breakout is most likely to be down. This trick does not always work, but it works often enough to be a good indicator of the breakout direction.
A range bound system should be used while price remains range bound. The idea outlined here is simple, and simple is usually best. When Stochastics reaches overbought and price reaches resistance expect the end of the upwards swing and a downwards swing to begin. Expect the downwards swing to continue until Stochastics reaches oversold and price reaches support. The problem with this approach (and the reason why trading a range bound market is inherently very risky) is neither Stochastics nor support / resistance lines will show exactly where and when price will turn as they are only general guides. Stochastics can remain extreme for a few days and price can overshoot support / resistance before turning back. Trading a range bound market must be done only with careful money management. Alternatively, step aside and wait for a clear trend to emerge before reentering this market.
Upwards movement for Thursday’s session has some small support with volume slightly increased. Volume overall is still declining during this consolidation, an upwards breakout is not indicated.
On Balance Volume shows small bearish divergence with price. Today price made a slight new high above the high of two days ago, but OBV did not. OBV is not working very well with the two trend lines drawn here because they are weak, but they might help to show where downwards movement may stall.
A note on Dow Theory: for the bear wave count I would wait for Dow Theory to confirm a huge market crash. So far the industrials and the transportation indices have made new major swing lows, but the S&P500 and Nasdaq have not.
S&P500: 1,820.66
Nasdaq: 4,116.60
DJT: 7,700.49 – this price point was breached.
DJIA: 15,855.12 – this price point was breached.
This analysis is published about 08:40 p.m. EST.
The fourth wave wasn’t contained within the channel. The S&P just doesn’t work with those channels always very well.
I’ll now use Elliott’s second technique to redraw the channel: from ii to iv with a copy on iii. I expect the final fifth wave up is underway now, target recalculated to 2,037 where v = i.
That target should also see price find resistance at the aqua blue trend line.
If the target is wrong it’s going to be too high because price is finding resistance also at the horizontal trend line.
This upwards movement looks like a five wave structure and it’s almost complete.
The next move for the S&P beginning next week should be downwards and hard.
Lara,
Thank you greatly for your intraday comments. It is helpful. Have a great weekend.
Rodney
You’re welcome 🙂
I can do this sometimes if I am able to spend enough time on the S&P charts before the market closes. It’s not always possible, but when it is I’ll make a comment on what I expect to happen prior to market close.
I know members like to have some analysis to assist in adjusting positions prior to the close.
Oversold condition in market now at an extreme according to McClelland Oscillator. Added speculative UVXY Oct 23 35 calls @ 1.90 There is nothing more counter-intuitive for traders to do than selling bear market rallies. Another interesting lesson in taking profits quickly this morning on WYNN 69 puts expiring today that traded higher than two bucks (filled@2.10) now back down to pennies after stock dipped to 66 in early trading. Keeping open sell orders at profit targets critical to surviving this crazy market. Have a great weekend everybody!
vernecarty,
I am not sure how you are getting an oversold reading. The daily MACD is as high as it has been since March. In the last 14 trading days, the S&P has risen roughly 140 points. I can’t see how this is oversold. Please elaborate.
I am looking at the NYSE McClelland Oscillator and I meant to say OVERBOUGHT… sorry about that. RSI is still only around 60 for S&P 500 but breadth is also weak. A bit more upside likely but short squeeze probably over or nearly so.
Thanks. I was suspecting something like that. By the way, I appreciate your comments and thoughts. I hope you keep posting them.