
Downwards / sideways movement was expected for Tuesday’s session to complete a red candlestick or doji.
A red candlestick for Tuesday completed which fits the Elliott wave counts perfectly.
Summary: The correction is incomplete. Downwards / sideways movement should continue for at least one more day and most likely a few more. Regular technical analysis supports this outlook; downwards movement is expected to continue and it may be choppy and overlapping.
To see how each of the bull and bear wave counts fit within a larger time frame see the Grand Supercycle Analysis.
To see last analysis of weekly and monthly charts go here.
If I was asked to pick a winner (which I am reluctant to do) I would say the bear wave count has a higher probability. It is better supported by regular technical analysis at the monthly chart level, it fits the Grand Supercycle analysis better, and it has overall the “right look”.
New updates to this analysis are in bold.
BULL ELLIOTT WAVE COUNT
DAILY CHART
Click chart to enlarge.
Cycle wave IV should exhibit alternation to cycle wave II. Cycle wave IV may find support at the teal channel on the weekly and monthly charts.
Cycle wave II was a shallow 0.41 zigzag lasting three months. Cycle wave IV should exhibit alternation in structure and maybe also alternation in depth. Cycle wave IV may end when price comes to touch the lower edge of the teal channel which is drawn about super cycle wave V using Elliott’s technique.
Cycle wave IV is likely to end within the price range of the fourth wave of one lesser degree. Because of the good Fibonacci ratio for primary wave 3 and the perfect subdivisions within it, I am confident that primary wave 4 has its range from 1,730 to 1,647.
If a zigzag is complete at the last major low as labelled, then cycle wave IV may be unfolding as a flat, combination or triangle.
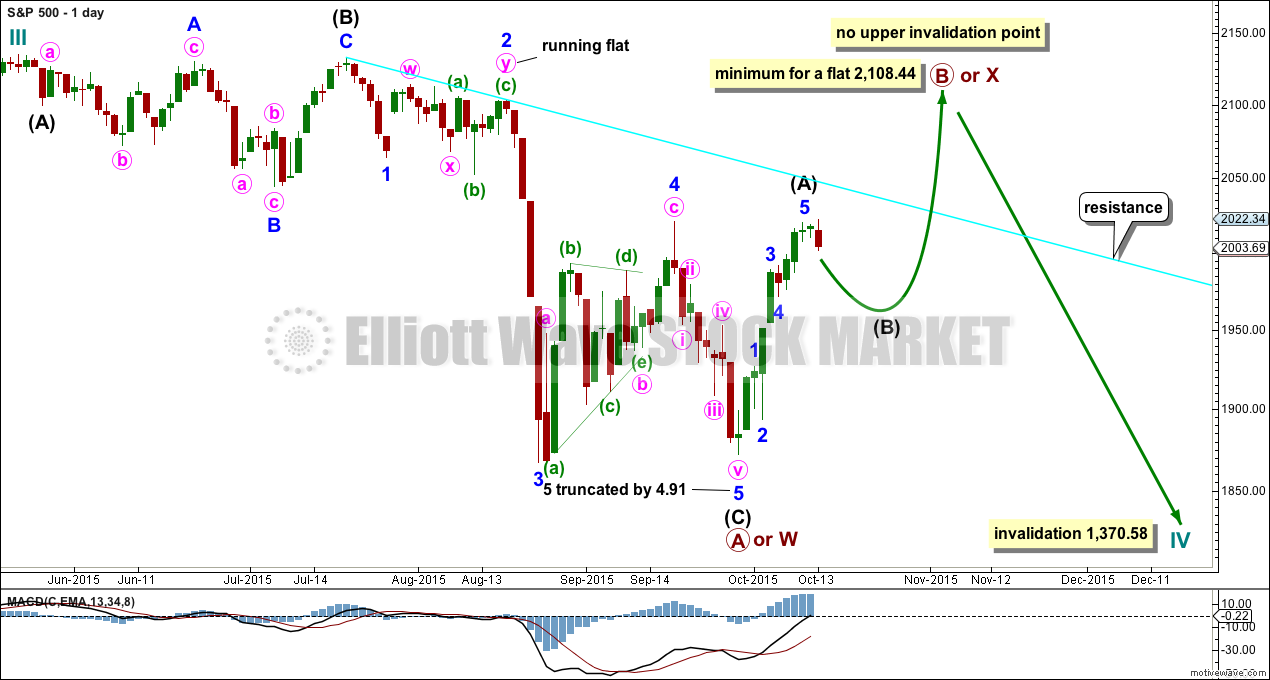
If cycle wave IV is a flat correction, then within it primary wave B must subdivide as a corrective structure (a three or a triangle) and must end at least 90% the length of primary wave A at 2,108.44. Primary wave B of an expanded flat may make a new all time high above 2,134.72. There is no upper invalidation point for this idea.
If cycle wave IV is a combination, then it would be labelled primary waves W-X-Y. Primary wave X may be any corrective structure and it has no minimum requirement, unlike the B wave within a flat. X waves within combinations are most often deep corrections to achieve the purpose of a sideways movement. X waves may move beyond the start of W waves. There is no upper invalidation point for this idea either.
If cycle wave IV is a triangle, then primary wave B upwards has no minimum requirement, must subdivide as a three wave structure (most likely a zigzag), and may also make a new all time high as in a running triangle. There is no upper invalidation point for this idea either.
Of all Elliott waves it is B waves which exhibit the greatest variety in structure and form. They are extremely difficult to analyse. Often, it is only when they are complete that their structure can be determined.
At this stage, primary wave B looks like it may be unfolding as a zigzag. This may change though.
HOURLY CHART
Click chart to enlarge.
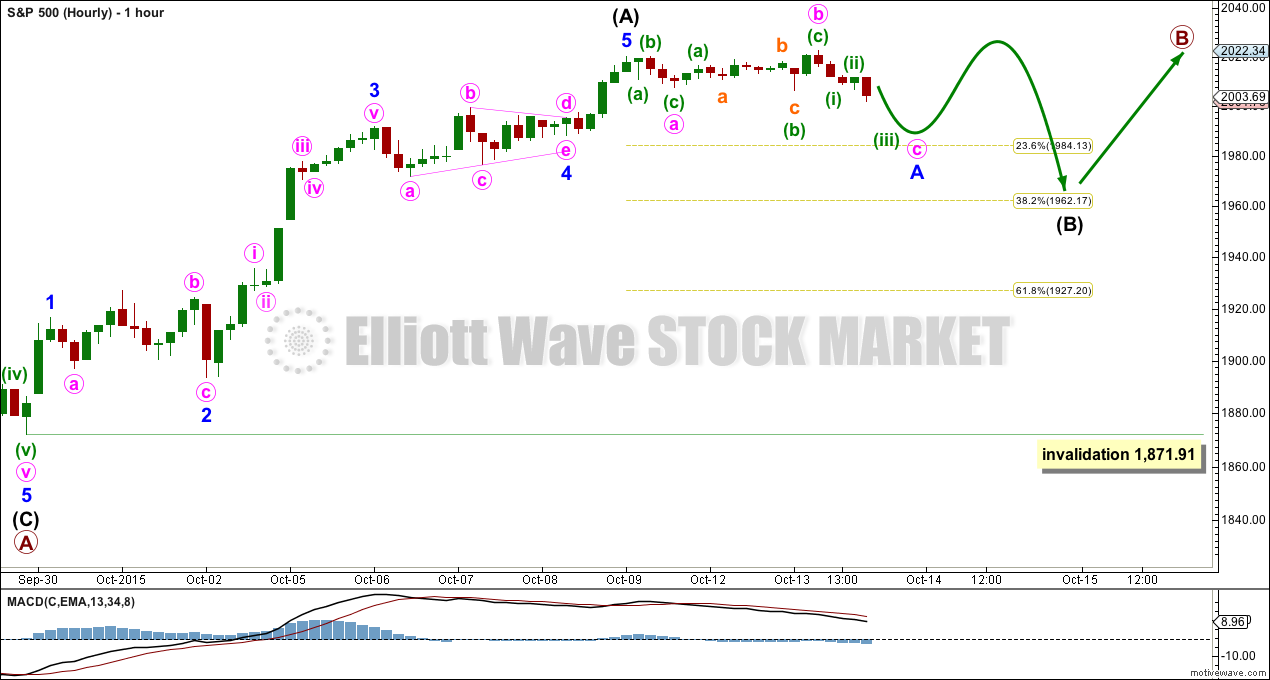
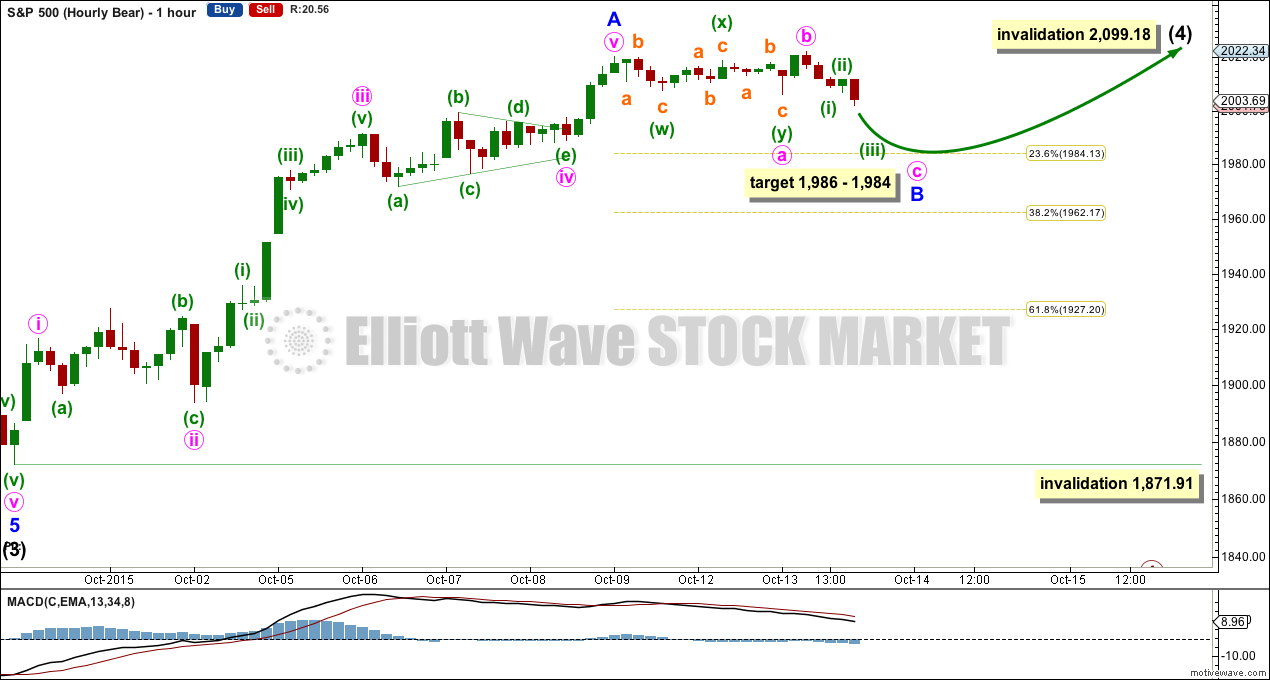
Intermediate wave (B) may be completing a three wave structure for minor wave A within it. This looks so far like it is unfolding as an expanded flat. Within minor wave A, minute wave b is a 1.18 length of minute wave a. Minute wave c looks like it may be incomplete, so I would expect downwards movement tomorrow to complete five wave structure for minute wave c.
The degree of labelling within intermediate wave (B) may also be moved up one degree; this may be an almost complete expanded flat.
If minor wave A subdivides as a three wave structure, then intermediate wave (B) may be unfolding as a single flat, triangle, double flat or double combination. All of these are mostly sideways movements. Overall, at this stage, several structural possibilities remain for intermediate wave (B) and it is still impossible to tell which one it will be. As more structure unfolds the labelling within it will most likely change.
My focus this week will be identifying when intermediate wave (B) may be complete. It is not possible to identify the pathway price may take while it unfolds with any accuracy whatsoever because of the variety in structures possible.
Intermediate wave (B) may not move beyond its start below 1,871.91, because intermediate wave (A) is a five.
ALTERNATE BULL ELLIOTT WAVE COUNT
DAILY CHART
Click chart to enlarge.
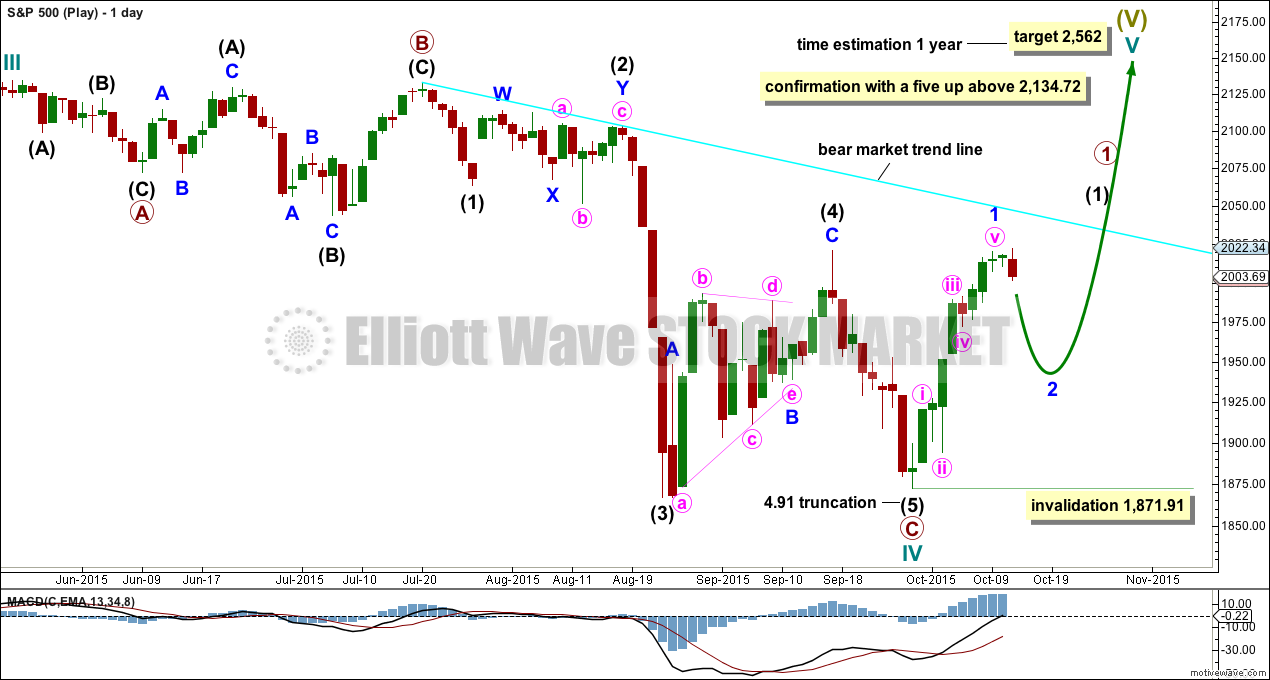
It is possible to see cycle wave IV a completed flat correction. This would provide some structural alternation with the zigzag of cycle wave II.
This is a regular flat but does not have a normal regular flat look. Primary wave C is too long in relation to primary wave A. Primary wave C would be 3.84 short of 4.236 the length of primary wave A. While it is possible to also see cycle wave IV as a complete zigzag (the subdivisions for that idea would be labelled the same as the bear wave count below, daily chart) that would not provide structural alternation with the zigzag of cycle wave II, and so I am not considering it.
This idea requires not only a new high but that the new high must come with a clear five upwards, not a three.
At 2,562 cycle wave V would reach equality in length with cycle wave I. Cycle wave I was just over one year in duration so cycle wave V should be expected to also reach equality in duration.
I am adding a bright aqua blue trend line to daily charts. Any bullish wave count such as this one must have three things for confirmation:
1. A clear breach of the bear market trend line (this line is less conservative than a bear market line drawn using Magee’s approach. That line would be almost horizontal. Hence two other conditions are required).
2. Price break above the 200 day Simple Moving Average.
3. A clear five up on the daily chart.
While none of these conditions are met, we should assume the trend remains the same: downwards.
BEAR ELLIOTT WAVE COUNT
DAILY CHART
Click chart to enlarge.
This bear wave count has a better fit at Grand Super Cycle degree and is better supported by regular technical analysis at the monthly chart level. But it is a huge call to make, so I present it second, after a more bullish wave count, and until all other options have been eliminated.
There are two ideas presented in this chart: a huge flat correction or a double flat / double combination. The huge flat is more likely. They more commonly have deep B waves than combinations have deep X waves (in my experience).
A huge flat correction would be labelled super cycle (a)-(b)-(c). It now expects a huge super cycle wave (c) to move substantially below the end of (a) at 666.79. C waves can behave like third waves. This idea expects a devastating bear market, and a huge crash to be much bigger than the last two bear markets on the monthly bear chart.
The second idea is a combination which would be labelled super cycle (w)-(x)-(y). The second structure for super cycle wave (y) would be a huge sideways repeat of super cycle wave (a) for a double flat, or a quicker zigzag for a double combination. It is also possible (least likely) that price could drift sideways in big movements for over 10 years for a huge triangle for super cycle wave (y).
I am now seeing a third wave complete at the last major low for intermediate wave (3). Intermediate wave (3) is 17.31 longer than 6.854 the length of intermediate wave (1).
Minor wave 5 is seen as complete and slightly truncated.
A channel drawn using Elliott’s technique no longer works. Sometimes fourth waves aren’t contained within such a channel, which is why Elliott developed a second technique to use when they breach the channel.
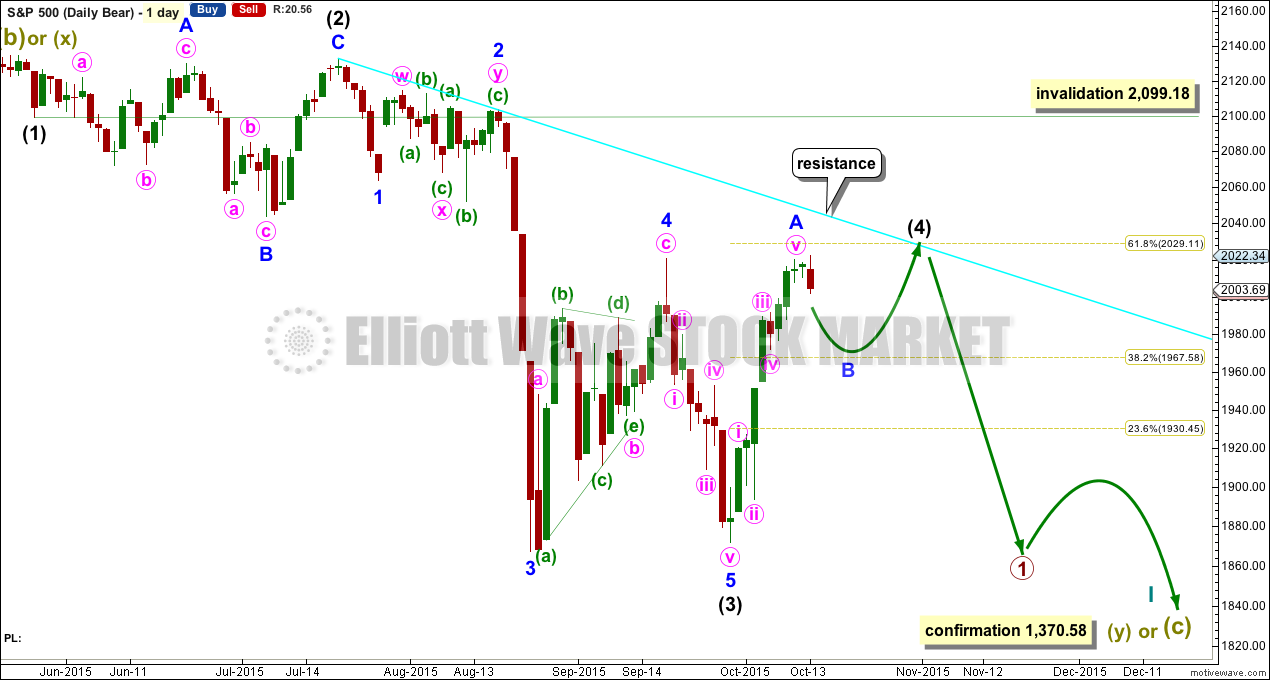
Intermediate wave (2) was a very deep 0.95 expanded flat lasting 38 sessions. Intermediate wave (4) should exhibit alternation, is most likely to be more shallow, and be a quicker zigzag or zigzag multiple. It may not move into intermediate wave (1) price territory above 2,099.18.
At this stage, now there looks like a five up on the daily chart. For this bear wave count, this would be minor wave A either complete.
Intermediate wave (4) is not over. It may end in a total Fibonacci 21 sessions which would see it continue now for a further 11 sessions. Alternatively, at this stage, it is also possible it may come to a quicker end: a further three sessions would see it complete in a total Fibonacci 13 sessions.
HOURLY CHART
Click chart to enlarge.
Intermediate wave (4) for this bear wave count is seen as unfolding as a zigzag in exactly the same way as primary wave B for the first wave count.
Here I am considering an almost complete expanded flat correction for minor wave B. Minute wave b is seen differently, which illustrates the difficulty with B waves as they are the most complicated and difficult of all Elliott waves to analyse.
Here minute wave a is seen as a double zigzag which is termed a “three”. Minute wave b is a quick zigzag and a 1.16 length of minute wave a indicating an expanded flat. At 1,986 minute wave c would reach 1.618 the length of minute wave a, and at 1,984 minor wave B would end at the 0.236 Fibonacci ratio of minor wave A. This gives a 2 point target zone for a potential end to this correction.
If minor wave B ends tomorrow in one more session and minor wave C upwards lasts only two sessions, then intermediate wave (4) may end in a total Fibonacci 13 sessions, with a long A wave and a short C wave.
Alternatively, minor wave B may morph into a double flat, triangle or combination. That is not the only possibility although I am labelling it here as an almost complete expanded flat.
Minor wave B may not move beyond the start of minor wave A below 1,871.91.
TECHNICAL ANALYSIS
DAILY CHART
Click chart to enlarge. Chart courtesy of StockCharts.com.
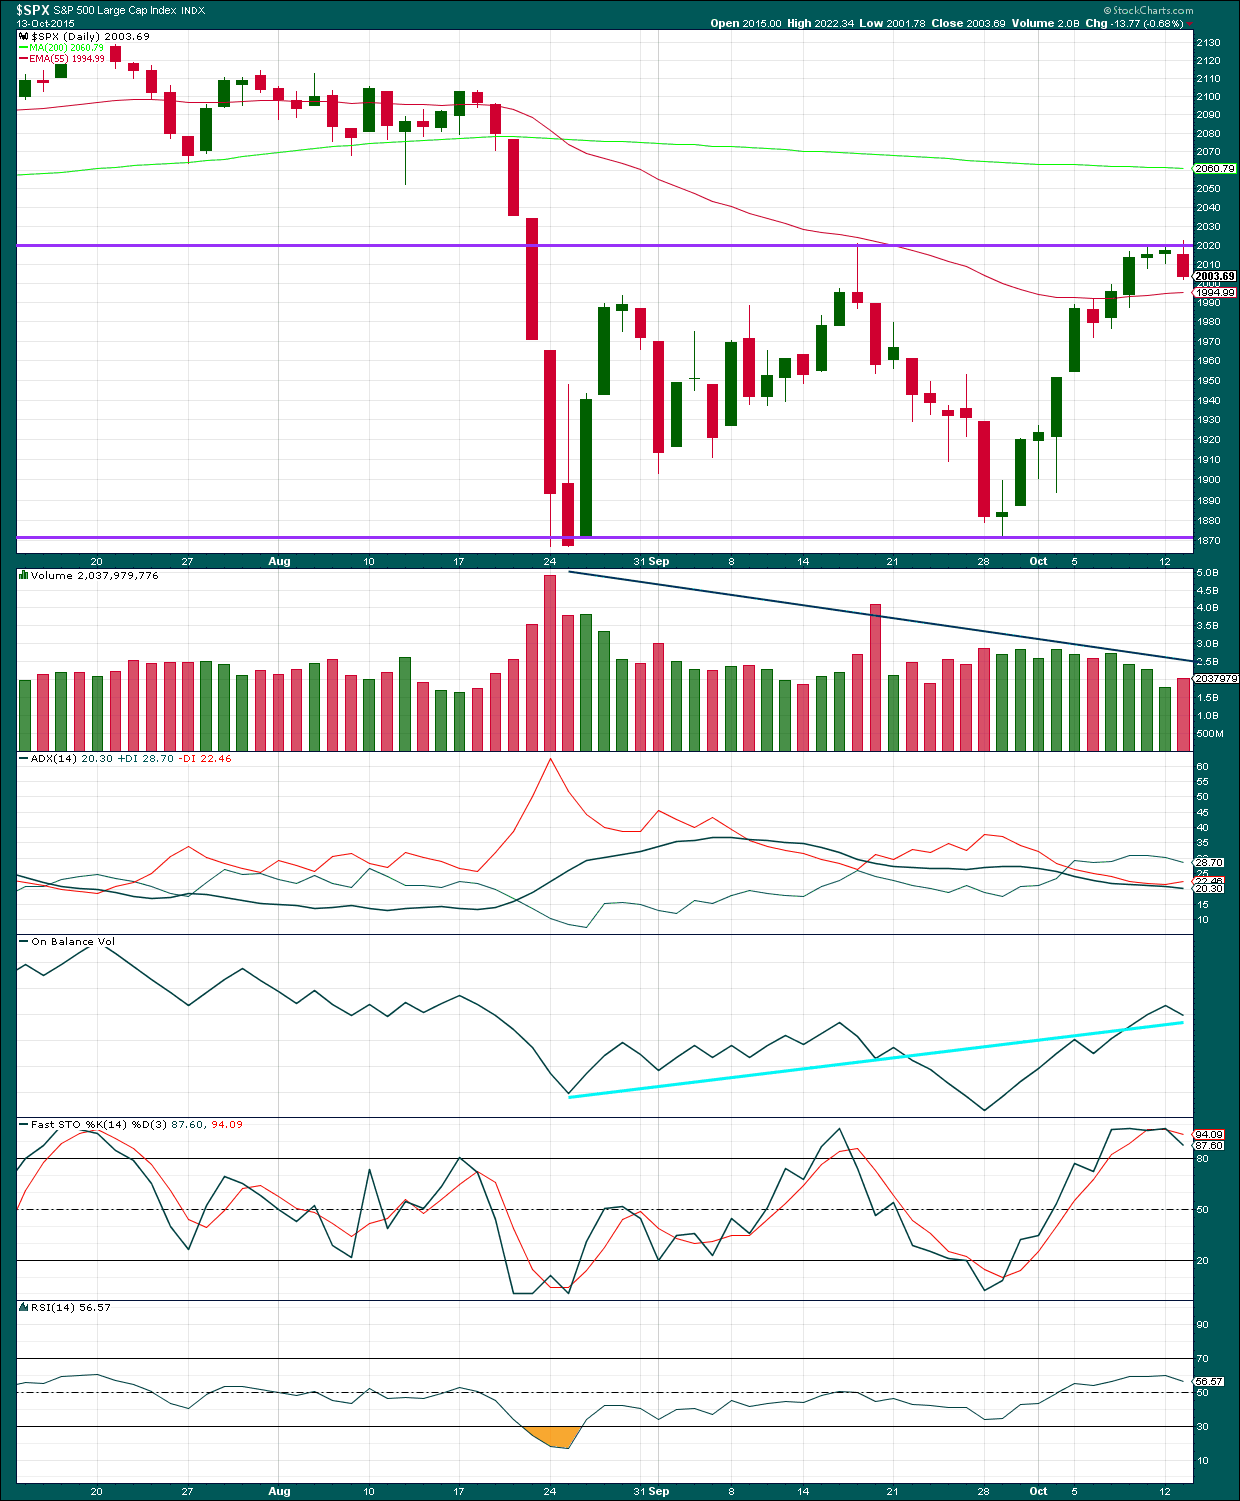
I am pushing the horizontal lines of resistance and support outwards to contain all recent sideways movement. To reliably indicate a breakout one of these lines needs to be breached. If a breach comes on increased volume, then a breakout would be indicated.
Price has bounced down from the upper line of resistance. ADX continues to indicate the market is range bound. With Stochastics now starting to turn downwards, more downwards movement from price overall should be expected to continue until price finds support and Stochastics reaches oversold.
The black ADX line remains essentially flat indicating the market is not trending. Overall volume is declining while price moves sideways. During this sideways consolidation contained within support and resistance lines it is a downwards day which shows clearly strongest volume. This indicates the breakout is most likely to be down. This trick does not always work, but it works often enough to be a good indicator of the breakout direction.
Each time price falls volume rises, and each time price rises or drifts sideways volume has been declining. The volume profile is bearish. There is little ambiguity.
On Balance Volume has broken a short term trend line. The next trend line for resistance needs to be looked at on a longer time frame, because it is still some distance away for any resistance to be provided at this time. OBV may find support at the bright aqua blue trend line in the short term.
A note on Dow Theory: for the bear wave count I would wait for Dow Theory to confirm a huge market crash. So far the industrials and the transportation indices have made new major swing lows, but the S&P500 and Nasdaq have not.
S&P500: 1,820.66
Nasdaq: 4,116.60
DJT: 7,700.49 – this price point was breached.
DJIA: 15,855.12 – this price point was breached.
This analysis is published about 08:18 p.m. EST.
Watching DJI 17000 and then 50 day SMA just beneath for clues to short term direction. Bears’ unwillingness to sell it hard and upside resistance means more meandering indecision. If Transports break 50 day SMA that my give some indication of where things are headed. VIX creeping steadily higher so nibbling on November calls.
We need a solid close (at least 200 points) below DJI 17000 pivot before I am confident of retest of August lows.
Difficult indeed : Have been expecting the daily MACD to top out and join the weekly & monthly in a downward move BUT in the mean time the weekly MACD is turning up.