
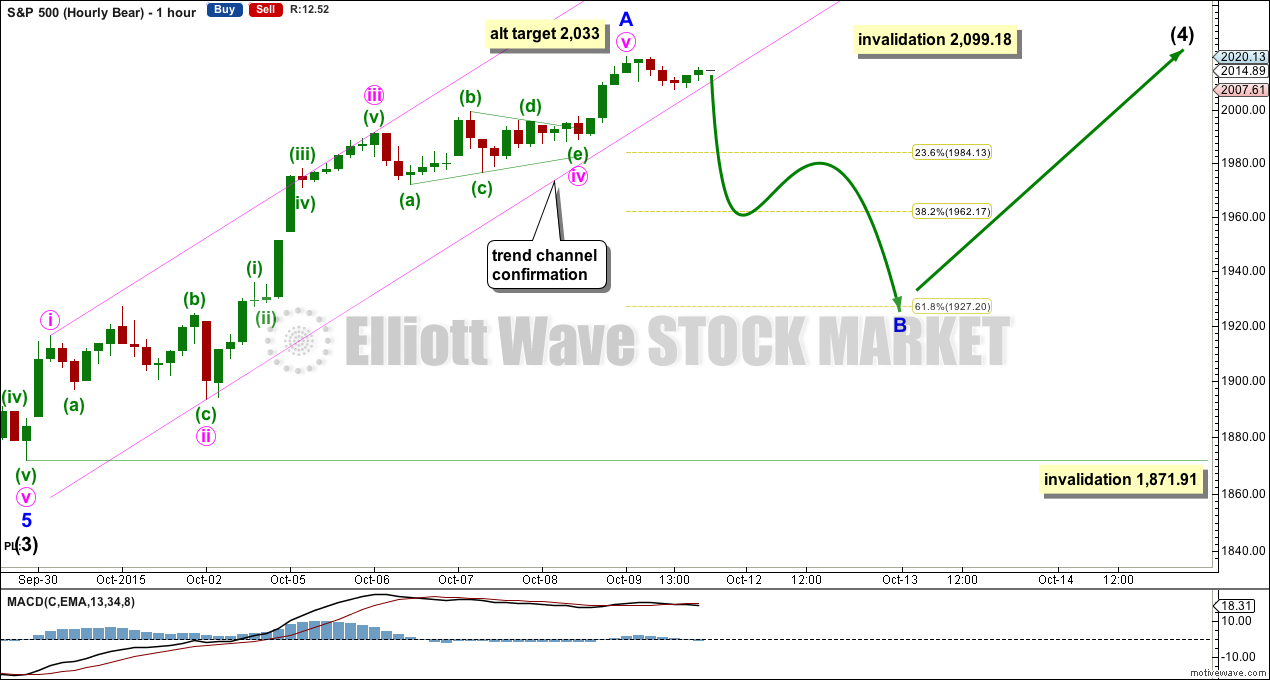
Price moved a little higher and did not breach the channel on the hourly chart. The channel must be breached before this upwards wave is confirmed as complete. An alternate target is added for the possibility that it may continue further.
Summary: The channel on the hourly chart is providing support. Short term a new high above Friday’s high at 2,020 would indicate this wave up is incomplete, a target is at 2,033. If the channel is breached, then expect a downwards / sideways correction to develop over several days.
To see how each of the bull and bear wave counts fit within a larger time frame see the Grand Supercycle Analysis.
To see last analysis of weekly and monthly charts go here.
If I was asked to pick a winner (which I am reluctant to do) I would say the bear wave count has a higher probability. It is better supported by regular technical analysis at the monthly chart level, it fits the Grand Supercycle analysis better, and it has overall the “right look”.
New updates to this analysis are in bold.
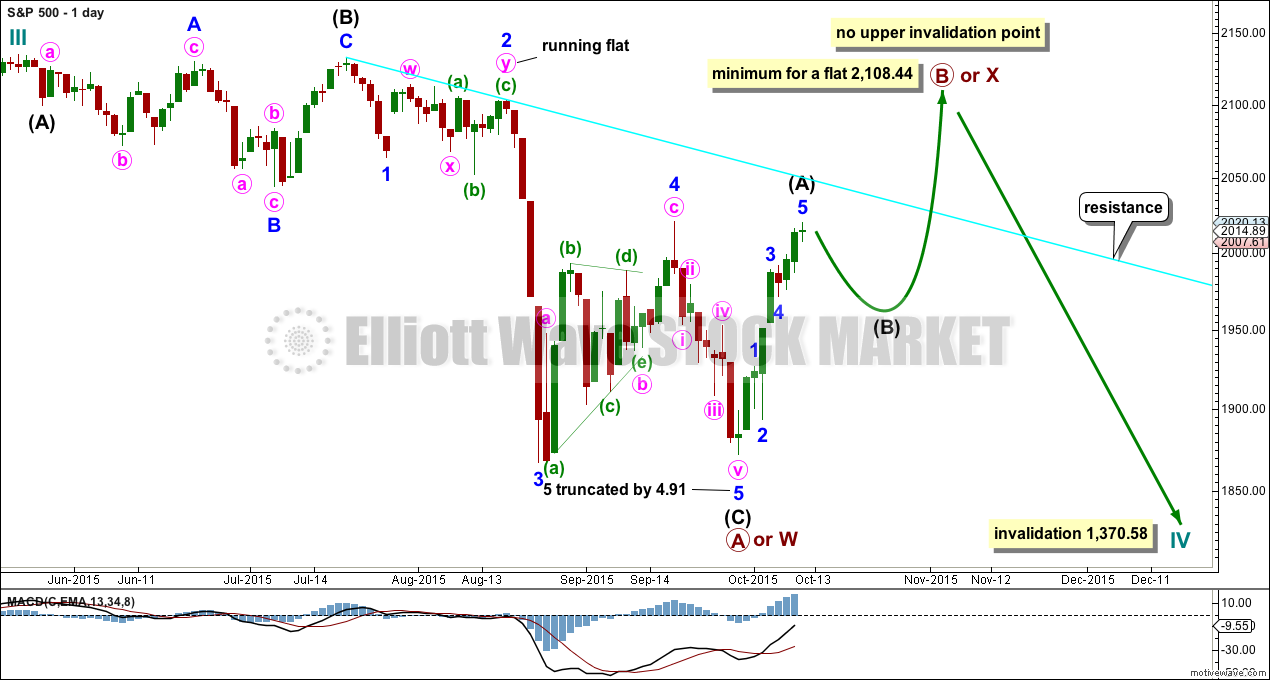
BULL ELLIOTT WAVE COUNT
DAILY CHART
Click chart to enlarge.
Cycle wave IV should exhibit alternation to cycle wave II. Cycle wave IV may find support at the teal channel on the weekly and monthly charts.
Cycle wave II was a shallow 0.41 zigzag lasting three months. Cycle wave IV should exhibit alternation in structure and maybe also alternation in depth. Cycle wave IV may end when price comes to touch the lower edge of the teal channel which is drawn about super cycle wave V using Elliott’s technique.
Cycle wave IV is likely to end within the price range of the fourth wave of one lesser degree. Because of the good Fibonacci ratio for primary wave 3 and the perfect subdivisions within it, I am confident that primary wave 4 has its range from 1,730 to 1,647.
If a zigzag is complete at the last major low as labelled, then cycle wave IV may be unfolding as a flat, combination or triangle.
If cycle wave IV is a flat correction, then within it primary wave B must subdivide as a corrective structure (a three or a triangle) and must end at least 90% the length of primary wave A at 2,108.44. Primary wave B of an expanded flat may make a new all time high above 2,134.72. There is no upper invalidation point for this idea.
If cycle wave IV is a combination, then it would be labelled primary waves W-X-Y. Primary wave X may be any corrective structure and it has no minimum requirement, unlike the B wave within a flat. X waves within combinations are most often deep corrections to achieve the purpose of a sideways movement. X waves may move beyond the start of W waves. There is no upper invalidation point for this idea either.
If cycle wave IV is a triangle, then primary wave B upwards has no minimum requirement, must subdivide as a three wave structure (most likely a zigzag), and may also make a new all time high as in a running triangle. There is no upper invalidation point for this idea either.
Of all Elliott waves it is B waves which exhibit the greatest variety in structure and form. They are extremely difficult to analyse. Often, it is only when they are complete that their structure can be determined.
At this stage, primary wave B looks like it may be unfolding as a zigzag. This may change though.
HOURLY CHART
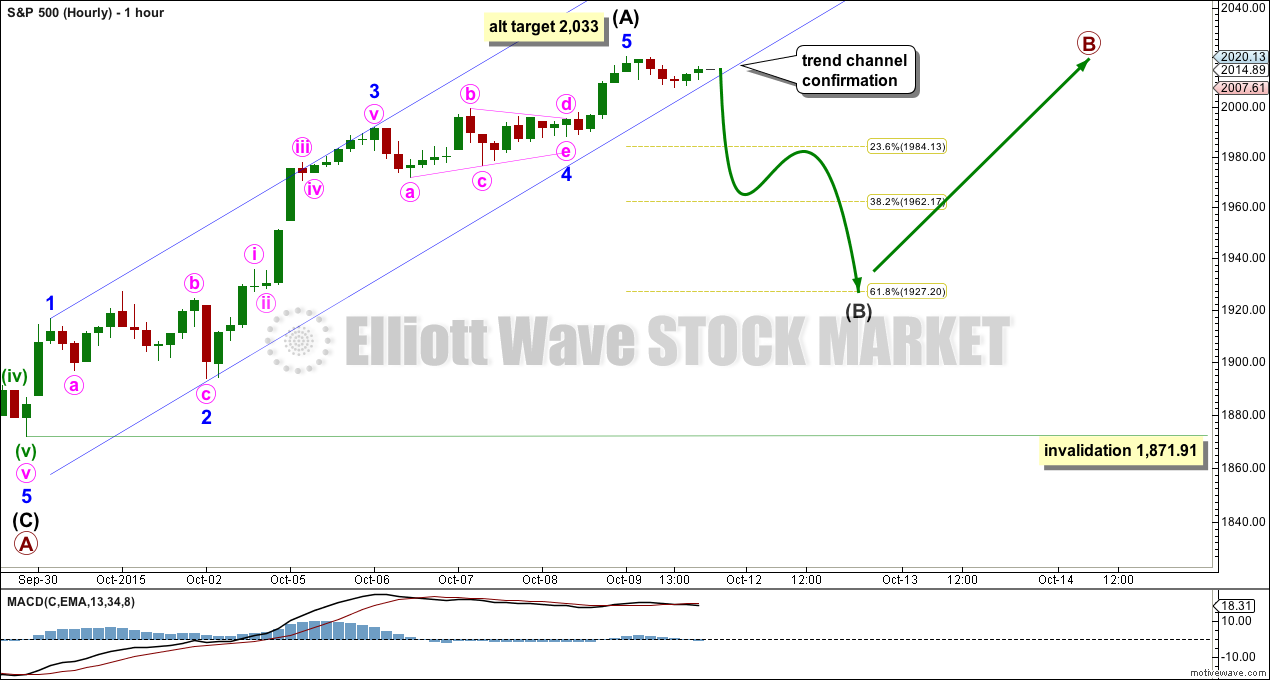
Click chart to enlarge.
Minor wave 5 continued higher. There is no no Fibonacci ratios between minor waves 1, 3 and 5. If minor wave 5 continues higher on Monday, then at 2,033 it would reach equality in length with minor wave 1.
The channel about intermediate wave (A) still needs to be breached by downwards movement before any confidence may be had that it is over and intermediate wave (B) has begun. At the end of Friday’s session price is finding support at the lower edge of that channel. Any new high above the high for Friday at 2,020.13 would indicate that minor wave 5 is not over and then the alt target at 2,033 should be used. Prior to a new high, if the channel is breached, then it would indicate an end to this wave up.
Intermediate wave (B) may unfold as one of 23 possible structures (if all the different types of triangles and combinations are counted). It is impossible to say which one will unfold or even which type will unfold at the start, and it may not be clear until the end. It may be a swift sharp zigzag reaching down to the 0.618 Fibonacci ratio of intermediate wave (A) at 1,926. It may be a sideways triangle, flat or combination with deep swings taking up time and ending about the 0.382 Fibonacci ratio at 1,960.
Of all Elliott waves, it is B waves which exhibit the greatest variety in form and structure. B waves within B waves are often very complicated and difficult. This one to come for this wave count is expected to be a B wave within a B wave.
While intermediate wave (B) unfolds the analysis within it will change. The focus will be on identifying when it is over.
Intermediate wave (B) may not move beyond its start below 1,871.91, because intermediate wave (A) is a five.
ALTERNATE BULL ELLIOTT WAVE COUNT
DAILY CHART
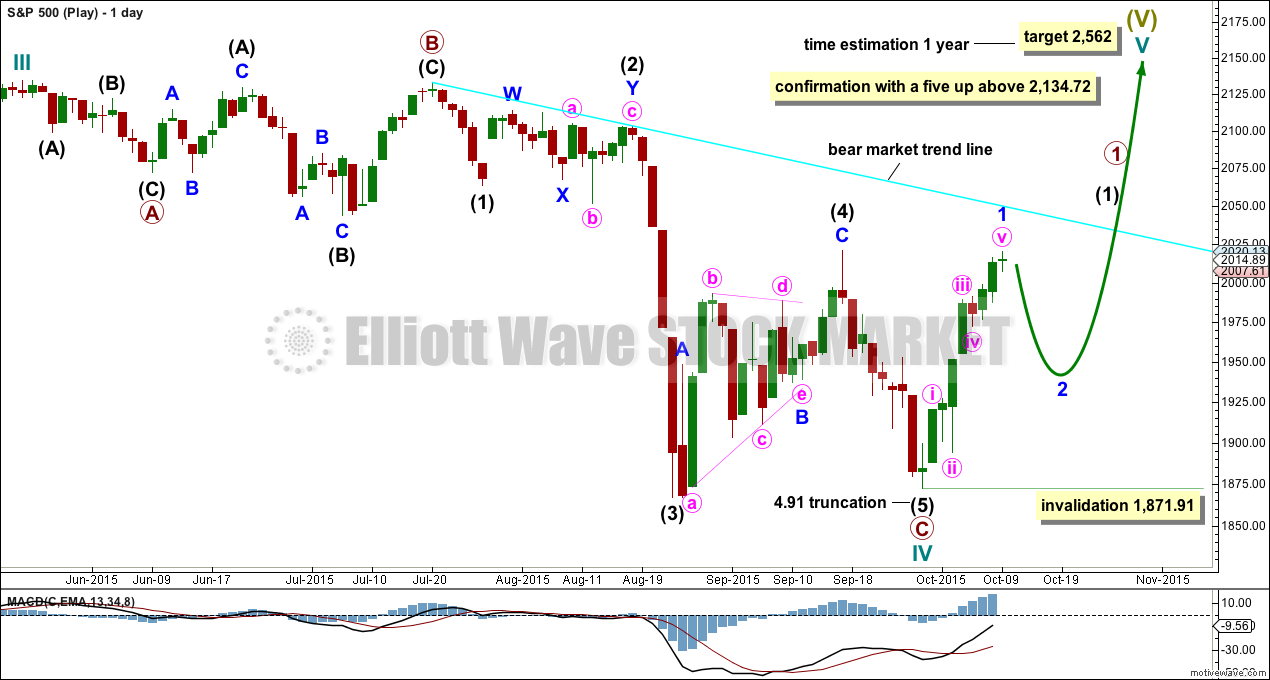
Click chart to enlarge.
It is possible to see cycle wave IV a completed flat correction. This would provide some structural alternation with the zigzag of cycle wave II.
This is a regular flat but does not have a normal regular flat look. Primary wave C is too long in relation to primary wave A. Primary wave C would be 3.84 short of 4.236 the length of primary wave A.
This idea requires not only a new high but that the new high must come with a clear five upwards, not a three.
At 2,562 cycle wave V would reach equality in length with cycle wave I. Cycle wave I was just over one year in duration so cycle wave V should be expected to also reach equality in duration.
I am adding a bright aqua blue trend line to daily charts. Any bullish wave count such as this one must have three things for confirmation:
1. A clear breach of the bear market trend line (this line is less conservative than a bear market line drawn using Magee’s approach. That line would be almost flat. Hence two other conditions are required).
2. Price break above the 200 day Simple Moving Average.
3. A clear five up on the daily chart.
While none of these conditions are met, we should assume the trend remains the same: downwards.
BEAR ELLIOTT WAVE COUNT
DAILY CHART
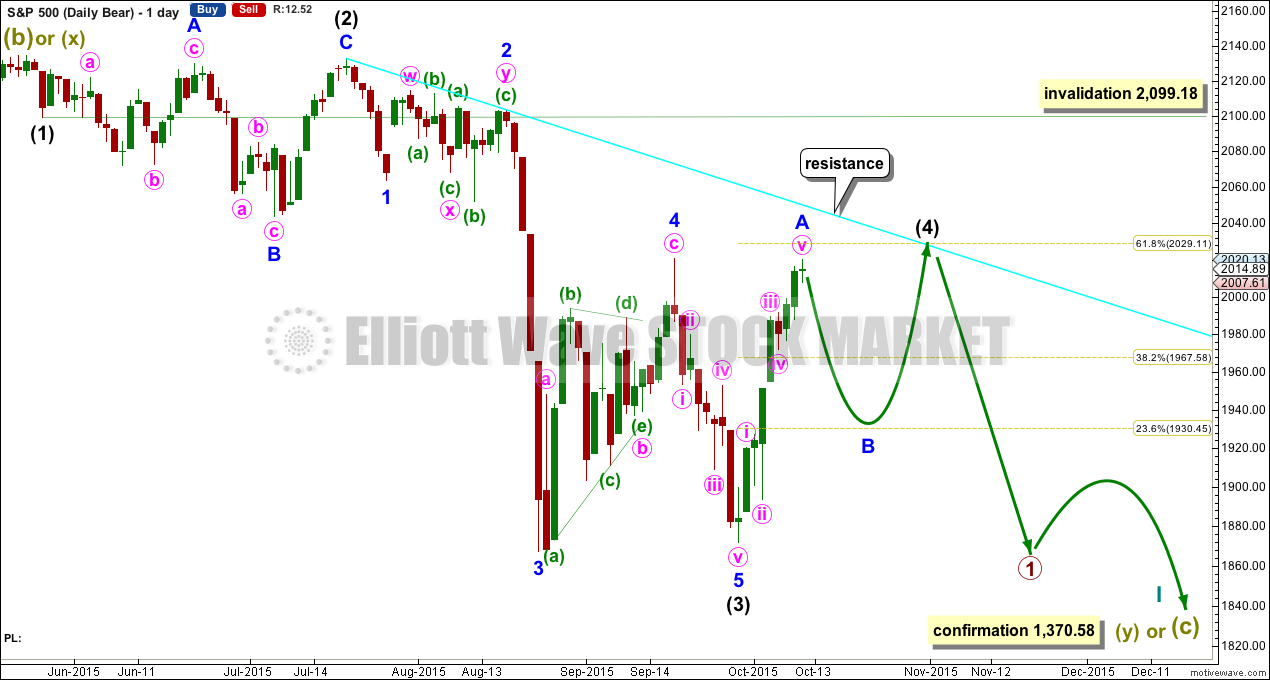
Click chart to enlarge.
This bear wave count has a better fit at Grand Super Cycle degree and is better supported by regular technical analysis at the monthly chart level. But it is a huge call to make, so I present it second, after a more bullish wave count, and until all other options have been eliminated.
There are two ideas presented in this chart: a huge flat correction or a double flat / double combination. The huge flat is more likely. They more commonly have deep B waves than combinations have deep X waves (in my experience).
A huge flat correction would be labelled super cycle (a)-(b)-(c). It now expects a huge super cycle wave (c) to move substantially below the end of (a) at 666.79. C waves can behave like third waves. This idea expects a devastating bear market, and a huge crash to be much bigger than the last two bear markets on the monthly bear chart.
The second idea is a combination which would be labelled super cycle (w)-(x)-(y). The second structure for super cycle wave (y) would be a huge sideways repeat of super cycle wave (a) for a double flat, or a quicker zigzag for a double combination. It is also possible (least likely) that price could drift sideways in big movements for over 10 years for a huge triangle for super cycle wave (y).
I am now seeing a third wave complete at the last major low for intermediate wave (3). Intermediate wave (3) is 17.31 longer than 6.854 the length of intermediate wave (1).
Minor wave 5 is seen as complete and slightly truncated.
A channel drawn using Elliott’s technique no longer works. Sometimes fourth waves aren’t contained within such a channel, which is why Elliott developed a second technique to use when they breach the channel.
Intermediate wave (2) was a very deep 0.95 expanded flat lasting 38 sessions. Intermediate wave (4) should exhibit alternation, is most likely to be more shallow, and be a quicker zigzag or zigzag multiple. It may not move into intermediate wave (1) price territory above 2,099.18.
At this stage, now there looks like a five up on the daily chart. For this bear wave count, this would be minor wave A either complete or close to complete. Subdivisions on the hourly chart level are the same today for all three wave counts. There is no divergence short term.
Intermediate wave (4) is not over. It may end in a total Fibonacci 21 sessions which would see it continue now for a further 13 sessions.
HOURLY CHART
Click chart to enlarge.
Intermediate wave (4) for this bear wave count is seen as unfolding as a zigzag in exactly the same way as primary wave B for the first wave count.
There is no divergence short or mid term except for the invalidation point.
The trend channel about minor wave A must be breached before any confidence may be had in this labelling of minor wave A as complete. The risk that price can continue higher must be accepted while price remains within that channel.
Minor wave B may be any one of 23 possible Elliott wave structures. It may not move beyond the start of minor wave A below 1,871.91. It may end about either the 0.382 or 0.618 Fibonacci ratios of minor wave A at 1,960 or 1,926. Neither ratio can be favoured; they are equally likely.
Minor wave B should show up on the daily chart as a corrective structure. It may take about two to even thirteen days.
TECHNICAL ANALYSIS
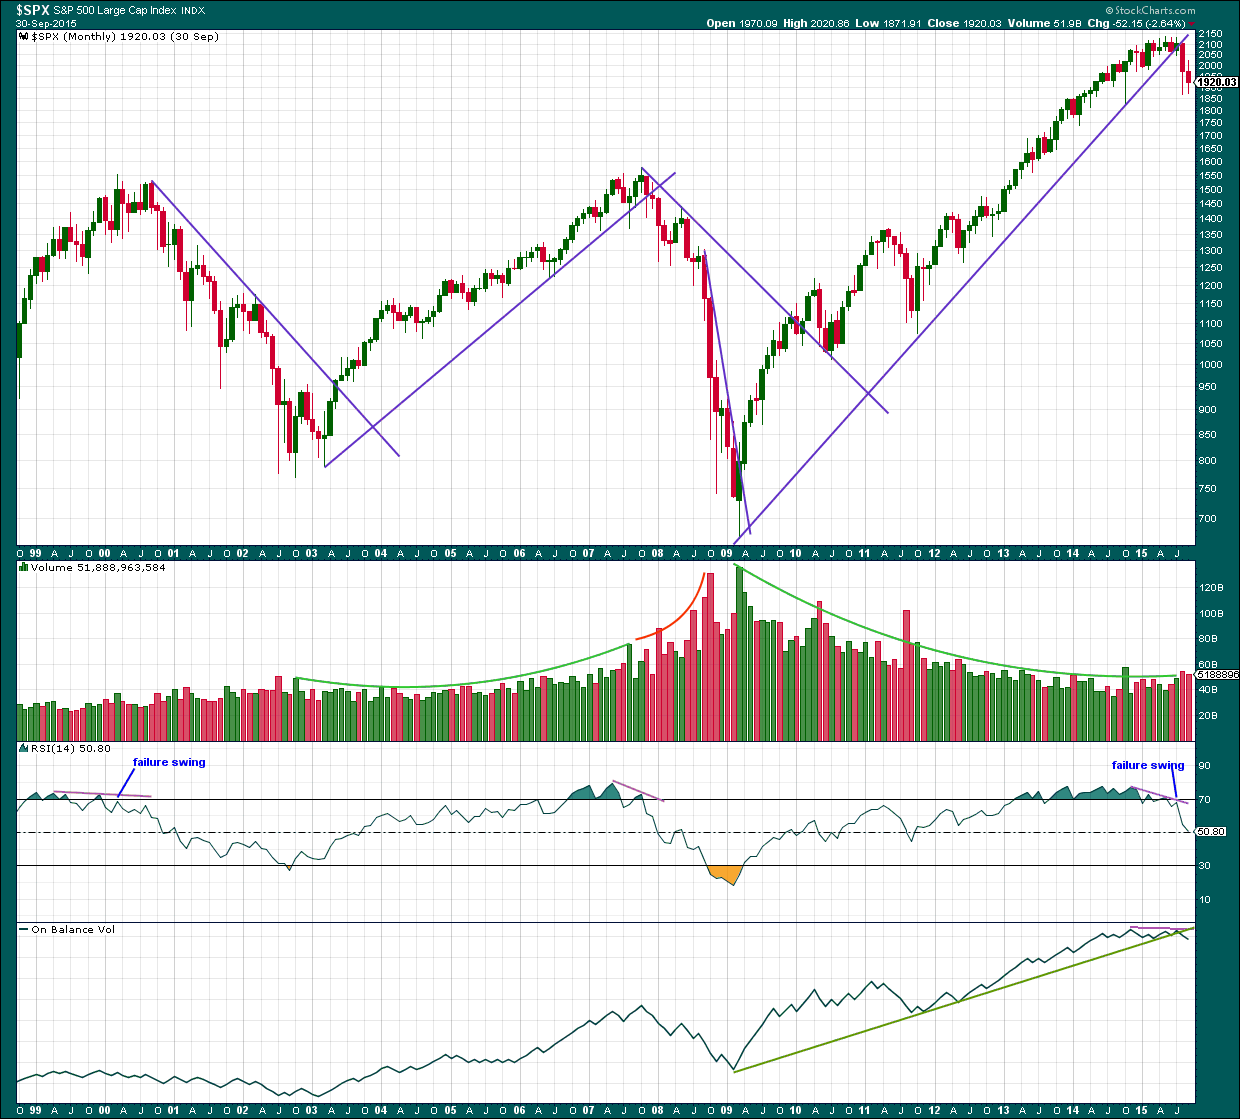
MONTHLY CHART
Click chart to enlarge. Chart courtesy of StockCharts.com.
I have stepped back to show the last two bear markets and the last two bull markets (and the end of the long bull market up to 2000) to illustrate again why I expect the bear wave count has a higher probability at this time.
Simple is best. The simplest technical analysis is trend lines.
The end of the bull market to March 2000 came with years of RSI fluctuating above overbought, and at quadruple negative divergence (not shown, to the left of the chart going back to 1996). The final high came with a failure swing from RSI.
I have drawn a trend line on the bear market of March 2000 to October 2002. A breach of that trend line in June 2003 was confirmation of a trend change from bear to bull.
A trend line of the bull market from October 2002 to October 2007 is drawn using Magee’s approach, which was breached in January 2008 providing confirmation of a trend change from bull to bear. That bull market also saw overall a rise in volume, so was not suspicious. That is a normal volume profile. It requires buying activity to push price up; higher volume indicates interest in the market. At the end of that bull market RSI reached overbought and then showed divergence.
I have drawn two trend lines on the bear market of October 2007 to March 2009. The steeper trend line is less technically significant, but it may be used first because it came at the same time that RSI was oversold and showed divergence. This trend line was breached in April 2009 indicating an end to the bear market. This bear market came on rising volume until the last four months when volume was lower than its peak. The more conservative trend line was finally breached in March 2010 and then provided support.
Now to the last bull market. What is startling and obvious is the decline in volume. From Martin Pring, “Technical Analysis Explained” (fourth edition): “Rising prices and falling volume are abnormal and indicate a weak and suspect rally. A market that rallies on a trend of lower volume indicates that prices are rising because of a lack of sellers rather than the enthusiasm of buyers. Sooner or later the market will reach a point where sellers become more motivated. After that, prices will start to pick up on the downside. One tip-off is to watch for volume to increase noticeably as the price starts to decline” (pages 399-400). What Pring describes perfectly fits the abnormal volume profile of the last bull market. At the monthly chart level, volume for August is slightly picking up; this looks even clearer on the daily chart. A movement with declining volume normally indicates a correction against a prevailing trend and this makes absolute sense if this bull market is a B or X wave.
From Frost and Prechter “Elliott Wave Principle” (tenth edition) page 81: “B waves are phonies. They are sucker plays, bull traps, speculators’ paradise, orgies of odd-lotter mentality or expressions of dumb institutional complacency (or both). They often involve a focus on a narrow list of stocks, are often “unconfirmed” by other averages, are rarely technically strong, and are virtually always doomed to complete retracement by wave C. If the analyst can easily say to himself, “There is something wrong with this market”, chances are it’s a B wave”.
There is something wrong with that bull market. Volume strongly does not agree with the rise in price. The surprise is that it went on for so long. My conclusion is it was a B or X wave and given the information available I think that is a reasonable conclusion to make.
A trend line drawn about this last bull market here is not drawn using Magee’s approach and is more conservative (a shallower slope). Even that is well breached and provided some resistance after the breach. It is telling us that it is highly likely that the market has changed from bull to bear.
These simple trend lines do not always work. Many members may find more bullish indicators to see than I have to date and may disagree with my conclusions, that’s okay. But these trend lines do work very often. I will take this indication as a high probability trend change, but in the world of technical analysis nothing is ever definite.
The last all time high in May 2015 also saw RSI reach overbought, exhibit double divergence, and finally a failure swing. The last two times this happened a large bear market followed. I would expect the probability of it happening again at this point is very high.
The end of this bear market would be reliably indicated only when RSI reaches oversold AND exhibits divergence. If volume declines at new lows while RSI shows divergence, then the probability of the end to a bear market would be very high. RSI is not oversold; there is plenty of room for the market to fall.
On Balance Volume at the monthly chart level has broken below a long held trend line (green). This trend line goes back to March 2009 and was repeatedly tested. OBV works best with trend lines. The break below is a strong bearish indicator.
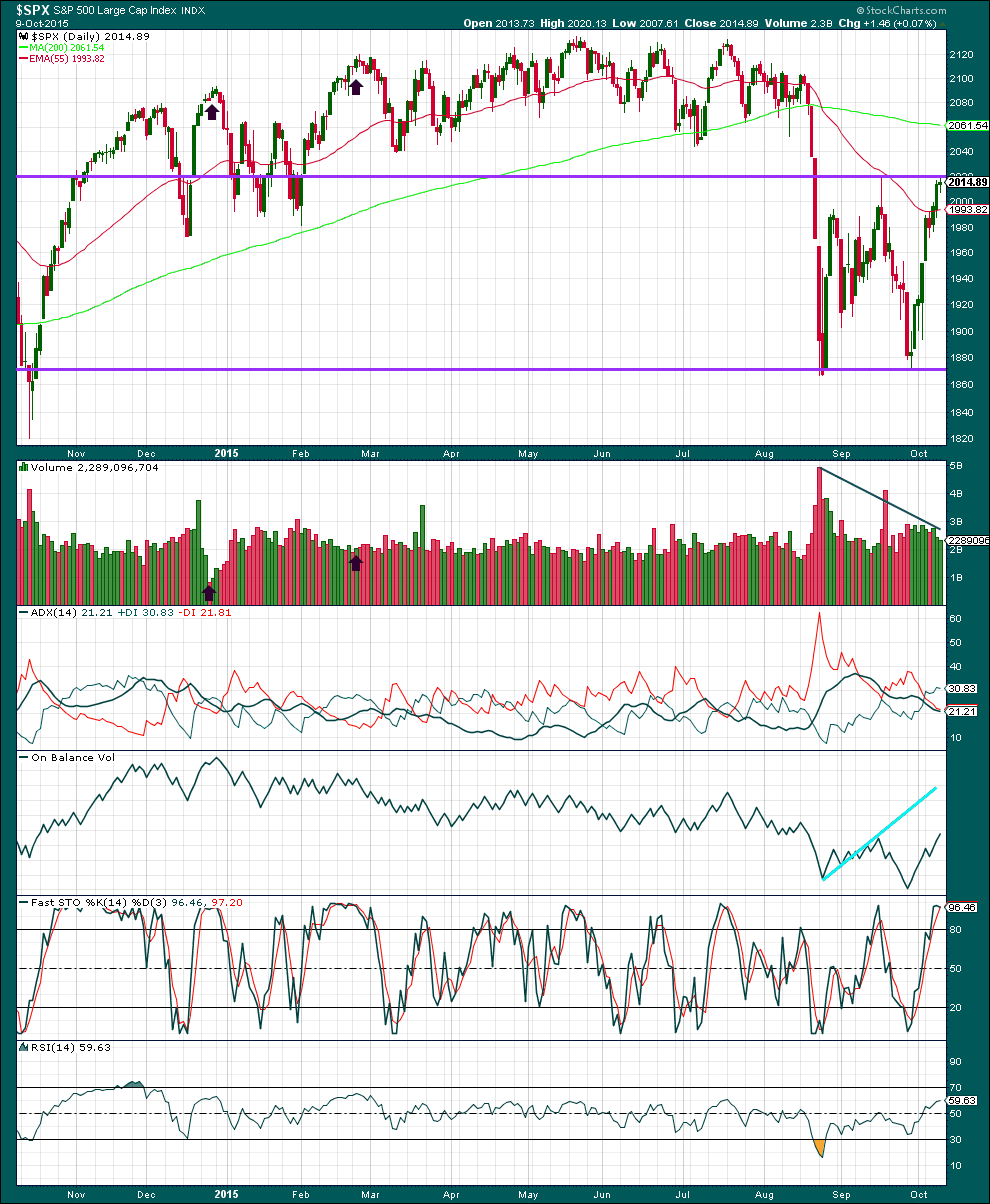
DAILY CHART
Click chart to enlarge. Chart courtesy of StockCharts.com.
I am pushing the horizontal lines of resistance and support outwards to contain all recent sideways movement. To reliably indicate a breakout one of these lines needs to be breached. If a breach comes on increased volume, then a breakout would be indicated.
The last three days’ rise in price comes on declining volume. The rise in price is not supported by active buyers but rather an absence of sellers.
The black ADX line remains essentially flat indicating the market is not trending. Overall volume is declining while price moves sideways. During this sideways consolidation contained within (new) support and resistance lines it is a downwards day which shows clearly strongest volume. This indicates the breakout is most likely to be down. This trick does not always work, but it works often enough to be a good indicator of the breakout direction.
Each time price falls volume rises, and each time price rises or drifts sideways volume has been declining. The volume profile is bearish. There is little ambiguity.
On Balance Volume has just broken a mid term trend line which previously provided resistance (orange). This is a short term bullish indicator. If it keeps moving up, then it may find resistance at the first bright blue trend line.
Stochastics is now more strongly overbought and showing slight divergence with price as it flattens off for Friday (but that is a weak signal). With ADX indicating a range bound market and price reaching resistance, some downwards movement would be expected from this approach. The problem though with range bound markets is price can overshoot support and resistance with Stochastics remaining oversold or overbought for a few sessions before one swing ends and the next begins. This is why trading range bound markets is so risky. Careful money management is essential when trading during a range bound market. Alternatively, step aside and wait until a clear trend is evident, then join it.
RSI is neither overbought or oversold. There is room for the market to fall or rise.
A member has quite rightly pointed out that previous highs were associated with declining volume, yet price kept rising. I have noted two instances on this chart (thick black arrows). The first up to the high on December 2014 came on strongly declining volume. The following fall in price over five days came on increasing volume. This is the opposite of a normal volume profile.
The second instance noted here was the high on February 2015. Again, price made an all time high on declining volume.
The conclusion is either that volume analysis is useless (which would be a remarkable conclusion to make and contrary to many more experienced analysts than I) or that there is something wrong in this market. The other conclusion which can certainly be drawn is we may yet see new all time highs and it may come on declining volume. The first wave count allows for this.
This abnormal volume profile seen repeatedly at the daily chart level and to a larger degree at the monthly chart level is highly likely to be resolved. Sellers will become more motivated and then price will fall.
A note on Dow Theory: for the bear wave count I would wait for Dow Theory to confirm a huge market crash. So far the industrials and the transportation indices have made new major swing lows, but the S&P500 and Nasdaq have not.
S&P500: 1,820.66
Nasdaq: 4,116.60
DJT: 7,700.49 – this price point was breached.
DJIA: 15,855.12 – this price point was breached.
This analysis is published about 12:03 a.m. EST.
I still view this as the end of a B wave (A wave concluded in the lows of August, with the B wave made of (a) + a/b (@2,020) and c ( ~ @1,870) of (b) and this 5-wave upward trend being the (c) wave to finish the B wave). 2,030 is a good target to start shorting for the C wave to new lows into November. Let’s see what happens this coming week.
So you think new highs are in our future? (not that there is anything wrong with that) 🙂
We might have topped here (as we already have 5 waves up), but there is a chance that we reach ~[2,030-2,040] where (my count): wave a of wave B (1,995 – 1,837) = wave c of wave B (2,030 – 1,872). All the ups & downs from 1,995 to 1,837 is wave b of wave B (wave b=a+b+c). We’ll find out this week and confirm whether big wave C means going to lower lows.
A chart of this idea would be most useful. I find it really hard to follow your explanation… and I’m trying!
If I’m following you correctly, you see a zigzag complete (for an A wave) to the big low of 1,965 in August?
And subsequent sideways movement a big B wave which is incomplete?
Yes, kind of that scenario. Zig-zag for A to 1,865 (i think the low was 1,837), then a of B to 1,995, and then b as an a/b/c (or w/x/y) finishing down at 1,873….and from there we are up 5 waves for wave c of B. I will try to load up a chart later on, sorry. So, it could be that by 2,020-2,040 we are finishing the c wave of B wave, and ready to start a big fat C wave to lower lows. That’s my main scenario.
The market is definitely trading “heavy” – despite a clear absence of motivated sellers the advance is tepid and loosing momentum. As I heard Lara sagely once observe, the market does not necessarily need sellers to decline and can do so on its own torpidity. Many comparing August to correction in 2011 but one huge difference is the protracted failure to re-test the recent lows so forming a base for a more sustained advance. Contrary to the confident claims of a “V” shaped bullish bounce, I think this is uber bearish. This is the longest fourth wave correction I have ever seen and different from any other similar correction the last six years. If it is a fourth wave, I think wave five is going to be massively extended and blow out the recent lows. As soon as Joe six-pack realizes we have probably put in a final top the stampede for the exits ought to be dramatic. Stand by for QE 4 and the final shorting opportunity of a life-time…
Great update!