
Upwards movement was expected although the target at 2,013 was inadequate.
Summary: Upwards movement may be over for the short term. A downwards correction may begin tomorrow and would be confirmed with a breach of the trend channel on the hourly chart. The possibility of a little more upwards movement will remain while price remains within the channel. The next wave down is expected to be a B wave. These are typical consolidation movements; impossible to predict each swing within them, B waves may unfold as one of 23 possible structures. Analysis will focus on identifying when the B wave is over rather than the pathway it takes.
To see how each of the bull and bear wave counts fit within a larger time frame see the Grand Supercycle Analysis.
To see last analysis of weekly and monthly charts go here.
If I was asked to pick a winner (which I am reluctant to do) I would say the bear wave count has a higher probability. It is better supported by regular technical analysis at the monthly chart level, it fits the Grand Supercycle analysis better, and it has overall the “right look”.
New updates to this analysis are in bold.
BULL ELLIOTT WAVE COUNT
DAILY CHART
Click chart to enlarge.
Cycle wave IV should exhibit alternation to cycle wave II. Cycle wave IV may find support at the teal channel on the weekly and monthly charts.
Cycle wave II was a shallow 0.41 zigzag lasting three months. Cycle wave IV should exhibit alternation in structure and maybe also alternation in depth. Cycle wave IV may end when price comes to touch the lower edge of the teal channel which is drawn about super cycle wave V using Elliott’s technique.
Cycle wave IV is likely to end within the price range of the fourth wave of one lesser degree. Because of the good Fibonacci ratio for primary wave 3 and the perfect subdivisions within it, I am confident that primary wave 4 has its range from 1,730 to 1,647.
If a zigzag is complete at the last major low as labelled, then cycle wave IV may be unfolding as a flat, combination or triangle.
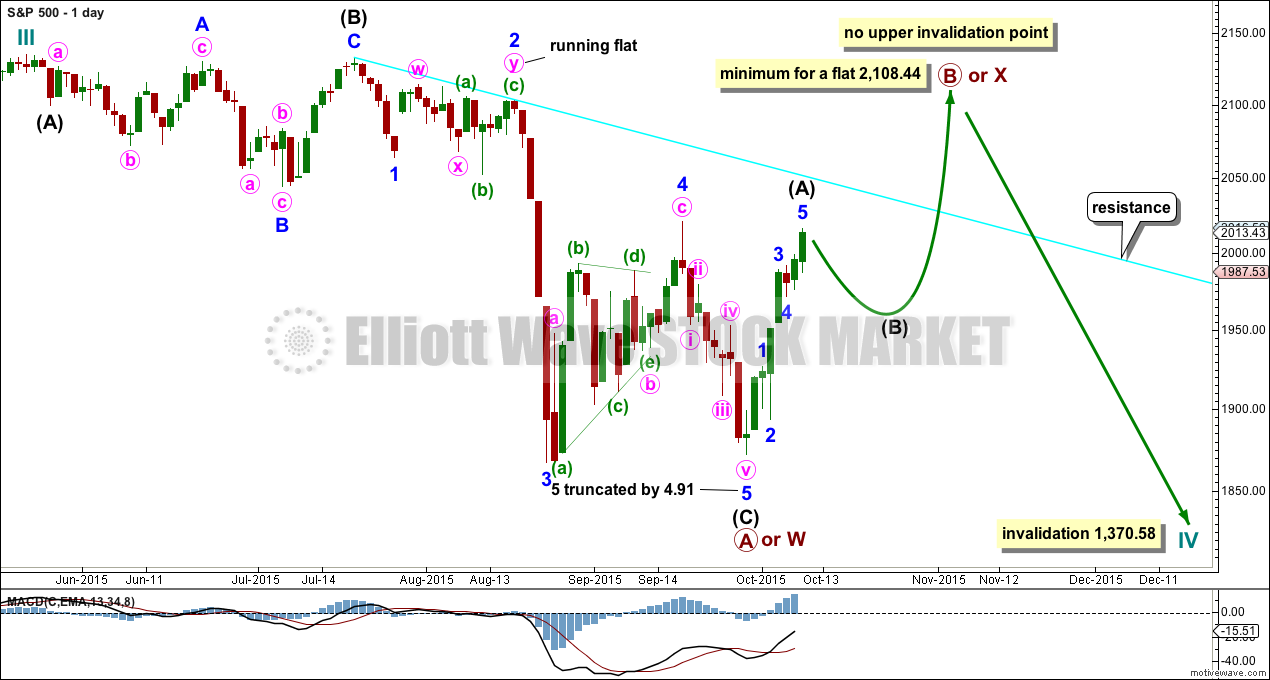
If cycle wave IV is a flat correction, then within it primary wave B must subdivide as a corrective structure (a three or a triangle) and must end at least 90% the length of primary wave A at 2,108.44. Primary wave B of an expanded flat may make a new all time high above 2,134.72. There is no upper invalidation point for this idea.
If cycle wave IV is a combination, then it would be labelled primary waves W-X-Y. Primary wave X may be any corrective structure and it has no minimum requirement, unlike the B wave within a flat. X waves within combinations are most often deep corrections to achieve the purpose of a big sideways movement. X waves may move beyond the start of W waves. There is no upper invalidation point for this idea either.
If cycle wave IV is a triangle, then primary wave B upwards has no minimum requirement, must subdivide as a three wave structure (most likely a zigzag), and may also make a new all time high as in a running triangle. There is no upper invalidation point for this idea either.
Of all Elliott waves it is B waves which exhibit the greatest variety in structure and form. They are extremely difficult to analyse. Often, it is only when they are complete that their structure can be determined.
At this stage, primary wave B looks like it may be unfolding as a zigzag. This may change though.
HOURLY CHART
Click chart to enlarge.
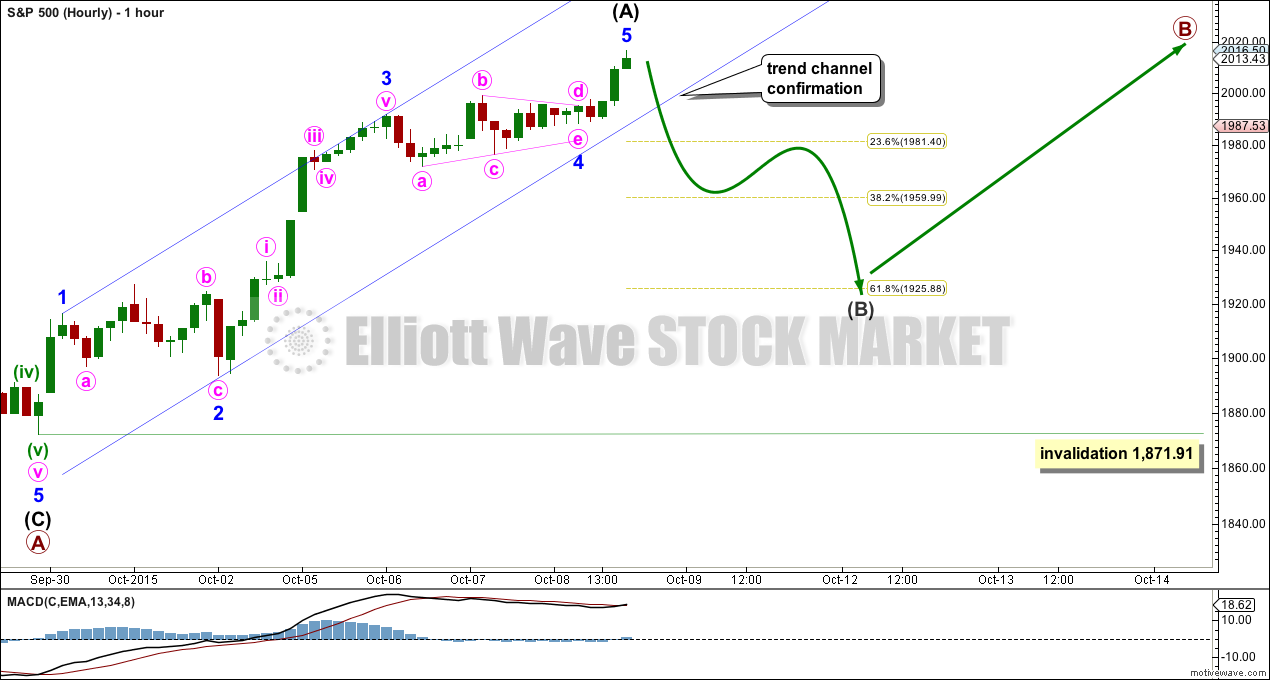
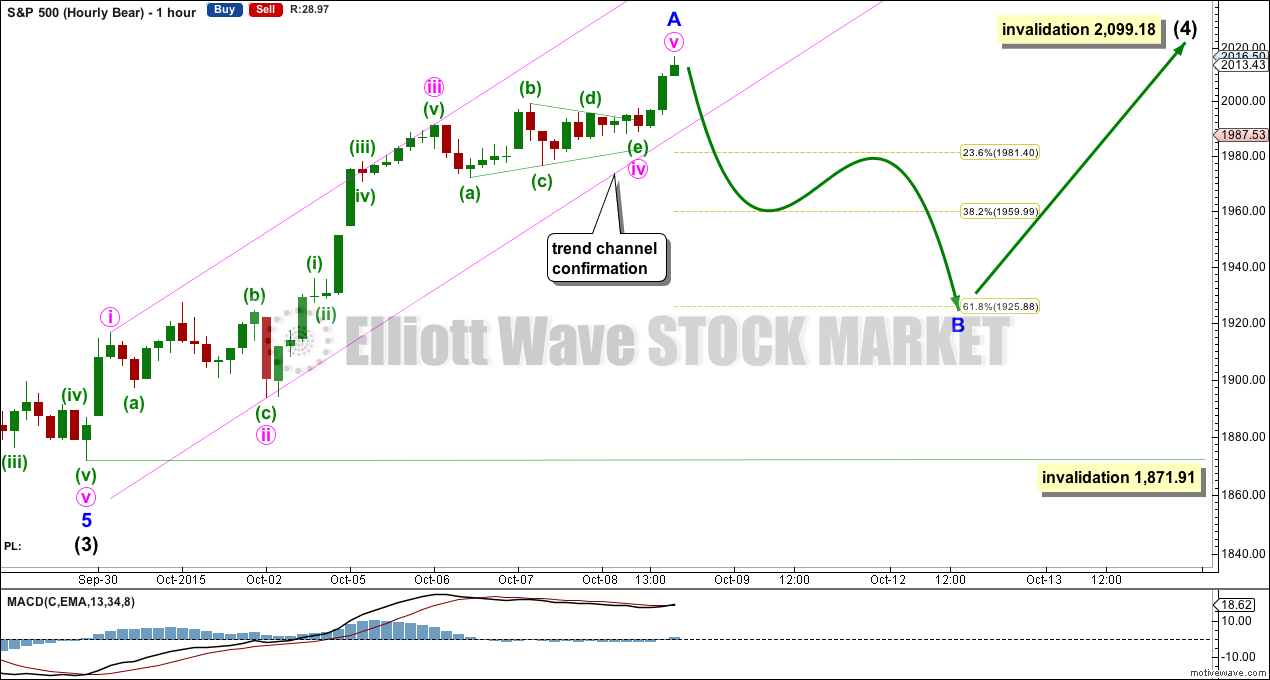
Minor wave 4 continued sideways and will subdivide as a nine wave triangle on the five minute chart. Minor wave 5 is 0.69 points longer than 0.618 the length of minor wave 1, and it is only very slightly longer than the widest part of the triangle. MACD shows a decline in momentum at Thursday’s high. It looks like upwards movement may be over for now.
The end of intermediate wave (A) would be confirmed with a breach of the channel which contains it.
Intermediate wave (B) may unfold as one of 23 possible structures (if all the different types of triangles and combinations are counted). It is impossible to say which one will unfold or even which type will unfold at the start, and it may not be clear until the end. It may be a swift sharp zigzag reaching down to the 0.618 Fibonacci ratio of intermediate wave (A) at 1,926. It may be a sideways triangle, flat or combination with deep swings taking up time and ending about the 0.382 Fibonacci ratio at 1,960.
Of all Elliott waves, it is B waves which exhibit the greatest variety in form and structure. B waves within B waves are often very complicated and difficult. This one to come for this wave count is expected to be a B wave within a B wave.
While intermediate wave (B) unfolds the analysis within it will change. The focus will be on identifying when it is over.
Intermediate wave (B) may not move beyond its start below 1,871.91, because intermediate wave (A) is a five.
ALTERNATE BULL ELLIOTT WAVE COUNT
DAILY CHART
Click chart to enlarge.
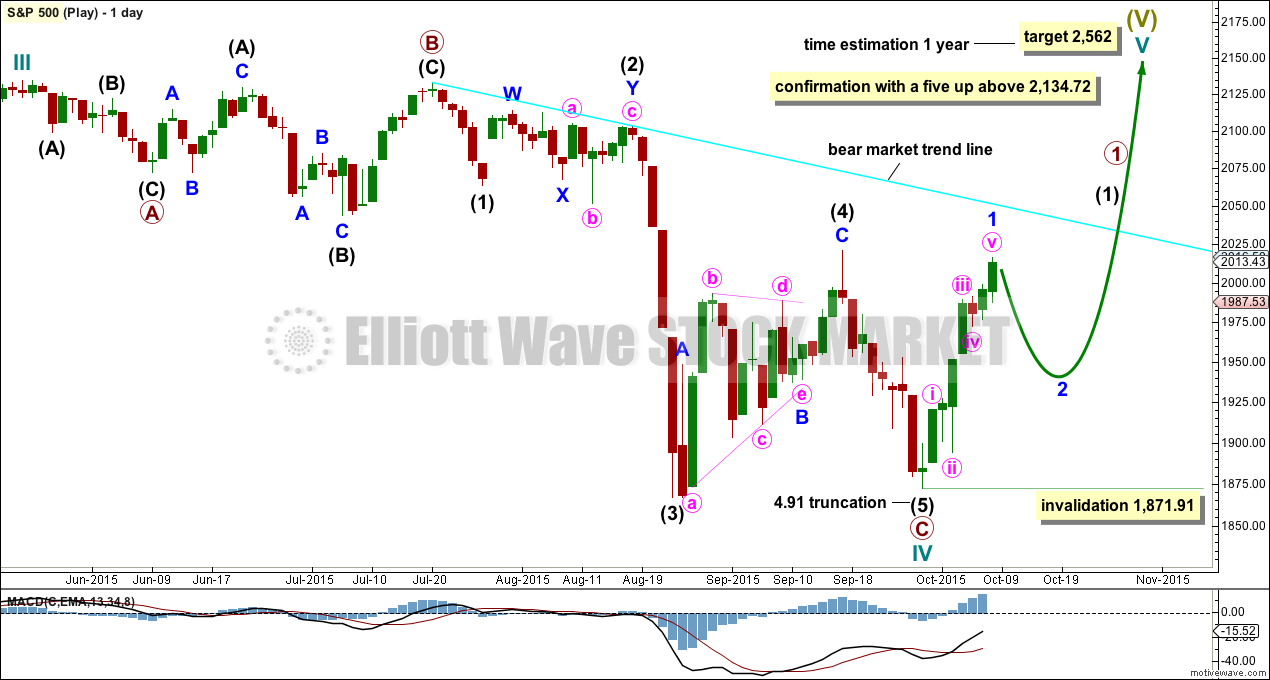
It is possible to see cycle wave IV a completed flat correction. This would provide some structural alternation with the zigzag of cycle wave II.
This is a regular flat but does not have a normal regular flat look. Primary wave C is too long in relation to primary wave A. Primary wave C would be 3.84 short of 4.236 the length of primary wave A.
This idea requires not only a new high but that the new high must come with a clear five upwards, not a three.
At 2,562 cycle wave V would reach equality in length with cycle wave I. Cycle wave I was just over one year in duration so cycle wave V should be expected to also reach equality in duration.
I am adding a bright aqua blue trend line to daily charts. Any bullish wave count such as this one must have three things for confirmation:
1. A clear breach of the bear market trend line (this line is less conservative than a bear market line drawn using Magee’s approach. That line would be almost flat. Hence two other conditions are required).
2. Price break above the 200 day Simple Moving Average.
3. A clear five up on the daily chart.
While none of these conditions are met, we should assume the trend remains the same: downwards.
BEAR ELLIOTT WAVE COUNT
DAILY CHART
Click chart to enlarge.
This bear wave count has a better fit at Grand Super Cycle degree and is better supported by regular technical analysis at the monthly chart level. But it is a huge call to make, so I present it second, after a more bullish wave count, and until all other options have been eliminated.
There are two ideas presented in this chart: a huge flat correction or a double flat / double combination. The huge flat is more likely. They more commonly have deep B waves than combinations have deep X waves (in my experience).
A huge flat correction would be labelled super cycle (a)-(b)-(c). It now expects a huge super cycle wave (c) to move substantially below the end of (a) at 666.79. C waves can behave like third waves. This idea expects a devastating bear market, and a huge crash to be much bigger than the last two bear markets on the monthly bear chart.
The second idea is a combination which would be labelled super cycle (w)-(x)-(y). The second structure for super cycle wave (y) would be a huge sideways repeat of super cycle wave (a) for a double flat, or a quicker zigzag for a double combination. It is also possible (least likely) that price could drift sideways in big movements for over 10 years for a huge triangle for super cycle wave (y).
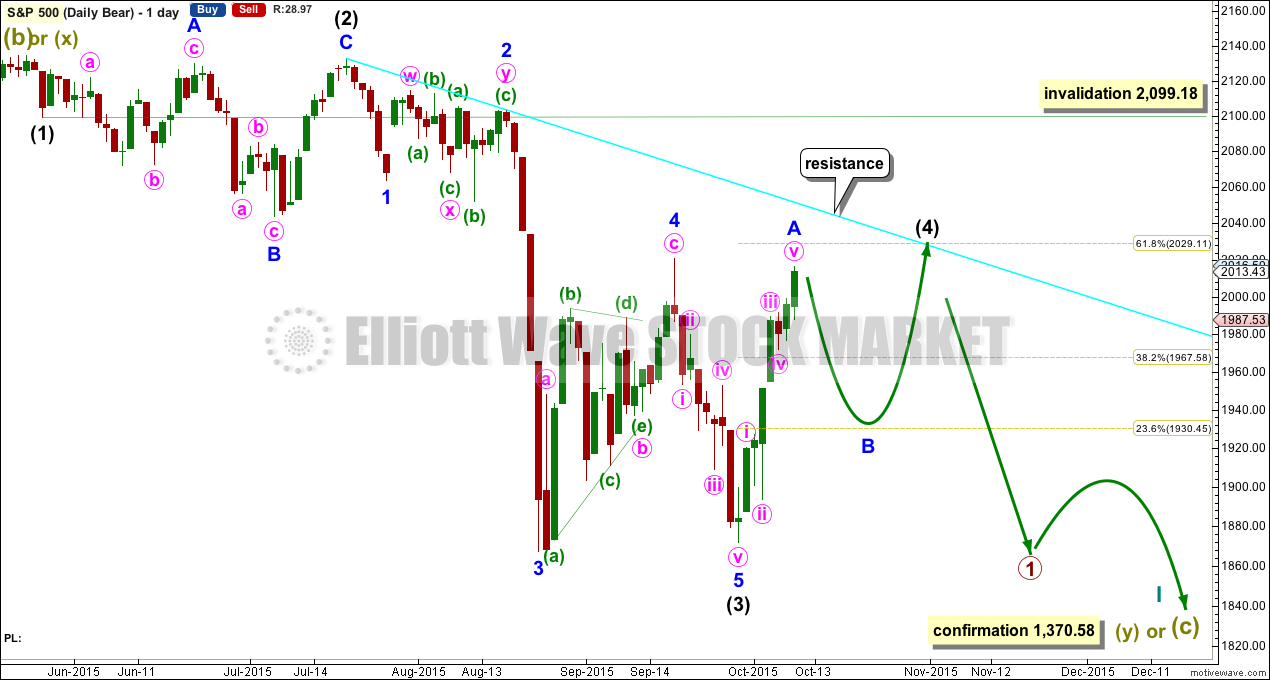
I am now seeing a third wave complete at the last major low for intermediate wave (3). Intermediate wave (3) is 17.31 longer than 6.854 the length of intermediate wave (1).
Minor wave 5 is seen as complete and slightly truncated.
A channel drawn using Elliott’s technique no longer works. Sometimes fourth waves aren’t contained within such a channel, which is why Elliott developed a second technique to use when they breach the channel.
Intermediate wave (2) was a very deep 0.95 expanded flat lasting 38 sessions. Intermediate wave (4) should exhibit alternation, is most likely to be more shallow, and be a quicker zigzag or zigzag multiple. It may not move into intermediate wave (1) price territory above 2,099.18.
At this stage, now there looks like a five up on the daily chart. For this bear wave count, this would be minor wave A either complete or close to complete. Subdivisions on the hourly chart level are the same today for all three wave counts. There is no divergence short term.
Intermediate wave (4) is not over. It may end in a total Fibonacci 21 sessions which would see it continue now for a further 14 sessions.
HOURLY CHART
Click chart to enlarge.
Intermediate wave (4) for this bear wave count is seen as unfolding as a zigzag in exactly the same way as primary wave B for the first wave count.
There is no divergence short or mid term except for the invalidation point.
The trend channel about minor wave A must be breached before any confidence may be had in this labelling of minor wave A as complete. The risk that price can continue higher must be accepted while price remains within that channel.
Minor wave B may be any one of 23 possible Elliott wave structures. It may not move beyond the start of minor wave A below 1,871.91. It may end about either the 0.382 or 0.618 Fibonacci ratios of minor wave A at 1,960 or 1,926. Neither ratio can be favoured; they are equally likely.
Minor wave B should show up on the daily chart as a corrective structure. It may take about two to even thirteen days.
TECHNICAL ANALYSIS
DAILY CHART
Click chart to enlarge. Chart courtesy of StockCharts.com.
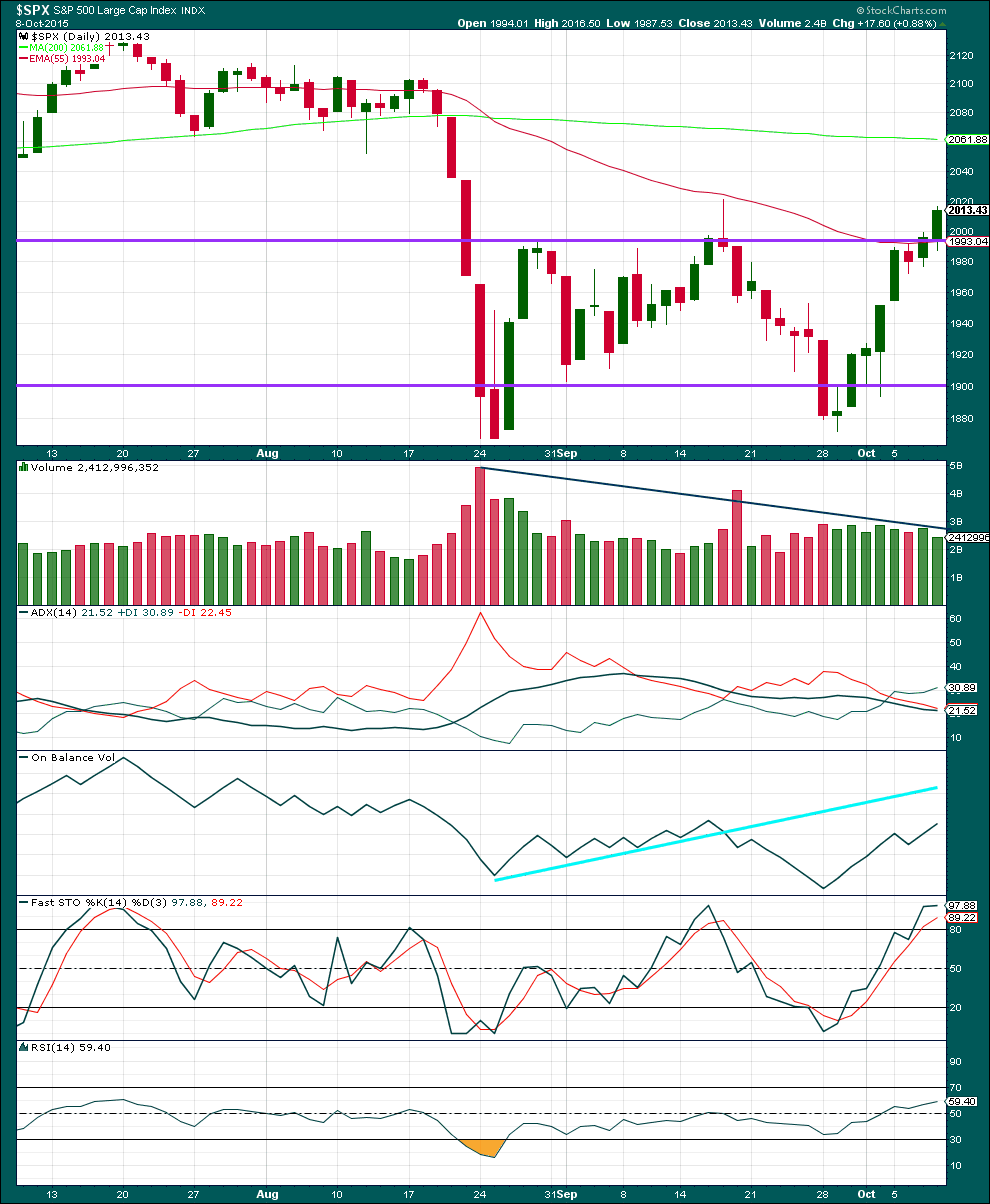
Daily: Price has now closed above the upper horizontal trend line. This rise in price is again not supported by volume, so is suspicious. This still looks more like a bear market rally than a bull market movement.
The black ADX line remains essentially flat indicating the market is not trending. Overall volume is declining while price moves sideways. During this sideways consolidation mostly contained within support and resistance lines it is a downwards day which shows clearly strongest volume. This indicates the breakout is most likely to be down.
Each time price falls volume rises, and each time price rises or drifts sideways volume has been declining. The volume profile is bearish. There is little ambiguity.
On Balance Volume has moved higher while price also moved higher. There is no divergence between price and OBV between this high and the last swing high.
Stochastics is now more strongly overbought. With ADX indicating a range bound market and price slightly overshooting resistance, downwards movement would be expected from this approach. The problem though with range bound markets is price can overshoot support and resistance with Stochastics remaining oversold or overbought for a few sessions before one swing ends and the next begins. This is why trading range bound markets is so risky. Careful money management is essential when trading during a range bound market. Alternatively, step aside and wait until a clear trend is evident, then join it.
RSI is neither overbought or oversold. There is room for the market to fall or rise.
A note on Dow Theory: for the bear wave count I would wait for Dow Theory to confirm a huge market crash. So far the industrials and the transportation indices have made new major swing lows, but the S&P500 and Nasdaq have not.
S&P500: 1,820.66
Nasdaq: 4,116.60
DJT: 7,700.49 – this price point was breached.
DJIA: 15,855.12 – this price point was breached.
This analysis is published about 08:45 p.m. EST.
Hello Lara,
What do you think about my wave count on hourly chart. I am using lines to decrease the noise. I think we are in wave B running flat that is near completion and C should start soon.
Aseem
sorry flat correction
The declining volume over the last six years has been a constant feature of this bizarre market and you are right that it has ventured to new highs on several occasions in the past on very low volume. It is an absolutely remarkable feat that the central banks have been able to move the the DJI almost two thousand points off its August lows in the past six weeks. I don’t think this changes the message of the persistently low volume but is telling us that when it does arrive, if it has not already, that we are looking at a historic top. I know it does not fit the current wave count but this current rise in the markets really has the psychological profile of a second wave re-tracement. Let’s see how the assault on the 200 d sma turns out. The sidelines are a good place to be right now I think.
Lara, is volume really needed in a real up trend? In Feb and October 2014, volume stayed lower than the previous down days while price continued to climb to new high. What do you think?
Every text book I read tells me that a rise in price associated with a decline in volume is suspicious. Normally yes, it is needed for volume to support an upwards move in price.
However I have noticed (and noted before in this analysis) that towards the last all time higher there were some waves up to new highs which occurred on declining volume, and the following downwards correction occurred on increasing volume. This is the opposite to how a normal volume profile looks. And yes, I’m looking at the high of February 2015 to 2,119.59 when this happened as you note.
See also the high of December 2014 at 2,093, that occurred on strongly declining volume.
Some time ago I noted this was unusual behaviour and suggested that maybe it was a warning that when the trend was exhausted the bear market would be very strong. It may mean something big is brewing.
I see the decline in volume over the last six years at the monthly chart level as a stronger warning.
It quite simply cannot be sustained forever. It will give way eventually.
The trick is to figure out when the trend has changed. And for that I’ve used a very simple trend line (Magee in “Technical Analysis of Stock Trends”). Trend lines are I think the strongest technical analysis, and when they’re shallow, repeatedly tested and long held they’re highly technically significant. Its been very strongly broken some time ago telling us that the S&P is in a bear market now.
Lara, the aqua blue trend line by Magee is in what chapter of the book? I have the reprint of the 4th edition by martino publishing.