
More upwards movement was expected for Monday. Price reached well above the target.
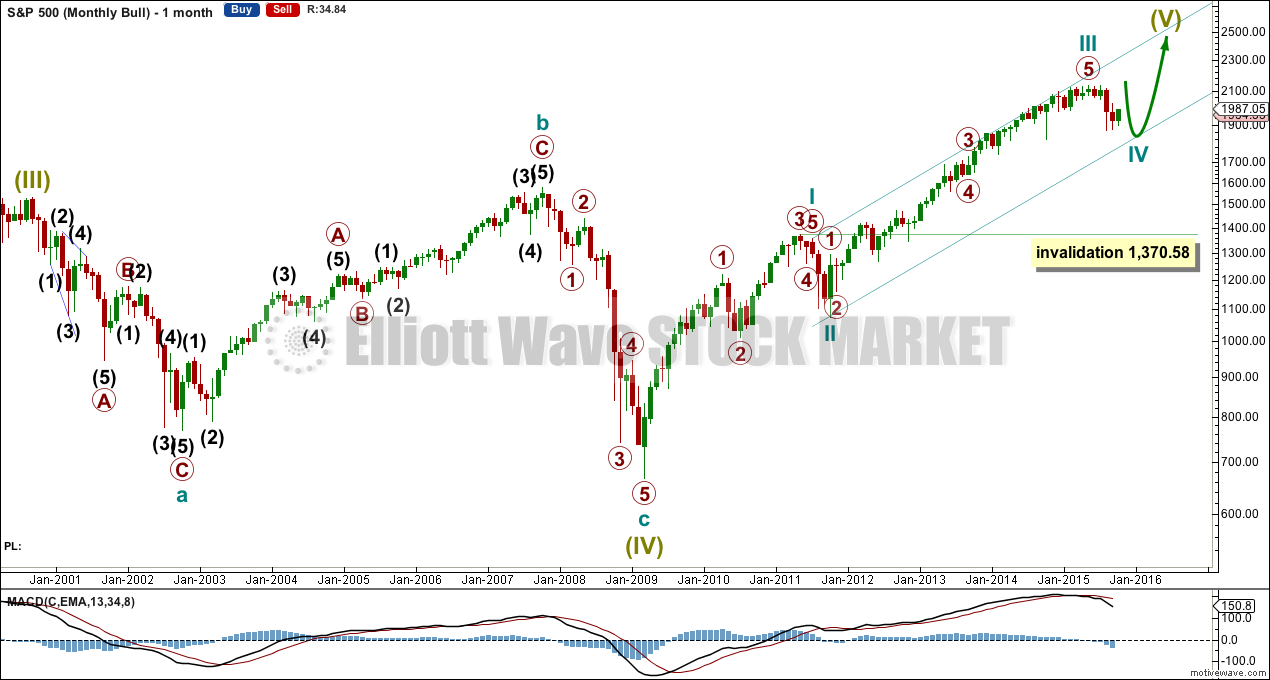
Summary: I’ve taken a big step back today to look at the bigger picture, resulting in a changed wave count. I am still confident the S&P remains in a bear market because of regular technical analysis at the monthly chart level. The bull wave count has everything moved up one degree. A zigzag down is likely complete for an A or W wave. A three up is likely incomplete for a B or X wave. The bear wave count now sees price in a fourth wave correction which may be over.
To see how each of the bull and bear monthly charts fit within a larger time frame see the Grand Supercycle Analysis.
Changes to last analysis are bold.
BULL ELLIOTT WAVE COUNT
MONTHLY CHART
Click chart to enlarge.
Everything within the bull wave count is now moved up one degree to be in line with the Grand Supercycle Analysis.
The correction is now seen not as primary wave 4 but as cycle wave IV.
Cycle wave II was a shallow 0.41 zigzag lasting three months. Cycle wave IV should exhibit alternation in structure and maybe also alternation in depth. Cycle wave IV may end when price comes to touch the lower edge of the teal channel which is drawn about super cycle wave V using Elliott’s technique.
Cycle wave IV may not move into cycle wave I price territory below 1,370.58. This is the price point which differentiates the bull and bear wave counts.
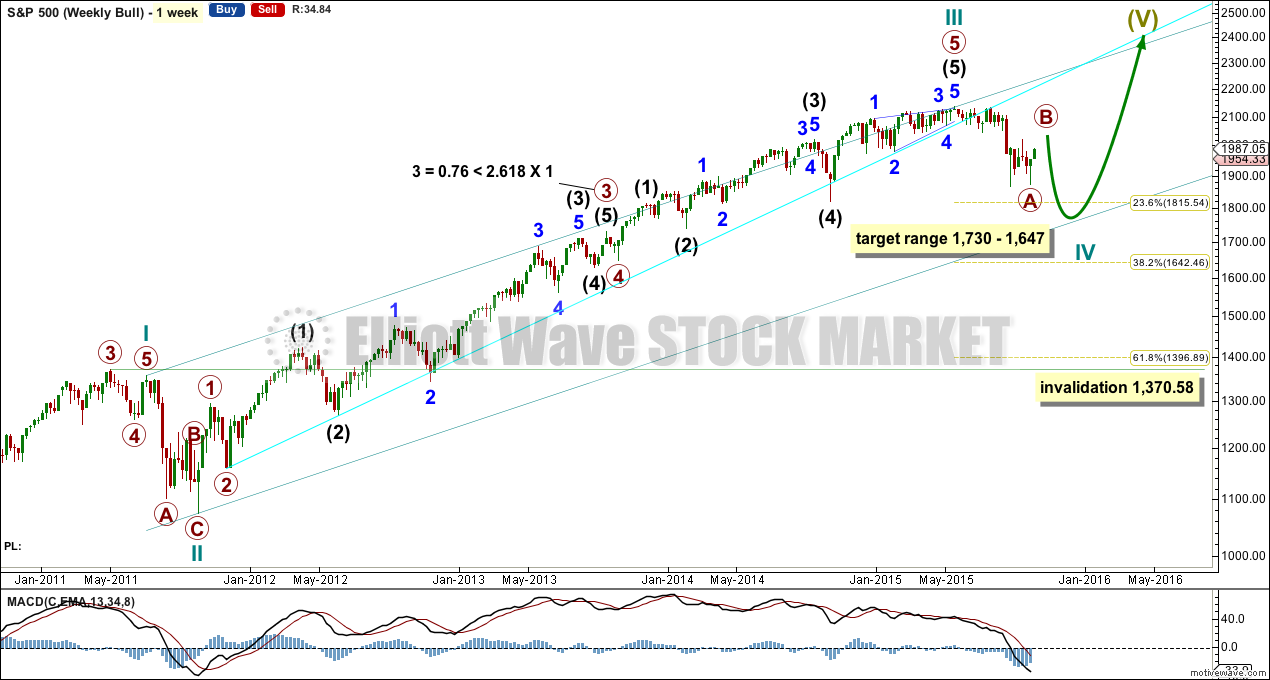
WEEKLY CHART
Click chart to enlarge.
Within cycle wave III, primary wave 3 is just 0.76 points less than 2.618 the length of primary wave 1. There is no Fibonacci ratio between primary wave 5 and either of primary waves 3 or 1.
Primary wave 3 subdivides perfectly as an impulse. Primary wave 5 ends with an ending contracting diagonal (the regular technical analysis equivalent is a rising wedge), which is a terminal structure.
Cycle wave IV should exhibit alternation to cycle wave II. Cycle wave IV is most likely to be more shallow (to find support at the teal channel) and a flat, combination or triangle.
Cycle wave IV is likely to end within the price range of the fourth wave of one lesser degree. Because of the good Fibonacci ratio for primary wave 3 and the perfect subdivisions within it, I am confident that primary wave 4 has its range from 1,730 to 1,647.
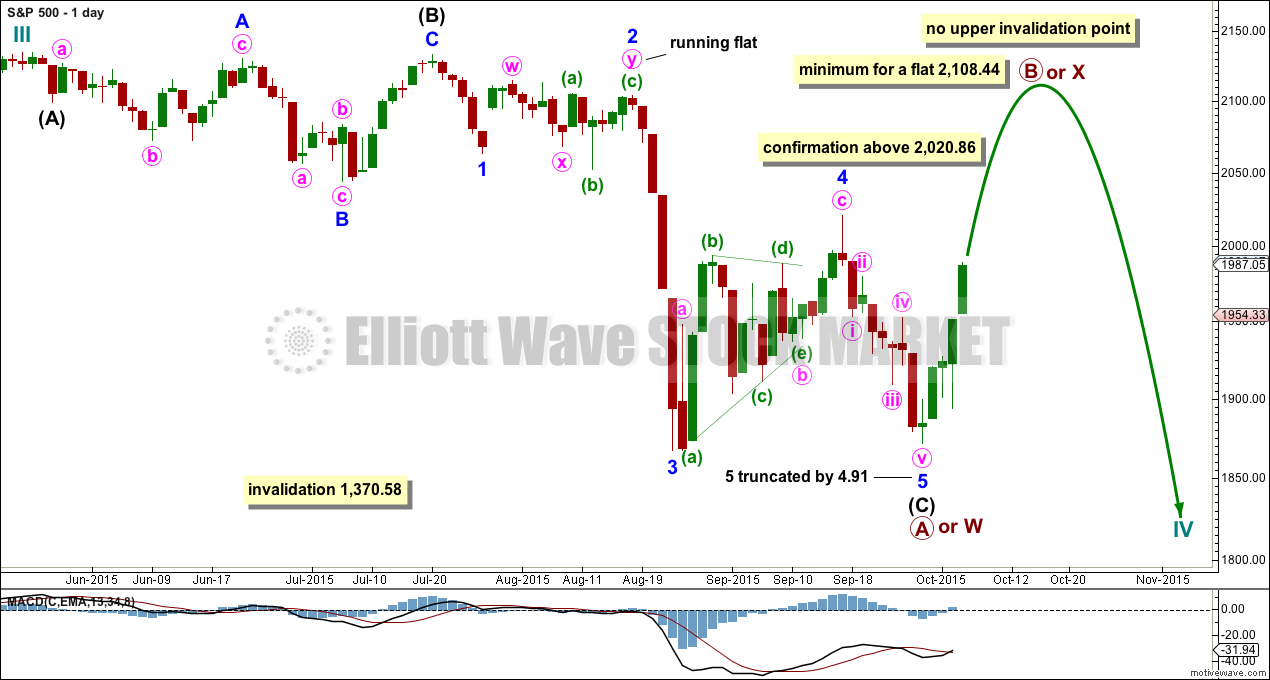
DAILY CHART
Click chart to enlarge.
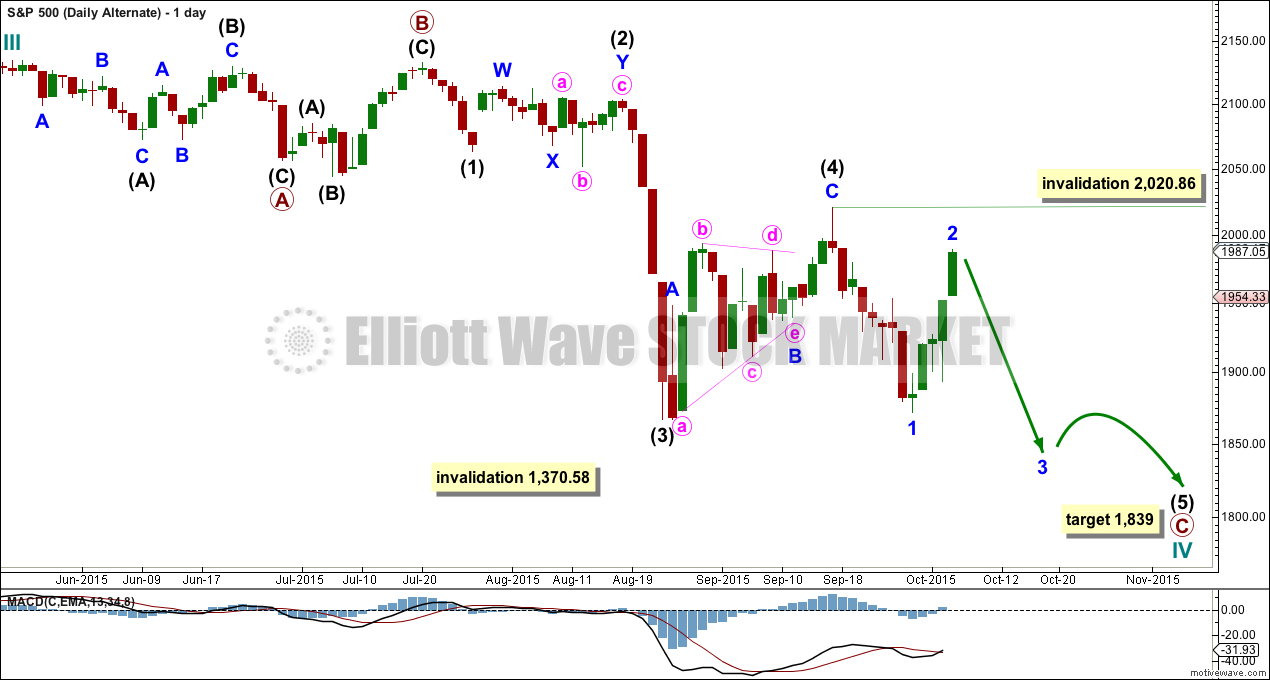
The biggest change to the wave count today is seeing a three wave zigzag complete downwards within cycle wave IV.
The last wave count increasingly did not have the right look. It was trying to see a regular flat correction with a remarkably long C wave.
If a zigzag is complete at the last major low as labelled, then cycle wave IV may be unfolding as a flat, combination or triangle.
This idea would have earliest confirmation with a new high above 2,020.86. That would invalidate the first alternate.
If cycle wave IV is a flat correction, then within it primary wave B must subdivide as a corrective structure (a three or a triangle) and must end at least 90% the length of primary wave A at 2,108.44. Primary wave B of an expanded flat may make a new all time high above 2,134.72. There is no upper invalidation point for this idea.
If cycle wave IV is a combination, then it would be labelled primary waves W-X-Y. Primary wave X may be any corrective structure and it has no minimum requirement, unlike the B wave within a flat. X waves within combinations are most often deep corrections to achieve the purpose of a big sideways movement. X waves may move beyond the start of W waves. There is no upper invalidation point for this idea either.
If cycle wave IV is a triangle, then primary wave B upwards has no minimum requirement, must subdivide as a three wave structure (most likely a zigzag), and may also make a new all time high as in a running triangle. There is no upper invalidation point for this idea either.
Of all Elliott waves it is B waves which exhibit the greatest variety in structure and form. They are extremely difficult to analyse. Often, it is only when they are complete that their structure can be determined.
At this stage, primary wave B looks like it may be unfolding as a zigzag. This may change though.
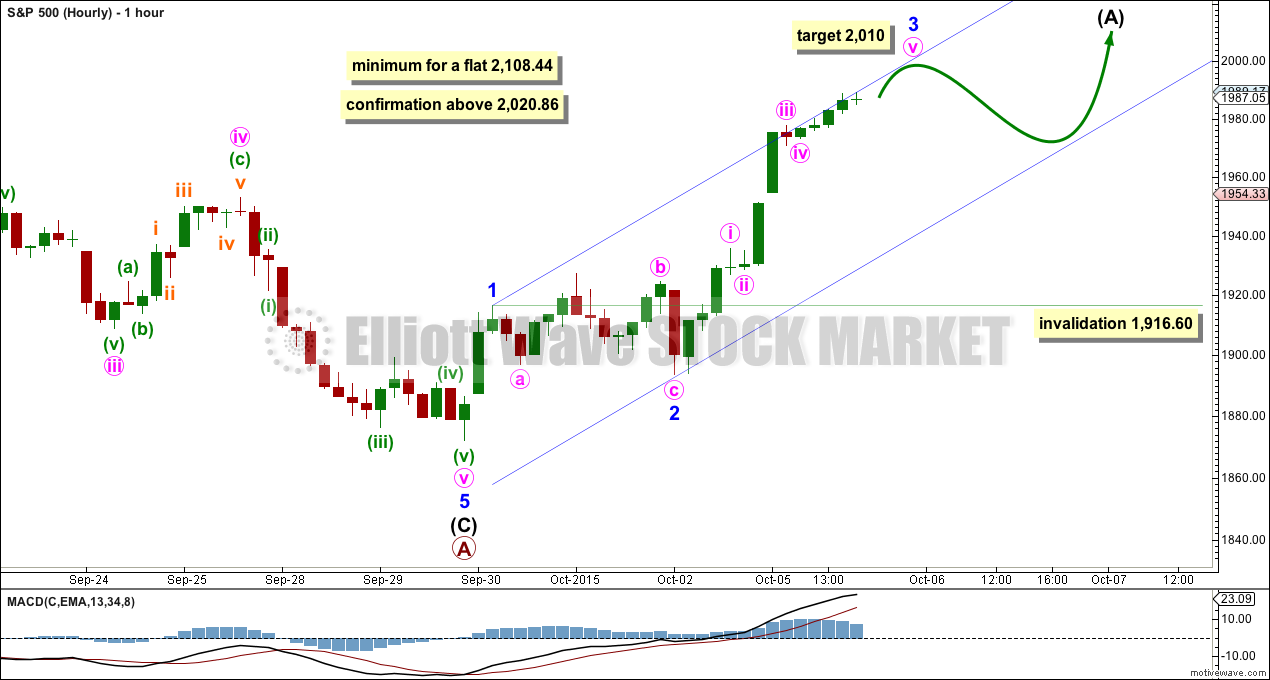
HOURLY CHART
Click chart to enlarge.
The increase in momentum for Monday’s session looks like a third wave unfolding. If primary wave B is to be a zigzag, then intermediate wave (A) must be a five wave structure. It does now look on the hourly chart like an impulse is unfolding upwards.
At 2,010 minor wave 3 would reach 1.618 the length of minor wave 1.
The blue channel is an acceleration channel. Draw it from the end of minor wave 1 to the last high. If price keeps moving higher keep redrawing the channel. Place a parallel copy on the low of minor wave 2. Minor wave 4 may find support at the lower edge of the channel.
Minor wave 4 may not move into minor wave 1 price territory below 1,916.60.
ALTERNATE BULL ELLIOTT WAVE COUNT
DAILY CHART
Click chart to enlarge.
This idea follows on from the alternate wave count in last analysis.
This idea sees cycle wave IV as unfolding as a regular flat correction. The problem here is the length of primary wave C in relation to primary wave A. This would be a regular flat because primary wave B is only a 98% correction of primary wave A. Regular flats normally have C waves which are about even in length with their A waves so the whole structure moves sideways. The C wave does not normally end so far below the A wave.
Here primary wave C would be an incomplete impulse. The final fifth wave would be unfolding.
At 1,839 intermediate wave (5) would reach 2.618 the length of intermediate wave (1).
Minor wave 2 may not move beyond the start of minor wave 1 above 2,020.86.
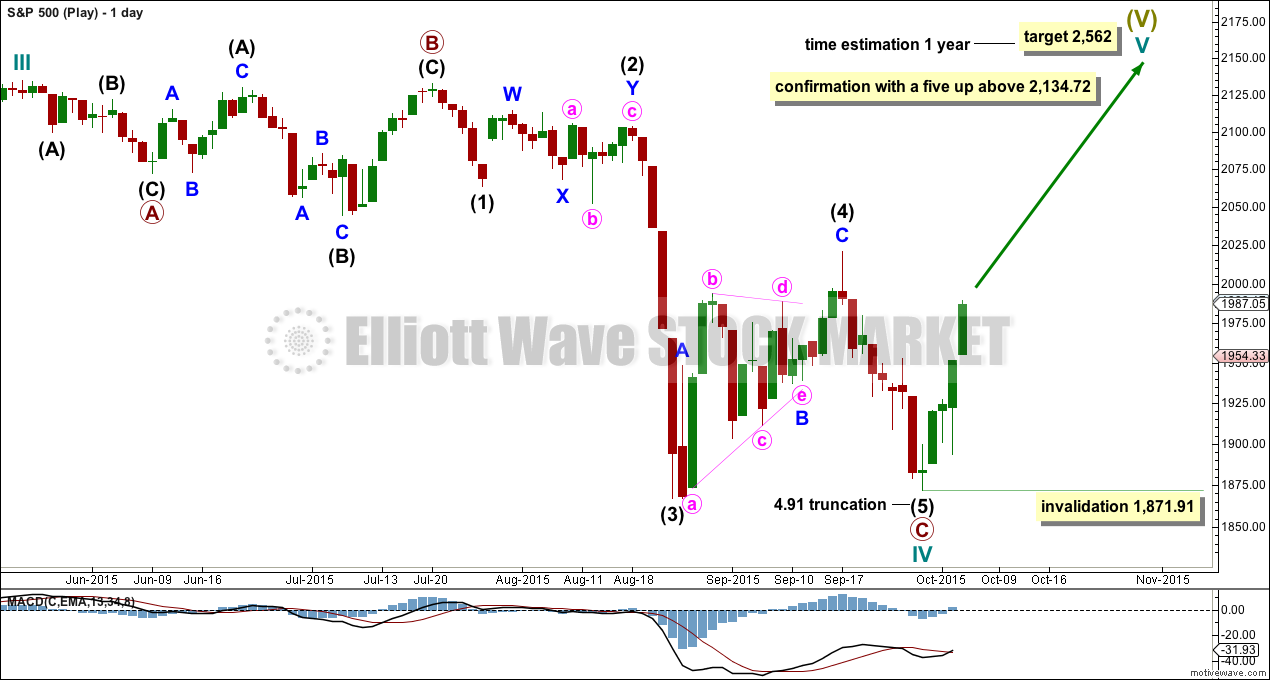
SECOND ALTERNATE BULL ELLIOTT WAVE COUNT
DAILY CHART
Click chart to enlarge.
This idea is still the same as the second alternate presented to date, only the degree of labelling is all moved up one degree.
It is possible to see cycle wave IV a completed flat correction. This would provide some structural alternation with the zigzag of primary wave II.
This is a regular flat but does not have a normal regular flat look. Primary wave C is too long in relation to primary wave A. Primary wave C would be 3.84 short of 4.236 the length of primary wave A.
This idea requires not only a new high but that the new high must come with a clear five upwards, not a three.
At 2,562 cycle wave V would reach equality in length with cycle wave I. Cycle wave I was just over one year in duration so cycle wave V should be expected to also reach equality in duration.
BEAR ELLIOTT WAVE COUNT
MONTHLY CHART
Click chart to enlarge.
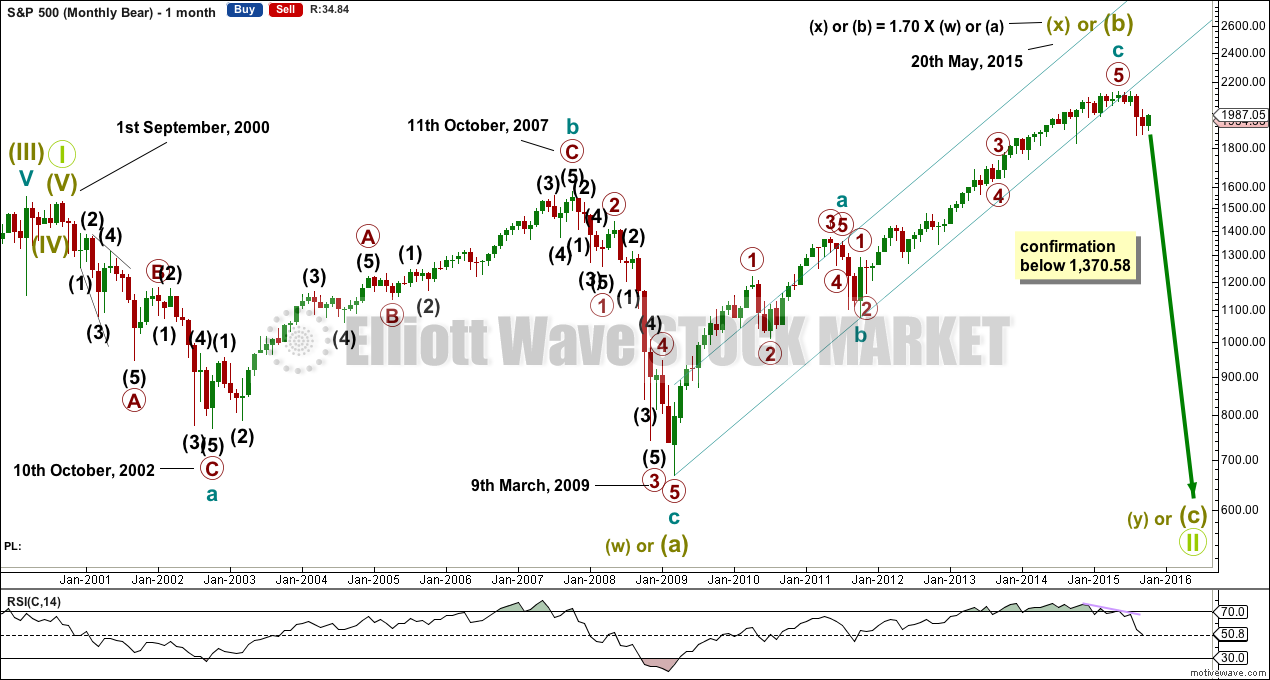
This bear wave count has a better fit at Grand Super Cycle degree and is better supported by regular technical analysis at the monthly chart level. But it is a huge call to make, so I present it second, after a more bullish wave count, and until all other options have been eliminated.
There are two ideas presented in this chart: a huge flat correction or a double flat / double combination. The huge flat is more likely. They more commonly have deep B waves than combinations have deep X waves (in my experience).
A huge flat correction would be labelled super cycle (a)-(b)-(c). It now expects a huge super cycle wave (c) to move substantially below the end of (a) at 666.79. C waves can behave like third waves. This idea expects a devastating bear market, and a huge crash to be much bigger than the last two bear markets on this chart.
The second idea is a combination which would be labelled super cycle (w)-(x)-(y). The second structure for super cycle wave (y) would be a huge sideways repeat of super cycle wave (a) for a double flat, or a quicker zigzag for a double combination. It is also possible (least likely) that price could drift sideways in big movements for over 10 years for a huge triangle for super cycle wave (y).
DAILY CHART
Click chart to enlarge.
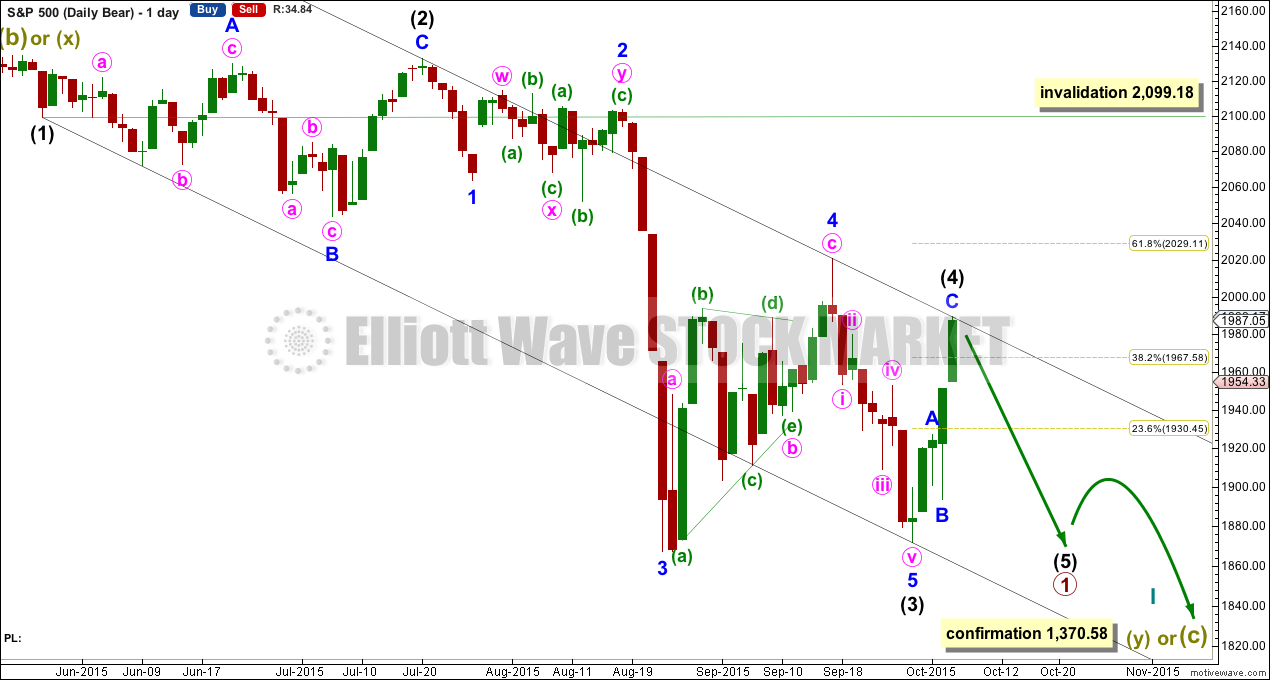
Today this wave count too is changed.
Because the duration of this downwards movement so far, I have decided to move the labelling all up one degree.
I am now seeing a third wave complete at the last major low for intermediate wave (3). Intermediate wave (3) is 17.31 longer than 6.854 the length of intermediate wave (1).
Intermediate wave (5) is seen as complete and slightly truncated.
The channel is drawn about primary wave 1 using Elliott’s first technique, as shown, and it shows exactly where minor wave 4 ended and where upwards movement for Monday ended. This suggests price may find resistance here, and a bounce down may happen.
Intermediate wave (2) was a very deep 0.95 expanded flat lasting 38 sessions. Intermediate wave (4) should exhibit alternation, is most likely to be more shallow, and be a quicker zigzag or zigzag multiple. It may be over at Monday’s high, or it may continue a little higher. It may not move into intermediate wave (1) price territory above 2,099.18.
TECHNICAL ANALYSIS
MONTHLY CHART
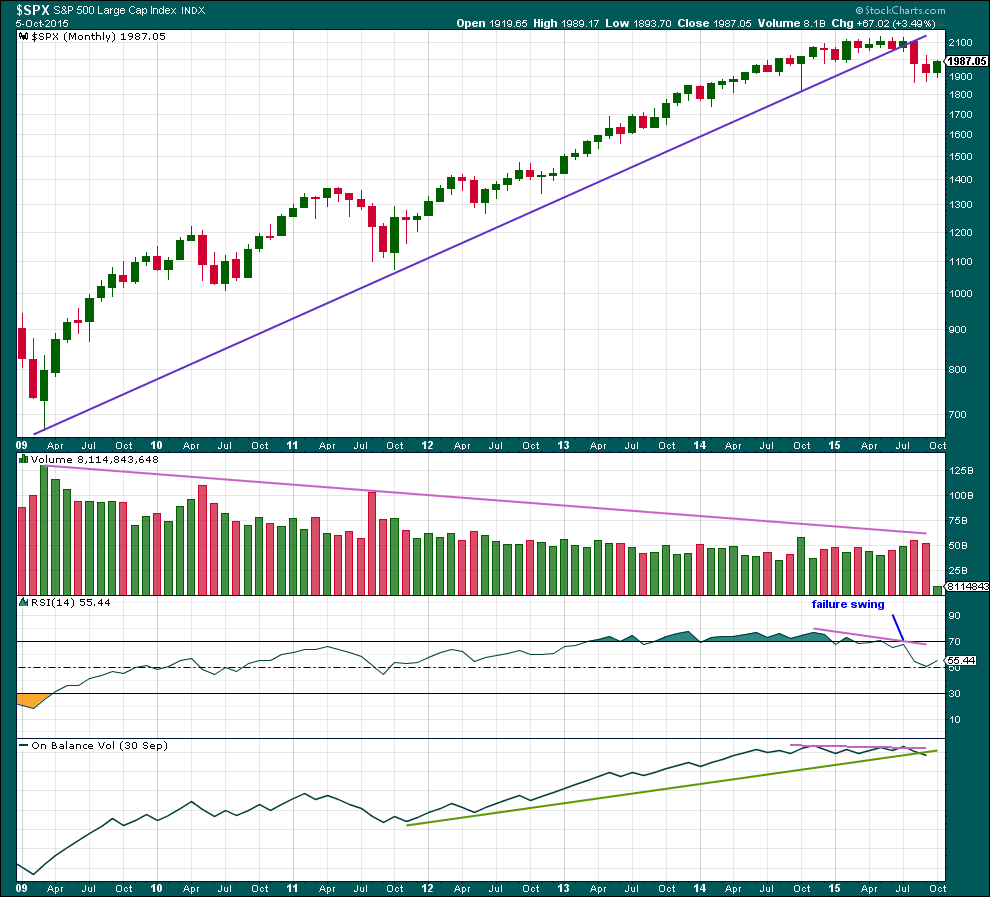
Click chart to enlarge. Chart courtesy of StockCharts.com.
Monthly: The long trend line on price is drawn from the low of March 2009, at 666.79 to the low in October 2011. This trend line was repeatedly tested, breached, and then provided resistance in August 2015. Price has closed well over 3% of market value below it. Trend lines like this one which are reasonably shallow, long held and repeatedly tested are highly technically significant. The breach tells us the market has switched from bull to bear. This supports the bear wave count over the bull.
Volume has overall declined during the bull market spanning over 6 years. The rise in price was not supported by volume at the monthly chart level. This also supports the bear wave count over the bull.
RSI shows double negative divergence with price as the final highs were made. Finally, a failure swing on RSI completes a pattern which was last seen in September 2000, and October 2007. This pattern indicates a large bear market may begin from here and supports the bear wave count over the bull.
On Balance Volume also shows divergence with price as the final highs were made.
Not only is there nothing bullish about this picture at the monthly chart level, it is very bearish indeed. It indicates that recent downwards movement is more likely to be the start of a large bear market than it is to be another correction within a continuing bull market.
DAILY CHART
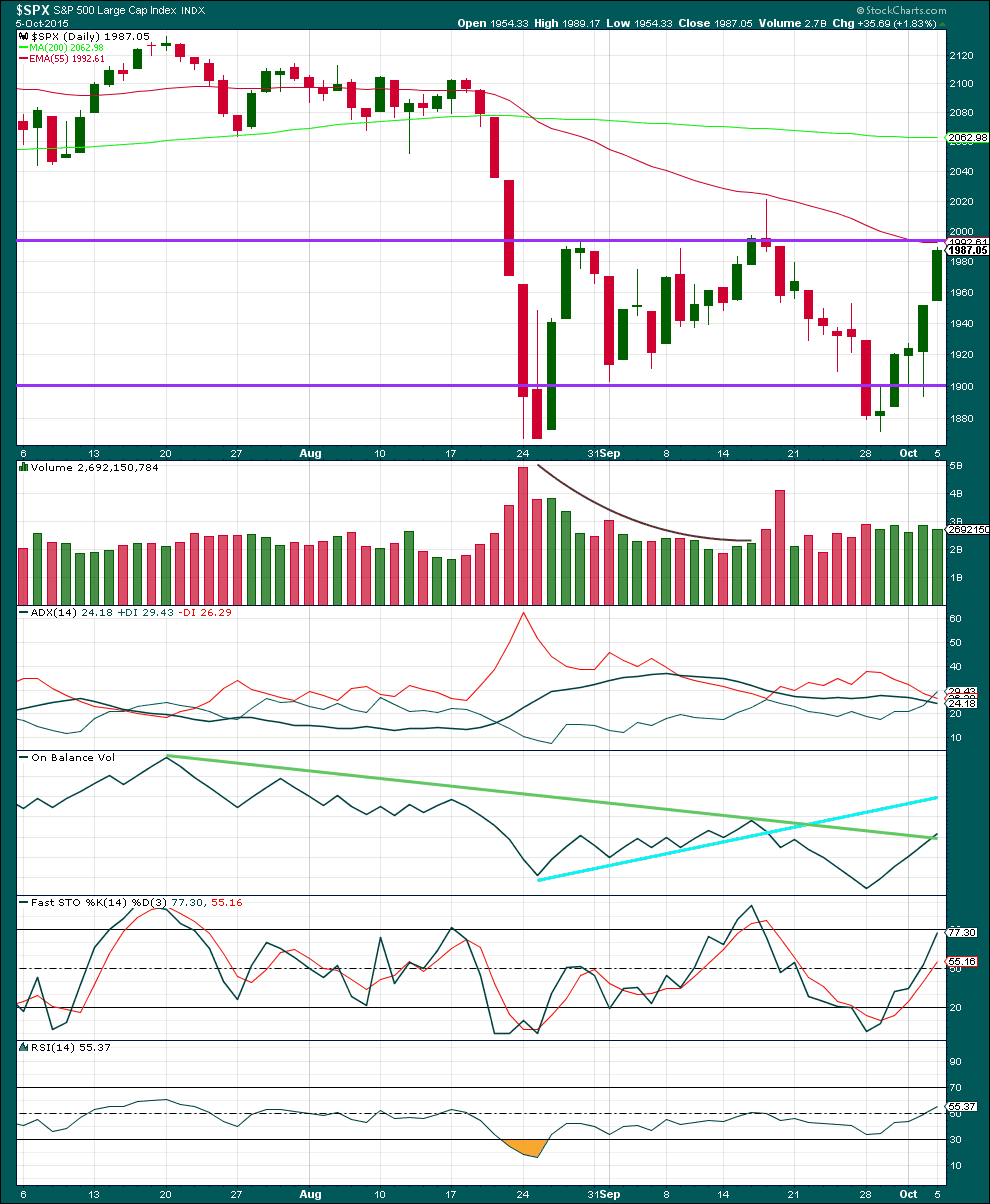
Click chart to enlarge. Chart courtesy of StockCharts.com.
Daily: Upwards movement may find resistance at the upper horizontal trend line and Kaufman’s Moving Average. Monday’s strong upwards day is not supported by volume.
Volume consistently favours a bear wave count over a bull, and indicates this upwards movement is a correction and not a new trend.
Each time price falls volume rises, and each time price rises or drifts sideways volume has been declining. The volume profile is bearish. There is little ambiguity.
The black ADX line has flattened off indicating the market is not trending.
If price moves higher, it may stop when OBV comes up to touch the downwards sloping green trend line. This line is now slightly overshot OBV. However, this trend line is not very technically significant.
RSI is neither overbought or oversold. There is room for the market to fall or rise.
A note on Dow Theory: for the bear wave count I would wait for Dow Theory to confirm a huge market crash. So far the industrials and the transportation indices have made new major swing lows, but the S&P500 and Nasdaq have not.
S&P500: 1,820.66
Nasdaq: 4,116.60
DJT: 7,700.49 – this price point was breached.
DJIA: 15,855.12 – this price point was breached.
This analysis is published about 01:28 a.m. EST.
Looks like a small degree fourth wave today which means another leg up to complete the upward correction or continue the march higher. I think any movement above 2020.86 will be short term bullish.
Agreed. And that would fit the new bull wave count.
Which is still bearish for a cycle wave IV correction to continue.