
New lows were expected, but a green candlestick was not.
Summary: Downwards movement should continue to new lows this week. If this downwards wave shows a clear strong increase in momentum beyond the last big wave down, then it would be a third wave. If it does not show a clear strong increase in momentum, then it would most likely be a fifth wave.
To see an outline of the bigger picture on monthly and weekly charts click here.
Changes to last analysis are bold.
BULL ELLIOTT WAVE COUNT
DAILY CHART
Click chart to enlarge.
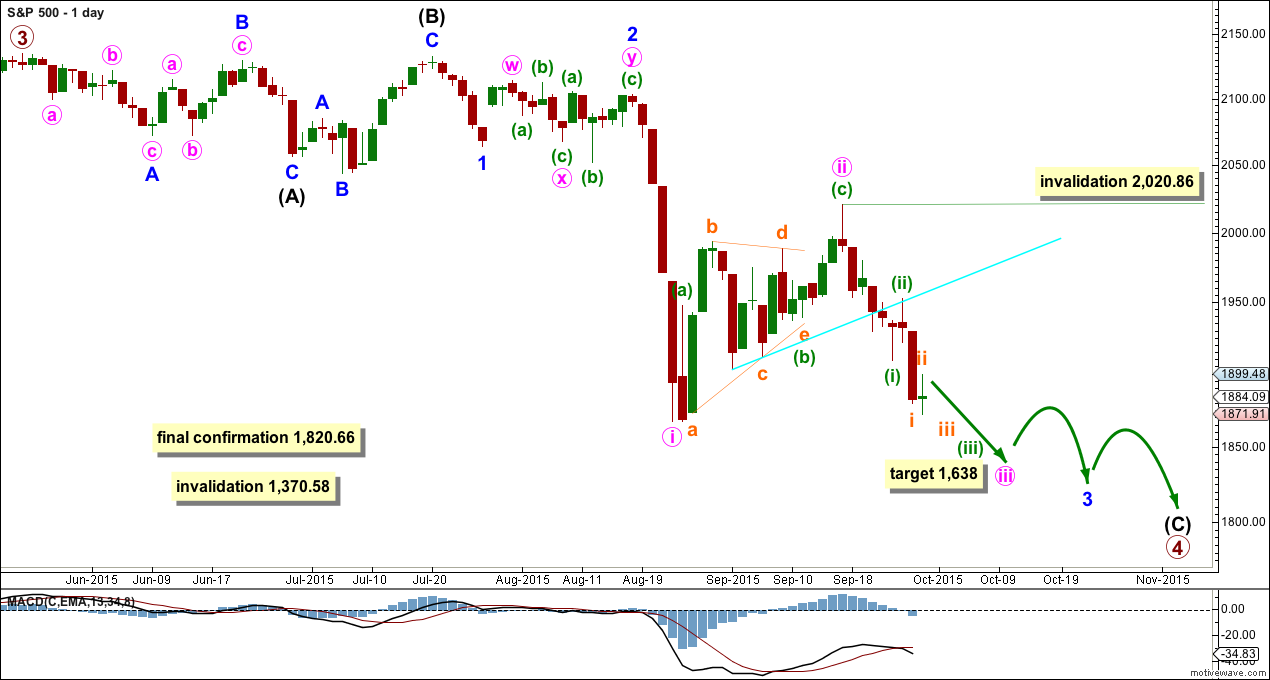
Primary wave 4 may be longer lasting than primary wave 2 as these types of sideways corrective structures tend to be more time consuming than zigzags. Primary wave 4 may complete in a total Fibonacci 21 weeks. Primary wave 4 is within its 19th week, but it may not exhibit a Fibonacci duration because the S&P does not reliably do this. Time estimates may only be taken as a very rough guide.
Within primary wave 4, it may be that intermediate waves (A) and (B) are both complete as three wave structures indicating a flat may be unfolding. Intermediate wave (C) down must be a five wave structure; it looks like it is unfolding as an impulse. For now I will leave this degree as is, but depending on where intermediate wave (C) ends I may move it back down one degree. It is also possible that only minor wave A may be unfolding as a flat correction.
At the daily chart level, this wave count sees primary wave 4 as a possible regular flat correction: intermediate wave (B) is a 98% correction of intermediate wave (A). However, regular flats normally have C waves which are close to equality with their A waves, and they normally fit nicely within parallel channels. Here intermediate wave (C) is much longer than (A) and will still move lower as its structure is incomplete. When the five wave impulse down for intermediate wave (C) is complete, then I will revisit the structure of primary wave 4 which may not be a flat. The structure at the daily chart level so far fits for the very bearish wave count better than this wave count.
If this impulse does not bring price down to the lower edge of the big channel on the weekly chart, then it may only be intermediate wave (A) of a bigger flat for primary wave 4.
Full and final confirmation of a bear market (mid term) would come with:
1. A clear five down on the daily chart.
2. A new low below 1,820.66.
As each condition is met further confidence may be had in the bigger picture for this wave count.
Primary wave 4 may not move into primary wave 1 price territory below 1,370.58. Invalidation of this bull wave count (still bullish at cycle degree) would be confirmation of the bear wave count.
Within the next wave down, whether it be a third wave or a fifth wave (as per the alternate daily wave count), no second wave correction may move beyond its start above 2,020.86.
The Dead Cat Bounce which may have ended nine trading days ago still looks more like a second wave than a fourth wave. It is most common for the S&P to show the subdivisions of its third waves clearly on the daily chart when they extend, and so this current downwards movement looks like a typical third wave so far.
At 1,638 minute wave iii would reach 1.618 the length of minute wave i.
Every day I look at the structure from the all time high on this daily chart to see if I can see a complete corrective structure for primary wave 4. Today it is not possible that it is over because the current downwards wave is incomplete.
HOURLY CHART
Click chart to enlarge.
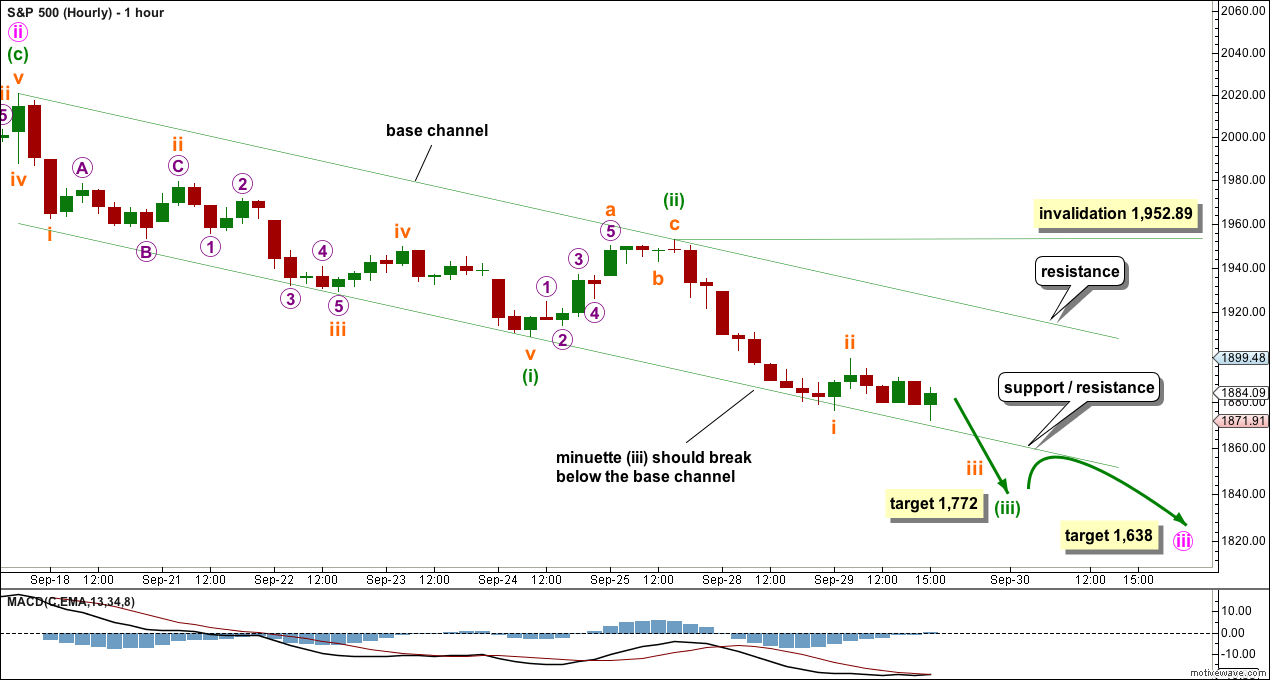
This hourly chart will suffice today for both the main wave count and the alternate below. For the alternate everything is just moved up one degree.
Corrections are likely to be relatively shallow and brief within minuette wave (iii). Subminuette wave ii is likely to be over as labelled.
Price is continuing to find support at the lower edge of the base channel drawn about minuette waves (i) and (ii). Minuette wave (iii) should have the power to break through the lower edge of this channel. When it does that then downwards momentum may increase. When the lower green trend line no longer provides support then it may provide resistance.
Any upwards corrections along the way down should find strong resistance at the upper edge, if they get that high, while price remains within the base channel. At this stage, that looks unlikely.
At 1,772 minuette wave (iii) would reach 1.618 the length of minuette wave (i).
If my labelling of subminuette waves i and ii is wrong, and subminuette wave ii is yet to show up, then subminuette wave ii may not move beyond the start of subminuette wave i above 1,952.89.
ALTERNATE BULL ELLIOTT WAVE COUNT
DAILY CHART
Click chart to enlarge.
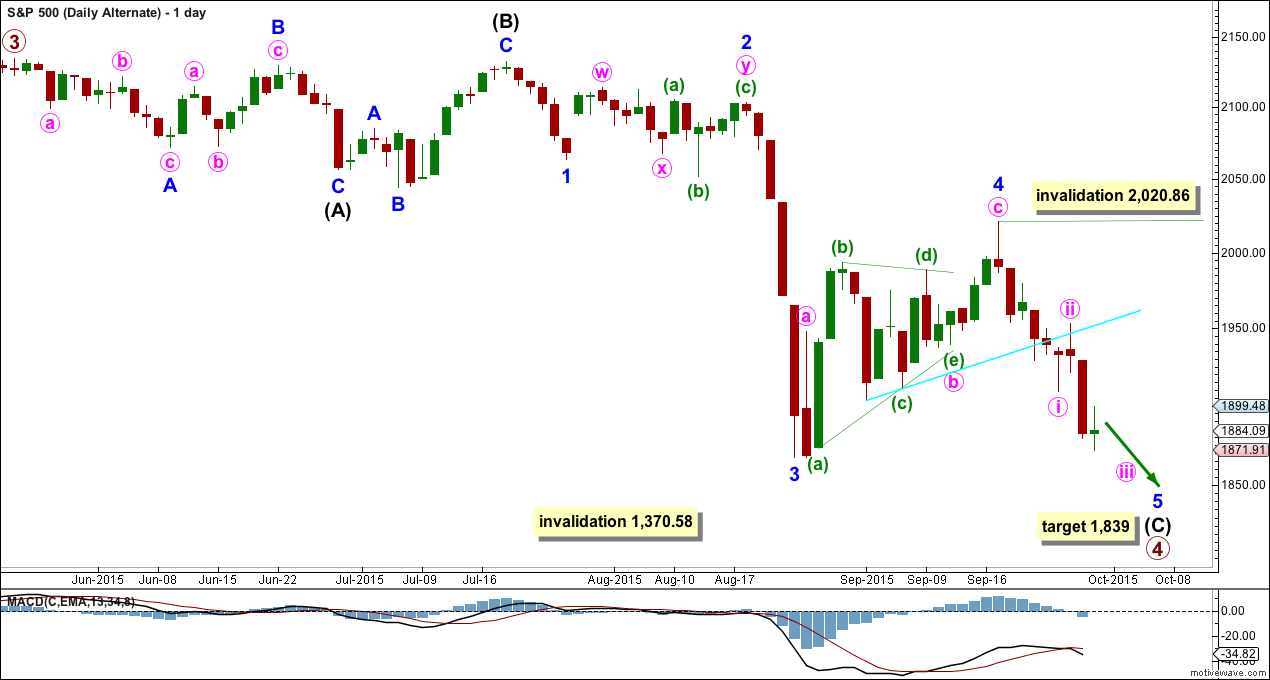
Here the subdivisions of the waves are seen in exactly the same way as the main wave count, except the degree of labelling within the last wave down and the following Dead Cat Bounce are all moved up one degree.
Minor wave 2 was a deep 0.58 double combination and minor wave 4 was a deep 0.65 zigzag. There is little alternation in depth but adequate alternation in structure. Minor wave 2 lasted 15 days and minor wave 4 lasted 17 days. There is good proportion which gives the wave count the right look.
If the next wave down does not exhibit a strong increase in momentum, then this would be a good explanation.
At 1,839 minor wave 5 would reach 2.618 the length of minor wave 1.
The subdivisions on the hourly chart are exactly the same only moved up one degree. The short term outlook is exactly the same.
The difference is in the expected momentum. If the next wave down does not exhibit an increase in momentum, then this would be a reasonable explanation.
Sometimes for the S&P its fifth waves show a small increase in momentum. This idea will only be discarded if the next wave down shows a strong increase in momentum.
It is most common for third waves to be extended for the S&P. When its third waves extend they show their subdivisions clearly on the daily chart. Here the third wave does not show its subdivisions, but the current fifth wave does. This looks opposite to how I would expect these waves to unfold, and at this point this is my main objection to this alternate wave count. However, it is entirely viable. Momentum may tell us which wave count is correct.
BEAR ELLIOTT WAVE COUNT
DAILY CHART
Click chart to enlarge.
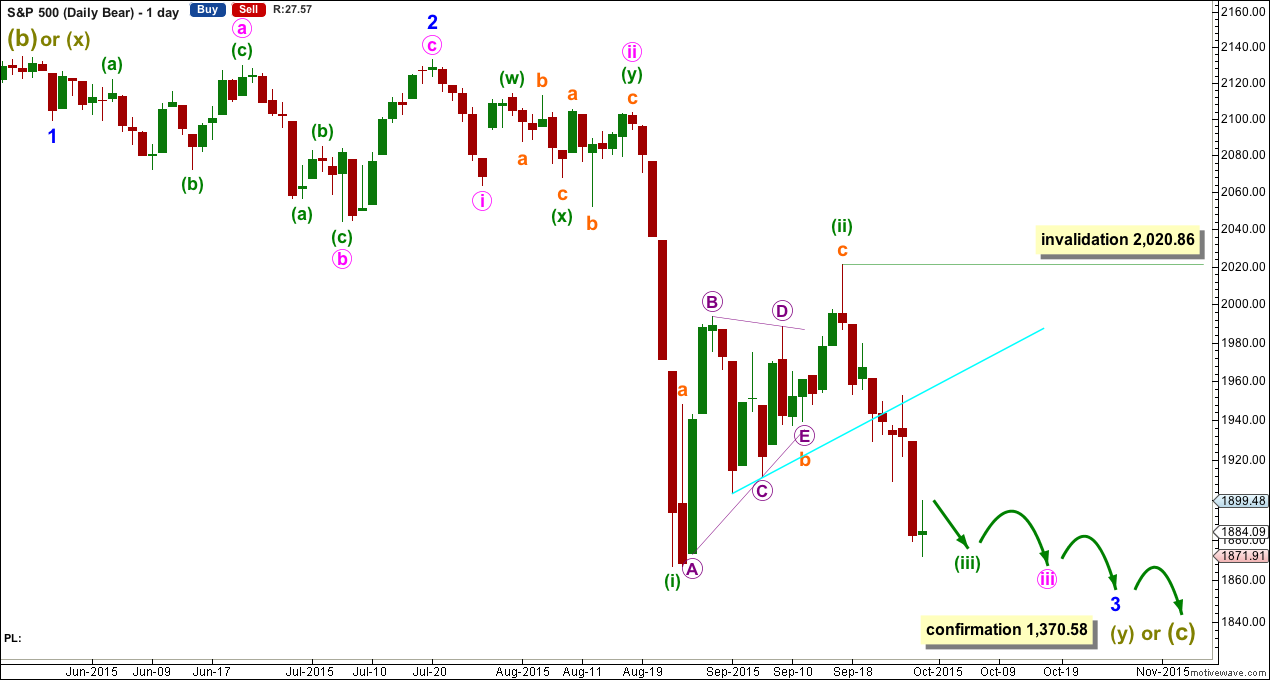
A big impulse down must begin, for this bear wave count, so a series of overlapping first and second waves should now be complete. The idea for the bull wave count (a flat correction unfolding downwards) does not work for this bear wave count.
A new low below 1,370.58 would invalidate the bull wave count confirming a huge market crash. Before that price point is passed though, structure should be a strong indication that this bear wave count would be correct. It is supported by regular technical analysis at the monthly chart level.
TECHNICAL ANALYSIS
DAILY CHART
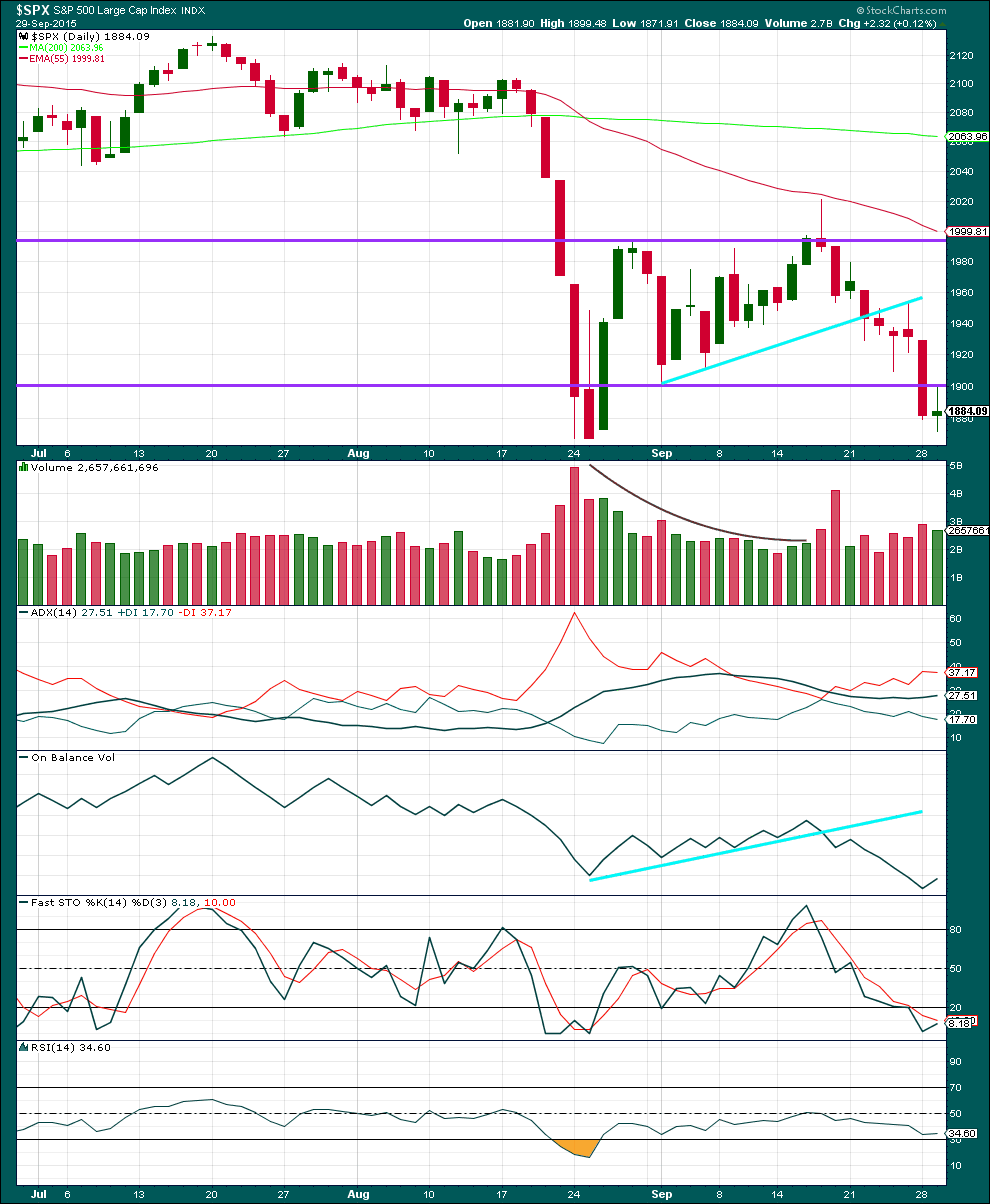
Click chart to enlarge. Chart courtesy of StockCharts.com.
Daily: A small green doji with lighter volume looks corrective. The rise in price during the session was not supported by volume.
Each time price falls volume rises, and each time price rises or drifts sideways volume has been declining. The volume profile is bearish. There is no ambiguity at all.
Price found resistance today at the horizontal purple trend line which previously provided support. This line should continue to hold and so I would not expect much upwards movement at this stage.
ADX is finally indicating the market is trending; the black ADX line is pointing upwards and is above 20. With the red -DX line above the green +DX line the trend is down.
Kaufman’s Moving Average has provided resistance to upwards movement.
On Balance Volume moves lower, and continues to agree with the downwards move in price.
Both Stochastics and RSI are neither overbought or oversold. There is room for the market to fall or rise.
A note on Dow Theory: for the bear wave count I would wait for Dow Theory to confirm a huge market crash. So far the industrials and the transportation indices have made new major swing lows, but the S&P500 and Nasdaq have not.
S&P500: 1,820.66
Nasdaq: 4,116.60
DJT: 7,700.49 – this price point was breached.
DJIA: 15,855.12 – this price point was breached.
This analysis is published about 06:54 p.m. EST.
Looks like sub-minuette 2( or minuette 2?) morphed into 3-3-5 with five wave C up unfolding today. Sharp counter-trend rallies are a key feature of bear markets so expect it.
I’m going to see this not as subminuette ii, but one degree higher as minuette (ii).
That has a better fit and look.
And now minuette (ii) shows up nicely on the daily chart, which if this current drop is a third within a third wave would give it a typical look on the daily chart.
And I don’t think it’s quite over yet. It’s breached the horizontal support / resistance line, which I did not expect it to do.
The next resistance line is the aqua blue sloping line. But that’s a long way away.
The 0.382 Fibonacci ratio at 1,930 is close to a target for C to = 2.618 X A at 1,932. If it continues higher tomorrow that would be a reasonable target.
I’ll be spending some time on the five minute chart to see if this correction could be over.
Is SPX up move over? Time to buy some more UVXY?
Hopefully today’s SPX’s high of 1916 was the end of subminuette ii. Was initially disappointed with today’s open, but this actually sets things up nicely for a big move down, adding another i/ii correction to an already highly potentially charged wave down… the markets have backed down nicely so far from today’s high… so adding to your UVXY position will LIKELY be rewarding. Still a gutsy call though. Good luck!
Well, the market did came back with a vengeance…
Up to what level could this counter rally go? Are the Big Boys trying to suck everyone in before we see the Wave down?
Upper line of the trend channel should provide resistance at around 1890, invalidation point on hourly chart is at 1952.89
Hi Lara,
Do you think the entire move up from the 2009 bottom to the recent all time highs is a wave B?
First and second waves seem to be the order of the day for the SPX decline with yet another one today. It certainly has been consistent. The strategy of the bears seems to have been to really sell futures overnight and force the banksters to expend a lot of capital defending the DOW at 16000. Monday’s huge decline was a bit surprising as they have been doing the real selling in the second half of the week and I expect the same. I am looking for them to demolish the 16000 pivot area over the next day or two now that they are sitting right on top of it; would be fitting for triple thirds…