
Downwards movement was expected again for Thursday. Price made new lows and completed a red candlestick.
On the hourly chart, upwards movement at the end of the session found resistance about the upper edge of the channel.
Summary: The wave count is changed slightly. A first wave down may have ended at Thursday’s low. A second wave correction may move higher tomorrow to retest resistance at the aqua blue trend line. The target for this upwards movement to end tomorrow is at 1,951. The target may be met in one or two sessions; the pathway to get there may be choppy and overlapping.
To see an outline of the bigger picture on monthly and weekly charts click here.
Changes to last analysis are bold.
BULL ELLIOTT WAVE COUNT
DAILY CHART
Click chart to enlarge.
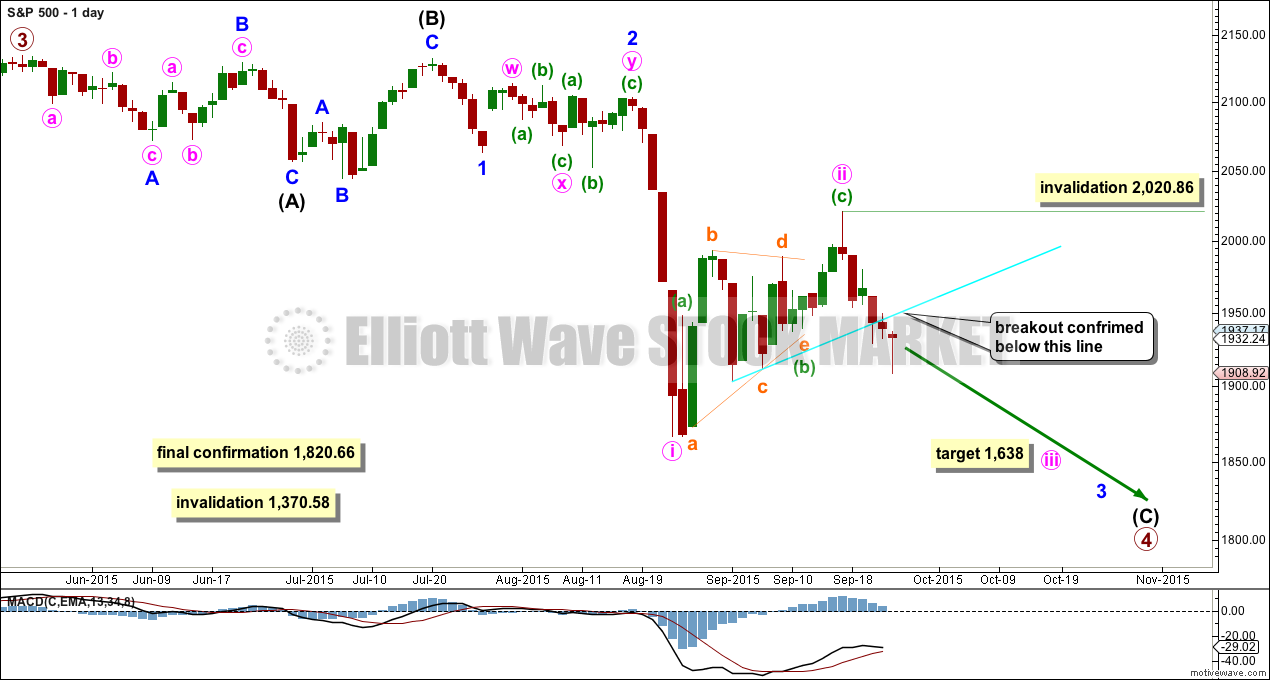
Primary wave 4 may be longer lasting than primary wave 2 as these types of sideways corrective structures tend to be more time consuming than zigzags. Primary wave 4 may complete in a total Fibonacci 21 weeks. Primary wave 4 is in its 18th week, but it may not exhibit a Fibonacci duration because the S&P does not reliably do this. Time estimates may only be taken as a very rough guide.
Within primary wave 4, it may be that intermediate waves (A) and (B) are both complete as three wave structures indicating a flat may be unfolding. Intermediate wave (C) down must be a five wave structure; it looks like it is unfolding as an impulse. For now I will leave this degree as is, but depending on where intermediate wave (C) ends I may move it back down one degree. It is also possible that only minor wave A may be unfolding as a flat correction.
At the daily chart level, this wave count sees primary wave 4 as a possible regular flat correction: intermediate wave (B) is a 98% correction of intermediate wave (A). However, regular flats normally have C waves which are close to equality with their A waves, and they normally fit nicely within parallel channels. Here intermediate wave (C) is much longer than (A) and will still move lower as its structure is incomplete. When the five wave impulse down for intermediate wave (C) is complete, then I will revisit the structure of primary wave 4 which may not be a flat. The structure at the daily chart level so far fits for the very bearish wave count better than this wave count.
If this impulse does not bring price down to the lower edge of the big channel on the weekly chart, then it may only be intermediate wave (A) of a bigger flat for primary wave 4.
Full and final confirmation of a bear market (mid term) would come with:
1. A clear five down on the daily chart.
2. A new low below 1,820.66.
As each condition is met further confidence may be had in the bigger picture for this wave count.
Primary wave 4 may not move into primary wave 1 price territory below 1,370.58. Invalidation of this bull wave count (still bullish at cycle degree) would be confirmation of the bear wave count.
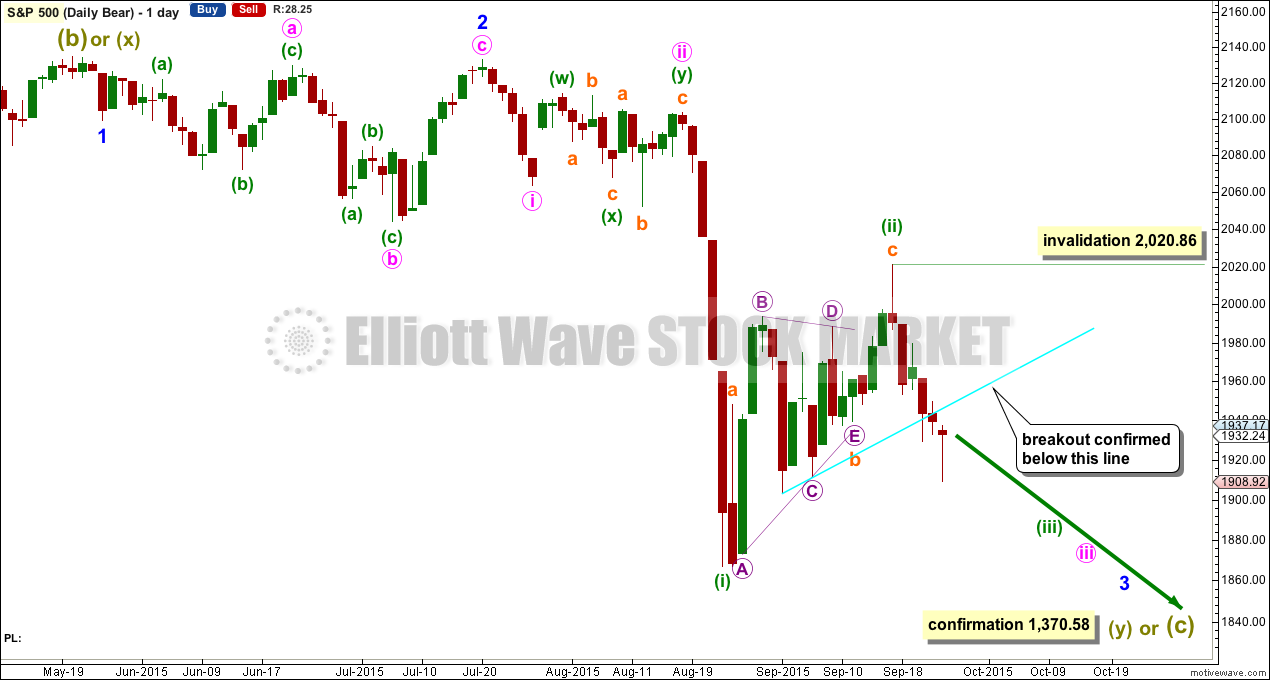
I am drawing the bright aqua blue trend line on all charts in exactly the same way. It is this line which I want to use to confirm the end of this correction and the resumption of the downwards trend. There is now a full daily candlestick below this trend line and not touching it, with a downwards day on slightly higher volume. This is enough to provide some confidence in a downwards breakout, so the invalidation point may now be moved lower.
Within the next wave down, whether it be a third wave or a fifth wave (as per the alternate daily wave count), no second wave correction may move beyond its start above 2,020.86.
The Dead Cat Bounce which may have ended six trading days ago still looks more like a second wave than a fourth wave.
At 1,638 minute wave iii would reach 1.618 the length of minute wave i.
Every day I look at the structure from the all time high on this daily chart to see if I can see a complete corrective structure for primary wave 4. Today I can see a possible end to this correction. This is published at the end of this analysis. However, it has an extremely low probability.
HOURLY CHART
Click chart to enlarge.
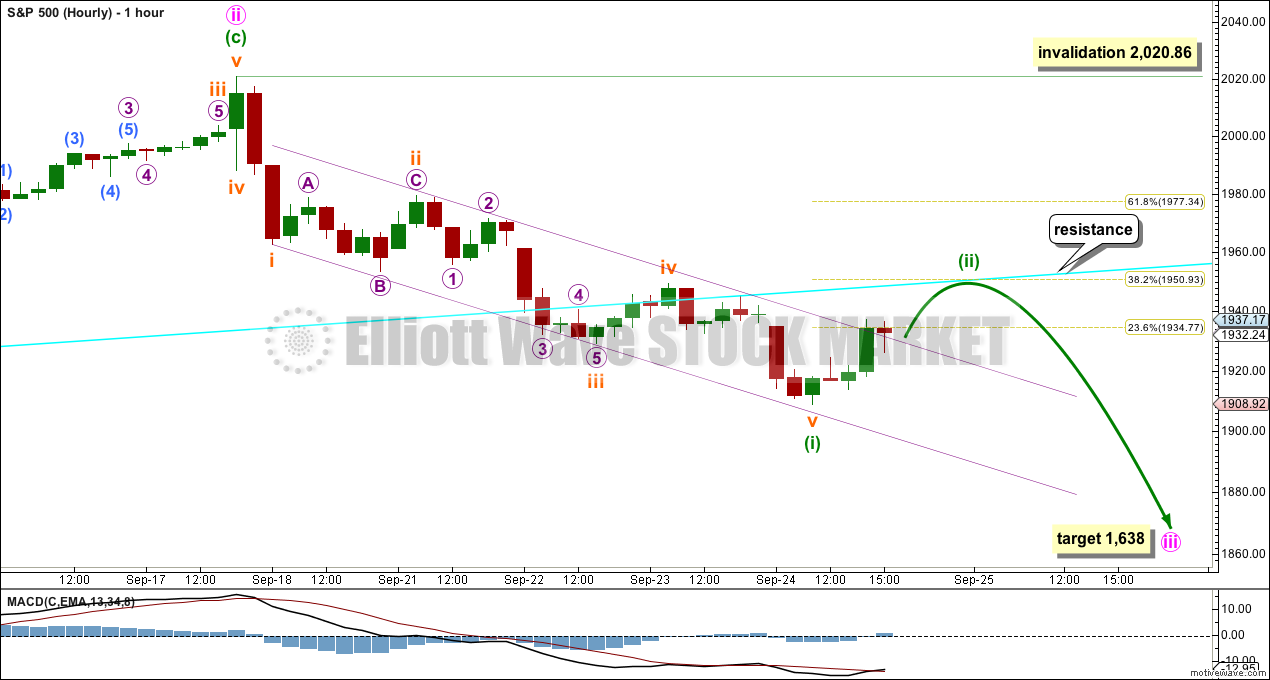
This hourly chart will suffice today for both the main wave count and the alternate below. For the alternate everything is just moved up one degree.
It is possible now to see a complete five wave structure downwards. This may be a first wave complete.
There are no adequate Fibonacci ratios between subminuette waves i, iii and v within minuette wave (i). This is not entirely unusual for the S&P500 though.
There is alternation between the shallow 0.29 expanded flat of subminuette wave ii and the deeper 0.4 zigzag of subminuette wave iv.
I have checked the subdivisions of subminuette wave v on the five and one minute charts. It subdivides as a five, with a disproportionate second and fourth wave correction which is what gives this wave a three wave look at a higher time frame.
The channel is drawn using Elliott’s first technique: draw the first trend line from the ends of subminuette waves i to iii, then place a parallel copy on the end of subminuette wave ii. The channel contains the whole of minuette wave (i). Minuette wave (ii) should break out of this channel. Minuette wave (ii) may find resistance about the aqua blue trend line. This would see it a shallow correction ending about the 0.382 Fibonacci ratio at 1,951.
Minuette wave (ii) is likely to show up on the daily chart for this main wave count because for the S&P500 its third waves usually show their subdivisions clearly at higher time frames. Minuette wave (ii) may be over in one or two days.
Minuette wave (ii) may not move beyond the start of minuette wave (i) above 2,020.86.
ALTERNATE BULL ELLIOTT WAVE COUNT
DAILY CHART
Click chart to enlarge.
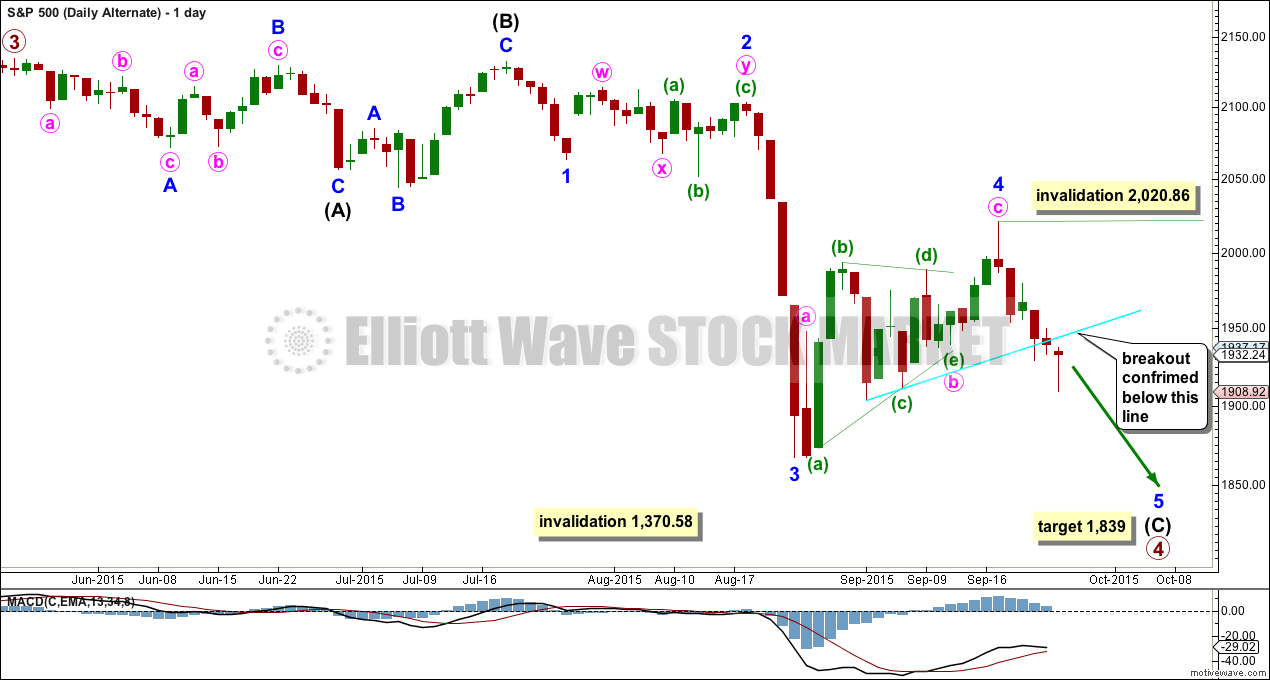
This alternate is changed from yesterday. Here the subdivisions of the waves are seen in exactly the same way as the main wave count, except the degree of labelling within the last wave down and the following Dead Cat Bounce are all moved up one degree.
Minor wave 2 was a deep 0.58 double combination and minor wave 4 was a deep 0.65 zigzag. There is little alternation in depth but adequate alternation in structure. Minor wave 2 lasted 15 days and minor wave 4 lasted 17 days. There is good proportion which gives the wave count the right look.
If the next wave down does not exhibit a strong increase in momentum, then this would be a good explanation.
At 1,839 minor wave 5 would reach 2.618 the length of minor wave 1.
The subdivisions on the hourly chart are exactly the same only moved up one degree. The short term outlook is exactly the same.
SECOND ALTERNATE BULL ELLIOTT WAVE COUNT
DAILY CHART
Click chart to enlarge.
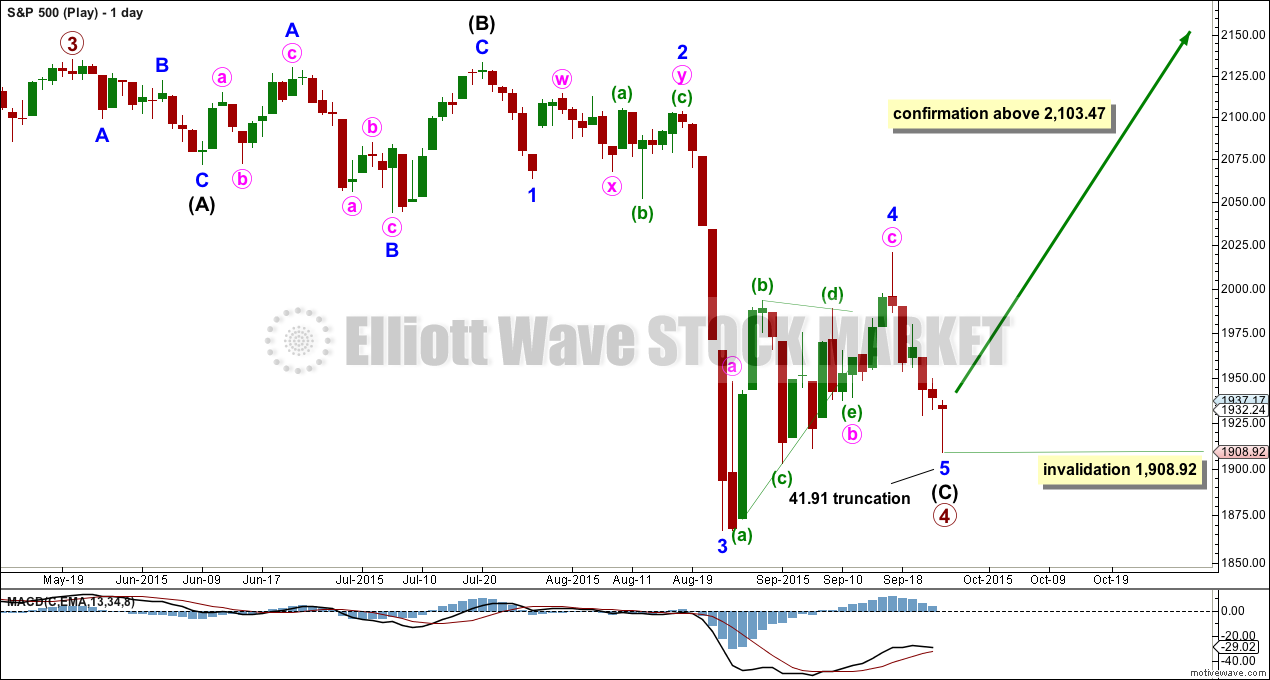
Every day I look to see if it is technically possible that downwards movement could be over. Today is the first time it is possible.
Primary wave 4 will now subdivide as a complete 3-3-5 flat correction. Intermediate wave (C) can technically be a complete impulse. However, minor wave 5 is severely truncated by 41.91 points. Although a truncation can come after a movement which moves “too far too fast”, and that certainly could be an appropriate description of the downwards wave for minor wave 3, this truncation is huge.
The probability of this idea is exceptionally low. I will not take it at all seriously until price moves above 2,103.47. That would eliminate any possibility that sees the Dead Cat Bounce as a second wave correction.
BEAR ELLIOTT WAVE COUNT
DAILY CHART
Click chart to enlarge.
A big impulse down must begin, for this bear wave count, so a series of overlapping first and second waves should now be complete. The idea for the bull wave count (a flat correction unfolding downwards) does not work for this bear wave count.
A new low below 1,370.58 would invalidate the bull wave count confirming a huge market crash. Before that price point is passed though, structure should be a strong indication that this bear wave count would be correct. It is supported by regular technical analysis at the monthly chart level.
TECHNICAL ANALYSIS
DAILY CHART
Click chart to enlarge. Chart courtesy of StockCharts.com.
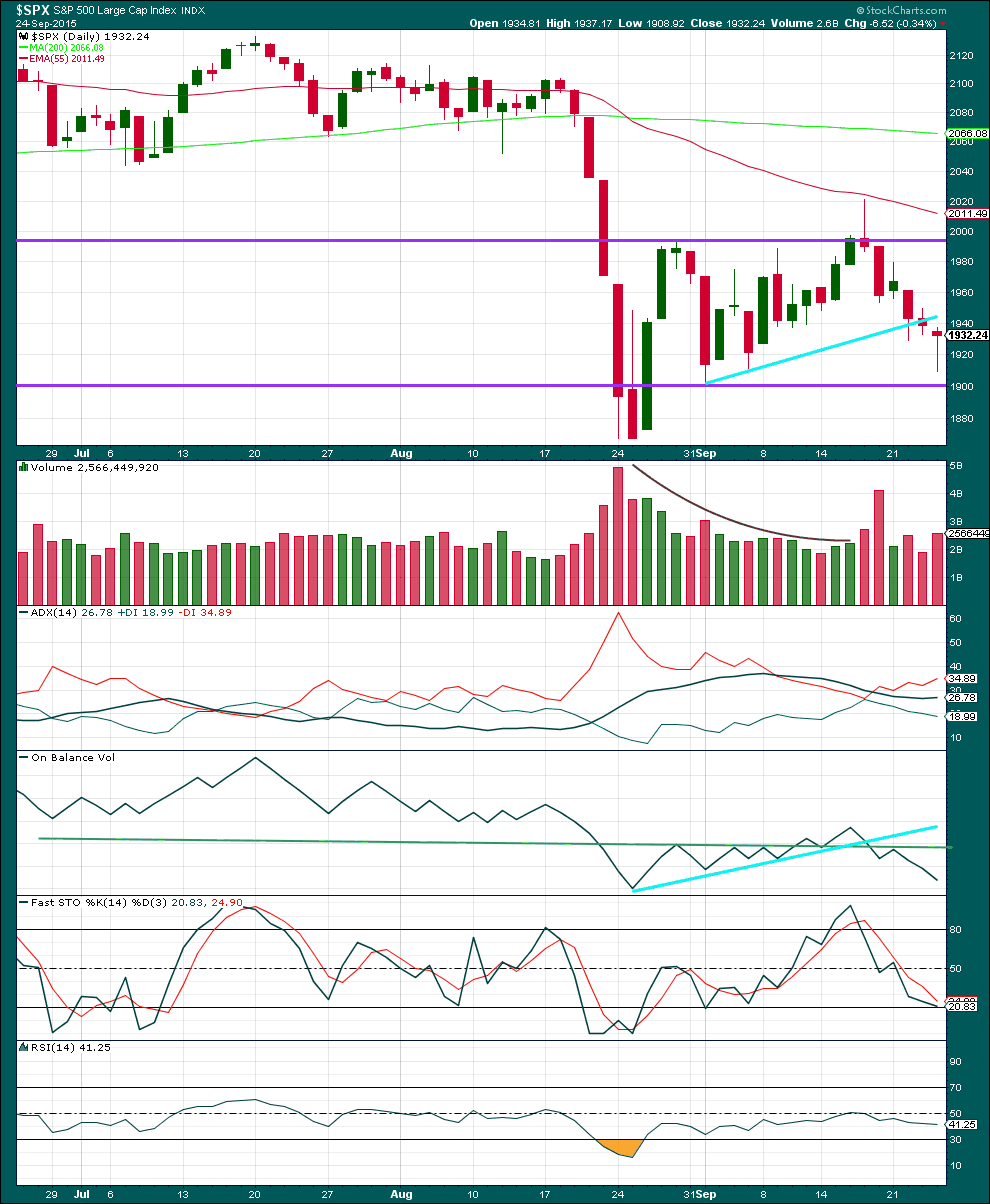
Daily: Price has now broken below the aqua blue line which previously provided some support. Today price found strong support about the lower horizontal trend line. Today’s downwards day comes with a small increase in volume; there was some support for the fall in price.
Kaufman’s Moving Average has provided resistance to upwards movement.
ADX is now very slightly turning up. With the red -DX line above the green +DX line, ADX is now indicating the market is beginning again to trend and the trend is down.
What is clearest from volume is the strongest volume during the Dead Cat Bounce (this includes all movement within the horizontal trend lines) is for a downwards day. This indicates that the breakout would most likely be down.
While I am using the sloping aqua blue trend line as my line to indicate a breakout, depending upon your risk appetite you may prefer to use horizontal lines of support and resistance. If price breaks below the lower horizontal line of support, and if this comes on a day with increased volume, then I would have full and final confidence that price is breaking out downwards.
The green trend line on On Balance Volume is very shallow, repeatedly tested, and reasonably technically significant. The trend line has shown perfectly when price would stop upwards movement, and it ended when OBV again touched that trend line. Resistance at that trend line is reinforced.
Both Stochastics and RSI are neither overbought or oversold. There is room for the market to fall or rise.
A note on Dow Theory: for the bear wave count I would wait for Dow Theory to confirm a huge market crash. So far the industrials and the transportation indices have made new major swing lows, but the S&P500 and Nasdaq have not.
S&P500: 1,820.66
Nasdaq: 4,116.60
DJT: 7,700.49 – this price point was breached.
DJIA: 15,855.12 – this price point was breached.
This analysis is published about 10:19 p.m. EST.
Folks, keep your eye on the ball. To use Lara’s oft repeated phrase, the trend is down until proven otherwise. Today’s action is an outstanding example of why traders so often loose money- we let our emotions get the best of us. Considering the plethora of information we have about this market, today’s head-fake is probably nothing more than a classic bull trap, thanks to the conniving banksters. Don’t fall for it. Smart traders are shorting the you-know-what out of this pop.
I totally agree. Market gaps up with no momentum during regular trading hours. Interesting is the Shanghai composite not moving up with other asian markets.
Agreed. Resistance again right at that blue trend line. A 0.382 retracement.
It looks like that was it, over during Friday.
1951 does not seem far away with futures up this morning. If this breaks what would be the next target?
Lara’s 1951 is very close to the 20 day SMA currently at 1954. Above that is the upper bollinger band at 1999, the 50 day SMA at 2023, and 100 day SMA at 2061. Levels all at real time. The most likely resistance would be the upper bollinger band which was nearly touched at the Sept 17th upward correction, and lower band tested yesterday; and bounced back… just my 2 cents
I think an interesting area for any second wave re-trace would be around 1967 ish.
This would be close to the 0.5 fib level and also close the gap in the chart prior to any further downward movement.
Lara, can you elaborate a little more on why it is possible that downward movement may have ended? Is it because there was a five structure from 1920 to today’s low of 1908?
Yes, technically the last wave down (to the low today) will subdivide as a complete five.
And so it is just an outside possibility that the correction could be over if it’s primary wave 4.
But the probability is very low indeed. I have close to no confidence in that idea.
Lara, with today’s move potentially starting a correction, and with quarter end coming up in just a few days, I would not be surprised to see this correction last up to 5 days to get the market through 9/30 to keep from looking too terribly bad for the quarter. If Minuette and Minute iii get rolling on the downside, it will cause S&P to print a pretty ugly quarter….but, that may be what keeps things rolling down hill in October to get to 1638.
We shall see – no positions right now. Had a few positive trades this week on the S&P, I will be patient on another set up.
Best,
B
I would be quite surprised to see this second wave last that long.
I think we may have it over during Friday at the high for that day.
And I think the bright blue trend line providing resistance again offers potentially a great set up.
When lines provide support / resistance, are broken, and then price throws back to the line it offers a great opportunity to join a trend. This is one of my favourite entry techniques, partly because the stop can be set quite close just beyond support / resistance and so the risk can be quite low.
In this case the reward is huge. So the risk / reward ratio looks very attractive indeed.