
Upwards movement continued.
Yesterday’s second wave count expected a little upwards movement, but the target at 2,003 was inadequate.
Summary: The Dead Cat Bounce is either a fourth wave correction (from yesterday’s wave count) or a second wave correction (a new wave count today). Either way it is most likely a zigzag and most likely complete. A break below the upwards sloping bright aqua blue trend line is required to confirm that it is over.
To see an outline of the bigger picture on monthly and weekly charts click here.
To see a video explanation of the wave count at weekly and daily chart levels click here.
Changes to last analysis are bold.
BULL ELLIOTT WAVE COUNT
DAILY CHART
Click chart to enlarge.
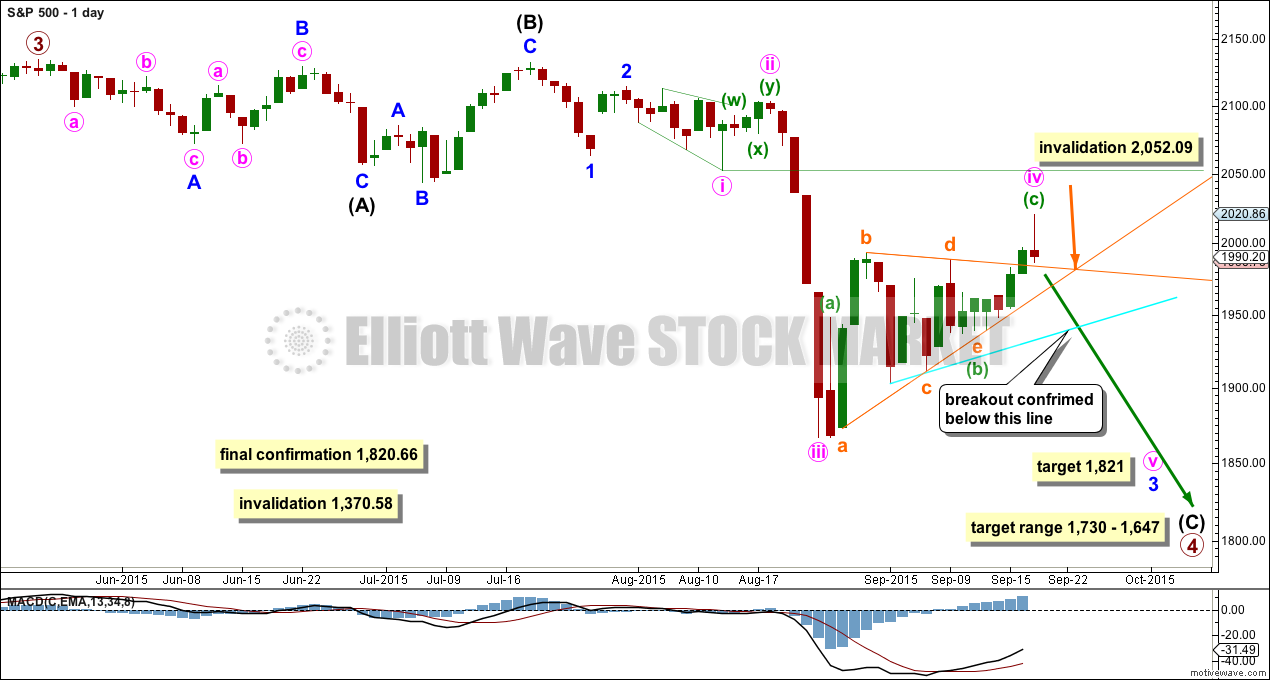
Primary wave 4 may be longer lasting than primary wave 2 as these types of sideways corrective structures tend to be more time consuming than zigzags. Primary wave 4 may complete in a total Fibonacci 21 weeks. Primary wave 4 is in its 17th week, but it may not exhibit a Fibonacci duration because the S&P does not reliably do this. Time estimates may only be taken as a very rough guide.
Within primary wave 4, it may be that intermediate waves (A) and (B) are both complete as three wave structures indicating a flat may be unfolding. Intermediate wave (C) down must be a five wave structure; it looks like it is unfolding as an impulse. For now I will leave this degree as is, but depending on where intermediate wave (C) ends I may move it back down one degree. It is also possible that only minor wave A may be unfolding as a flat correction.
At the daily chart level, this wave count sees primary wave 4 as a possible regular flat correction: intermediate wave (B) is a 98% correction of intermediate wave (A). However, regular flats normally have C waves which are close to equality with their A waves, and they normally fit nicely within parallel channels. Here intermediate wave (C) is much longer than (A) and will still move lower as its structure is incomplete. When the five wave impulse down for intermediate wave (C) is complete, then I will revisit the structure of primary wave 4 which may not be a flat. The structure at the daily chart level so far fits for the very bearish wave count better than this wave count.
If this impulse does not bring price down to the target range or the lower edge of the big channel on the weekly chart, then it may only be intermediate wave (A) of a bigger flat for primary wave 4. If it does bring price lower to the target range, then it may be primary wave 4 in its entirety.
Full and final confirmation of a bear market (mid term) would come with:
1. A clear five down on the daily chart.
2. A new low below 1,820.66.
As each condition is met further confidence may be had in the bigger picture for this wave count.
Primary wave 4 may not move into primary wave 1 price territory below 1,370.58. Invalidation of this bull wave count (still bullish at cycle degree) would be confirmation of the bear wave count.
I am drawing the bright aqua blue trend line on all charts in exactly the same way. It is this line which I want to use to confirm the end of this correction and the resumption of the downwards trend. When there is a break below this line, and if it comes with higher volume, then I would have some confidence that the trend has resumed.
There was a triangle within this correction, and I expect it was as labelled here. Extend the triangle trend lines outwards. The point in time at which they cross over may see a trend change. This does not always work, but it works often enough to be a trick to look out for.
I have a new alternate wave count today which sees this current correction as a second wave.
FIRST HOURLY ELLIOTT WAVE COUNT
Click chart to enlarge.
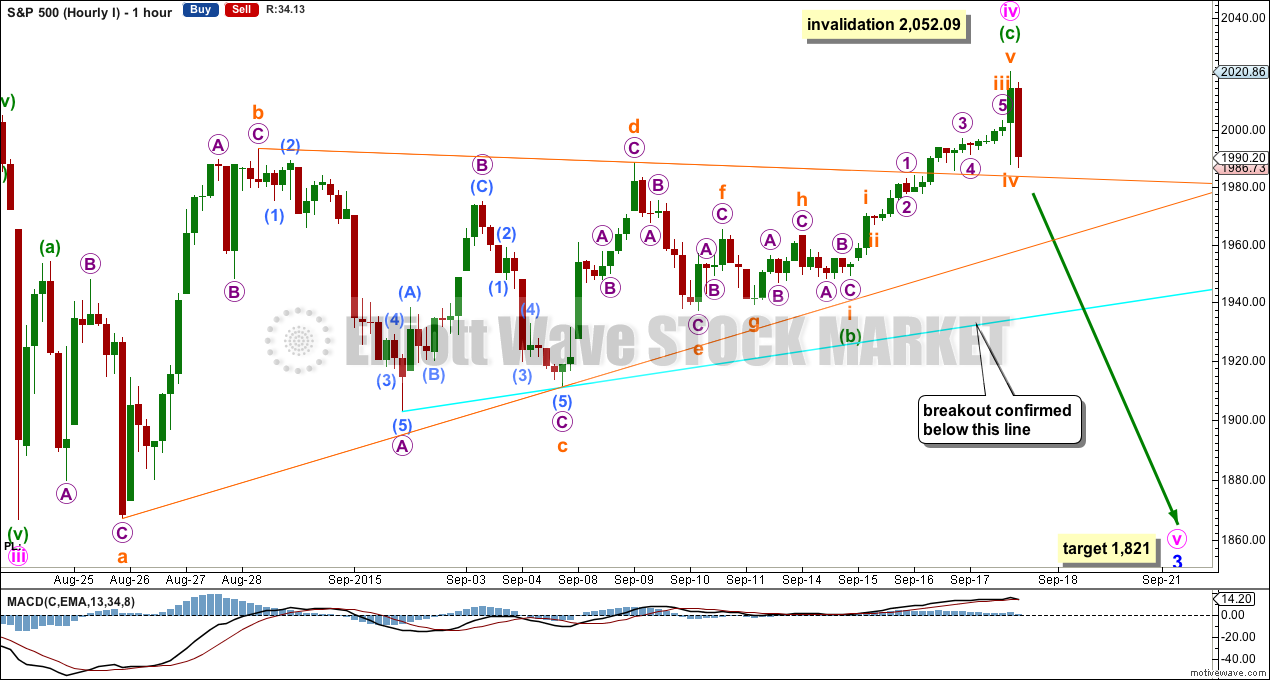
Today I am swapping the two wave counts around. At this stage, I would judge this first idea to have a higher probability.
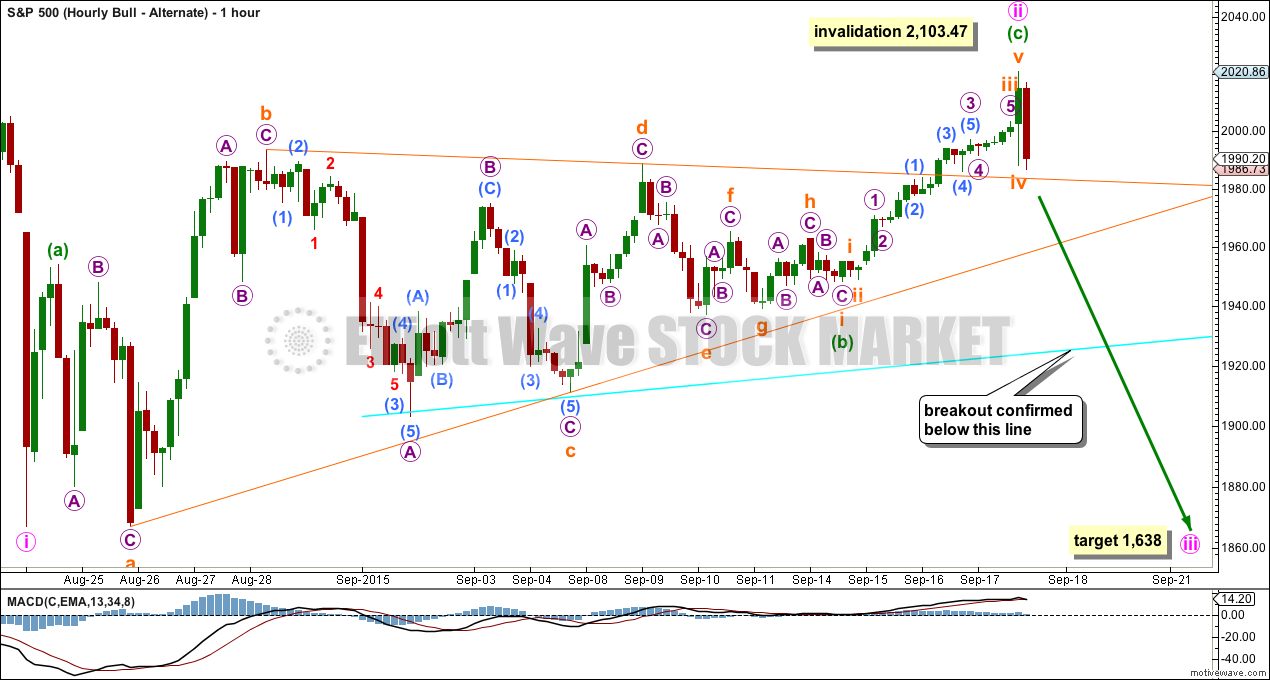
What if minute wave iv is not exhibiting good alternation with minute wave ii? Alternation is a guideline, not a rule, and is almost always seen to one degree or another and should be expected. However, it is not clear or perfect so all possibilities should be considered.
Minute wave iv may a complete single zigzag. There would be inadequate alternation with the double zigzag of minute wave ii which reduces the probability of this wave count.
Minute wave iv is deep at 0.65 of minute wave iii, but not as deep as the 0.83 of minute wave ii. Again, there would be some alternation, but it would be inadequate.
If minute wave iv is a zigzag, then the triangle may have been minuette wave (b). It may have been a nine wave triangle. The subdivisions all fit perfectly and are all well contained within the triangle trend lines. This part of the wave count has the best overall look which is why I am considering it.
There is no Fibonacci ratio between minuette waves (a) and (c).
At 1,821 minor wave 3 would reach 4.236 the length of minor wave 1.
SECOND HOURLY ELLIOTT WAVE COUNT
Click chart to enlarge.
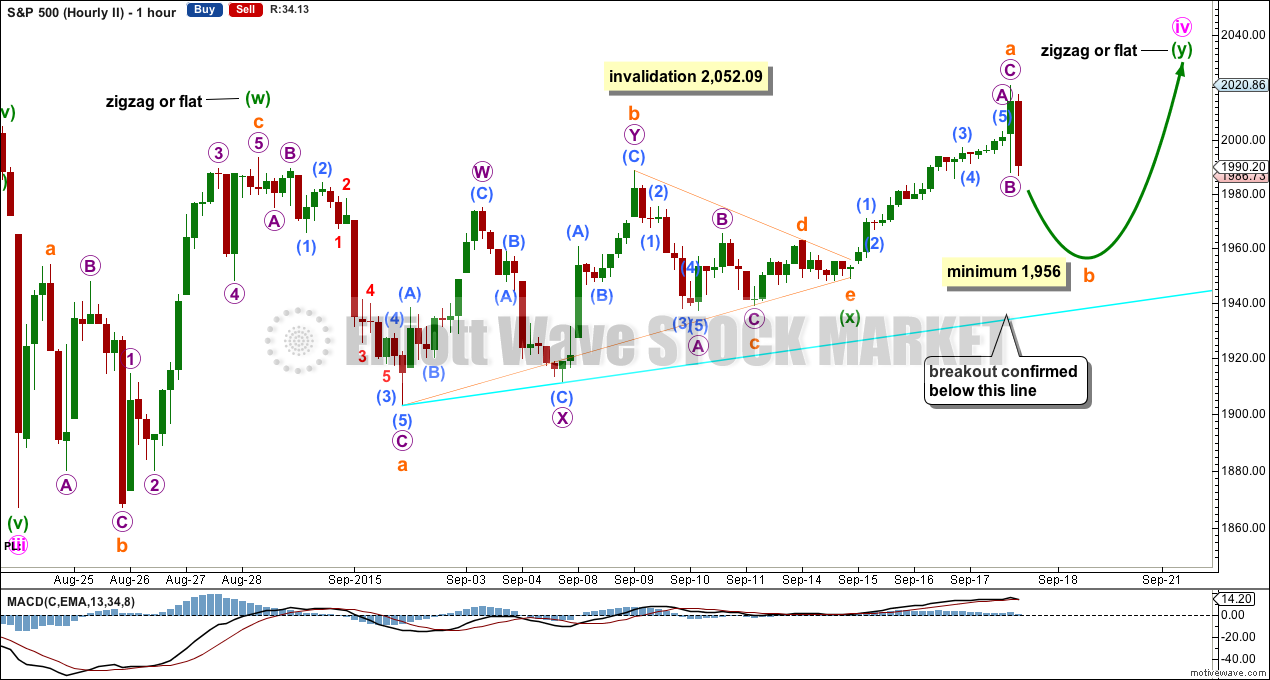
This idea now has a lower probability. The purpose of combinations is to move price sideways, so they should have a sideways look and not a clear slope. This correction now has a clear upwards slope and does not look like a combination.
There was a triangle in recent sideways movement. The question is: what degree and what wave should it be labelled? All possibilities should be considered, even those which look unlikely.
Minute wave ii was a deep 0.83 double zigzag. Given the guideline of alternation minute wave iv may be expected to be more shallow and most likely a flat, combination or triangle.
Here minute wave iv may be seen as a double flat or combination.
The first structure in the double may be seen either as a flat or zigzag, but it looks more like a zigzag. This means the second structure in the double is most likely to be a flat correction for a double combination.
Within a possible flat for minuette wave (y), subminuette wave a must subdivide as a three and subminuette wave b must retrace a minimum 90% of subminuette wave a. Subminuette wave b must move to 1,956 or below.
Subminuette wave b may make a new low below the start of subminuette wave a at 1,949.13 as in an expanded flat, and so for this reason there is no lower price point which would confirm that the whole correction for minute wave iv is finally over.
Minute wave iv may not move into minute wave i price territory above 2,052.09.
ALTERNATE BULL ELLIOTT WAVE COUNT
DAILY CHART
Click chart to enlarge.
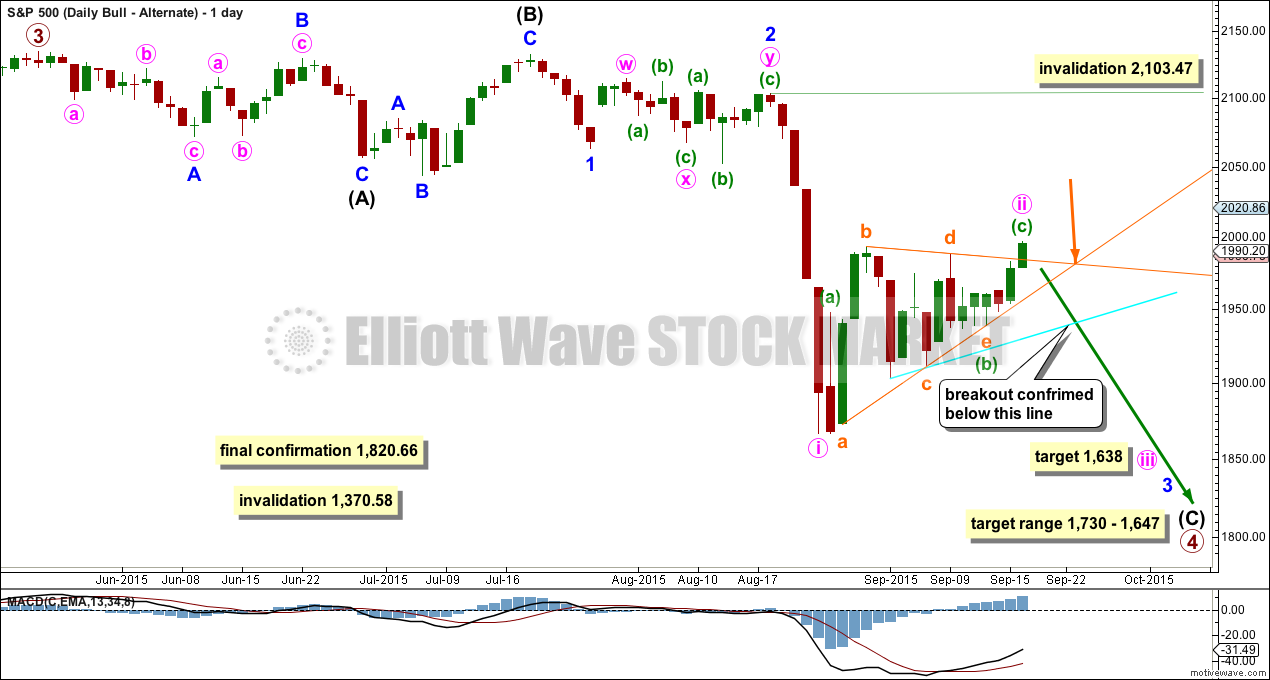
I have been concerned with the duration of this current correction. If minor wave 2 is seen as labelled here though, the problem is resolved.
Minor wave 2 may have been longer lasting, and may have unfolded as a combination: zigzag – x – flat. The second structure in the double combination is a rare running flat, and for this reason I had not considered this idea previously due to the low probability of any wave count which includes a running flat.
I will consider it now due to the time taken for the current correction and the structure which looks to be unfolding.
Minor wave 2 may have ended with a running flat due to the strong downwards pull of the start of a big third wave. This is the kind of situation in which a running flat may appear.
Minor wave 2 may have lasted 15 days. Minute wave ii now one degree lower may have lasted 18 days. The difference in proportion is acceptable.
HOURLY CHART
Click chart to enlarge.
Now the correction makes sense as a deep zigzag. Minute wave ii may be complete as a 0.65 correction of minute wave i. At 1,638 minute wave iii would reach 1.618 the length of minute wave i.
The subdivisions here are seen in exactly the same way as the subdivisions for the first wave count above.
If the next wave down exhibits an increase in momentum beyond the last wave labelled minute wave i, then this wave count would be confirmed.
The important implication today from this idea is that not only is the breakout expected to be down, but it may be very strong indeed.
BEAR ELLIOTT WAVE COUNT
DAILY CHART
Click chart to enlarge.
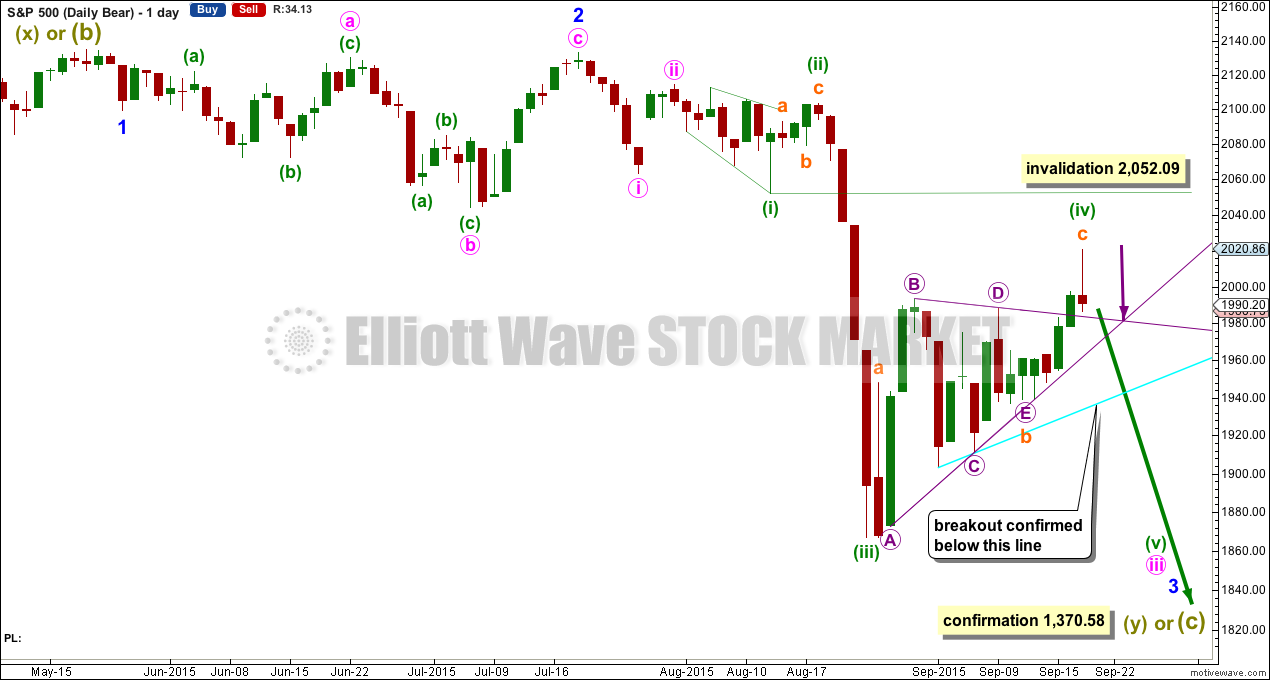
A big impulse down must begin, for this bear wave count, so a series of overlapping first and second waves should now be complete. The idea for the bull wave count does not work for this bear wave count.
A new low below 1,370.58 would invalidate the bull wave count confirming a huge market crash. Before that price point is passed though, structure should be a strong indication that this bear wave count would be correct. It is supported by regular technical analysis at the monthly chart level.
TECHNICAL ANALYSIS
DAILY CHART
Click chart to enlarge. Chart courtesy of StockCharts.com.
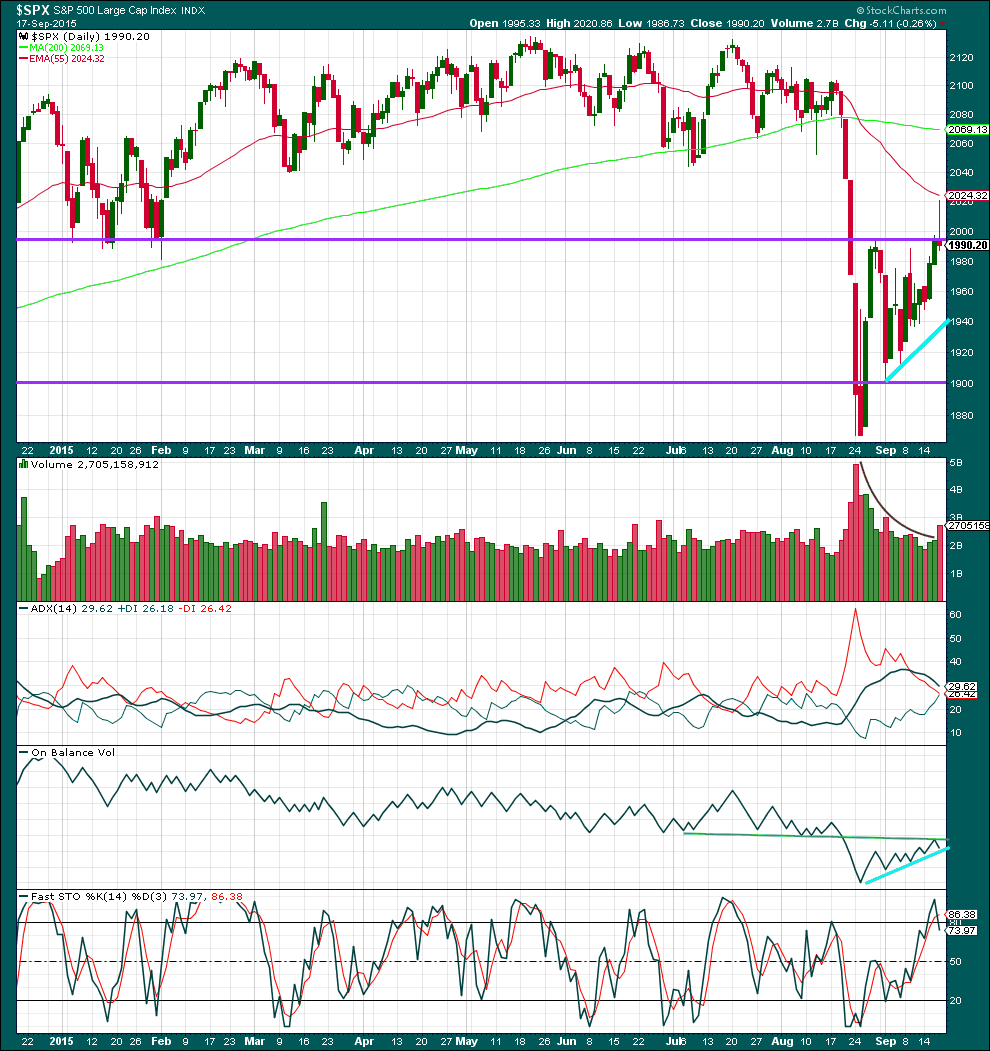
Daily: Today’s candlestick has a small red body with a long upper wick. This long upper wick is bearish. The bulls pushed price higher, but were unable to maintain it at the day’s highs. The bears were strong enough to push price back close to the day’s lows and they did it on a reasonable increase in volume.
Kaufmans Moving Average has provided resistance to today’s upwards movement.
ADX is flat indicating the market is not currently trending. ADX does tend to be a lagging indicator.
I have removed the purple line on On Balance Volume because it was breached. The green line is more technically significant because it is more shallow, longer held and tested more often. OBV has again found resistance at that line. This may be an indication that upwards movement is over. A break below the shorter held bright aqua blue line on OBV would be further bearishness. OBV is still being squashed between the green line and the upwards bright blue line. The breakout should come very soon.
Price has overshot the upper horizontal line of resistance, and quickly returned below it. If price now remains below this line and moves lower, then resistance may be expected to remain there. If price again breaks above that trend line, then the wave count would be in doubt and that would be a reasonably bullish signal. The next 24 hours will be crucial for the Elliott wave count.
Today I am adding Stochastics. It shows overbought which indicates that if the market is range bound (and ADX says it is) a downwards swing should be expected to begin here or very soon.
A note on Dow Theory: for the bear wave count I would wait for Dow Theory to confirm a huge market crash. So far the industrials and the transportation indices have made new major swing lows, but the S&P500 and Nasdaq have not.
S&P500: 1,820.66
Nasdaq: 4,116.60
DJT: 7,700.49 – this price point was breached.
DJIA: 15,855.12 – this price point was breached.
This analysis is published about 09:57 p.m. EST.
I can clearly see 5 waves down in the hourly chart from yesterday´s high to today’s market close, so the odds of a high just reached in this corrective rally are greater now. This action could be wave 1 of the next down leg. In order to be more certain, I would like to see a 3-wave rally next week, ideally (50%-61.8% retrace), and to NOT take out the top just made yesterday (that could be wave 2). And then, at least for me, odds to take action (i.e. to short the market) are therefore in my comfort zone. Otherwise, the market wanted to fool us and is going a bit higher. Time will tell, but as Lara has mentioned in her analysis, we would have many more reasons to believe that this corrective rally has ended.
These thrusts from triangles are notorious for their swift reversals and that is exactly what happened today. The second wave count has my vote. If it is right, it will make a bee-line for the aqua trend line early tomorrow and not look back…
By the second I presume you mean the new alternate? And not the second hourly count which expects the correction to continue for a few days yet.
Indeed. Sorry about the ambiguity. I really like your analysis showing a C wave up to complete a second wave as it was a perfect conclusion to the triangle which so often occurs just prior to the final wave. I had been thinking about that possibility for a few days now and I was quite confident that you might eventually suggest it. Your thoroughness never ceases to amaze Lara. From action today looks like you were right on the money and very timely too. Thanks for the great analysis!
You’re welcome.
Triangles are horribly tricky structures. The tricky part is where do they start and where do they end.
I’m looking at this big move down so far today and yes, it looks like that’s it for the DCB.