
Sideways movement continued as expected for the first preferred Elliott wave count.
Summary: So far it looks like the correction may now be a complete fourth wave triangle. If the triangle fails, then I have a second hourly chart which expects sideways movement for another several days. What is most likely is the downwards trend will resume Monday / Tuesday to a target at 1,815.
It is time to step back and look at the bigger picture on monthly and weekly charts.
Changes to last analysis are bold.
BULL ELLIOTT WAVE COUNT
MONTHLY CHART
Click chart to enlarge.
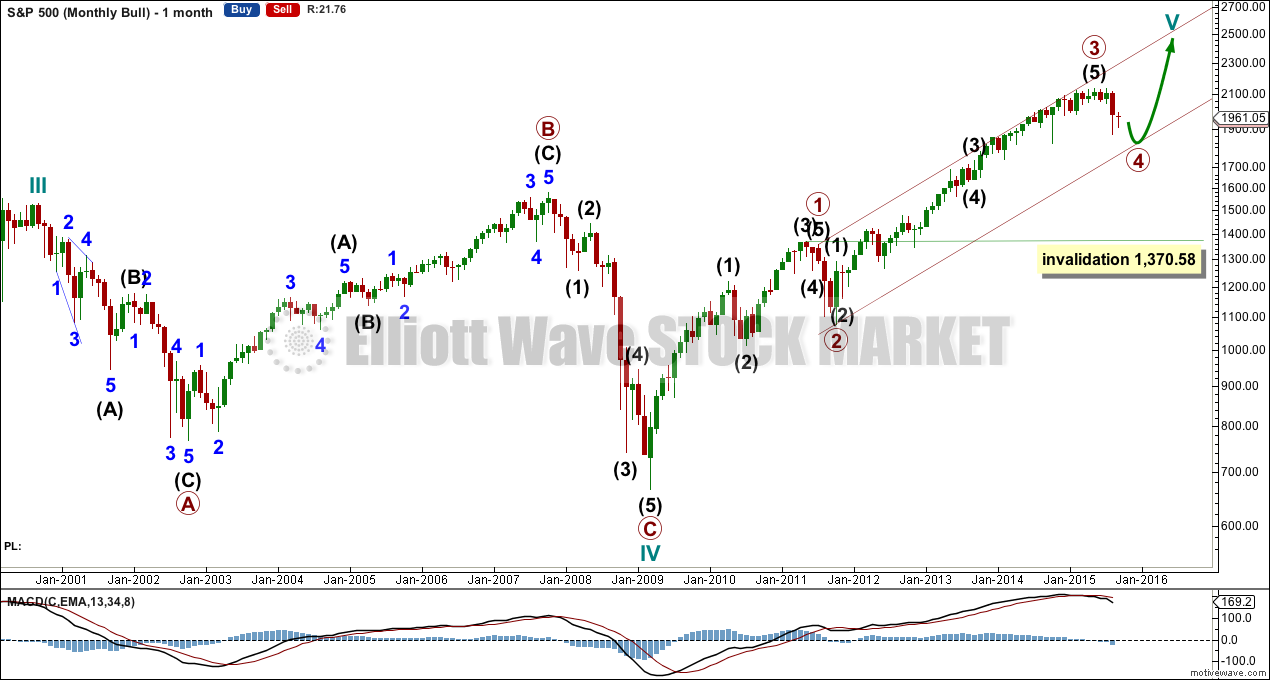
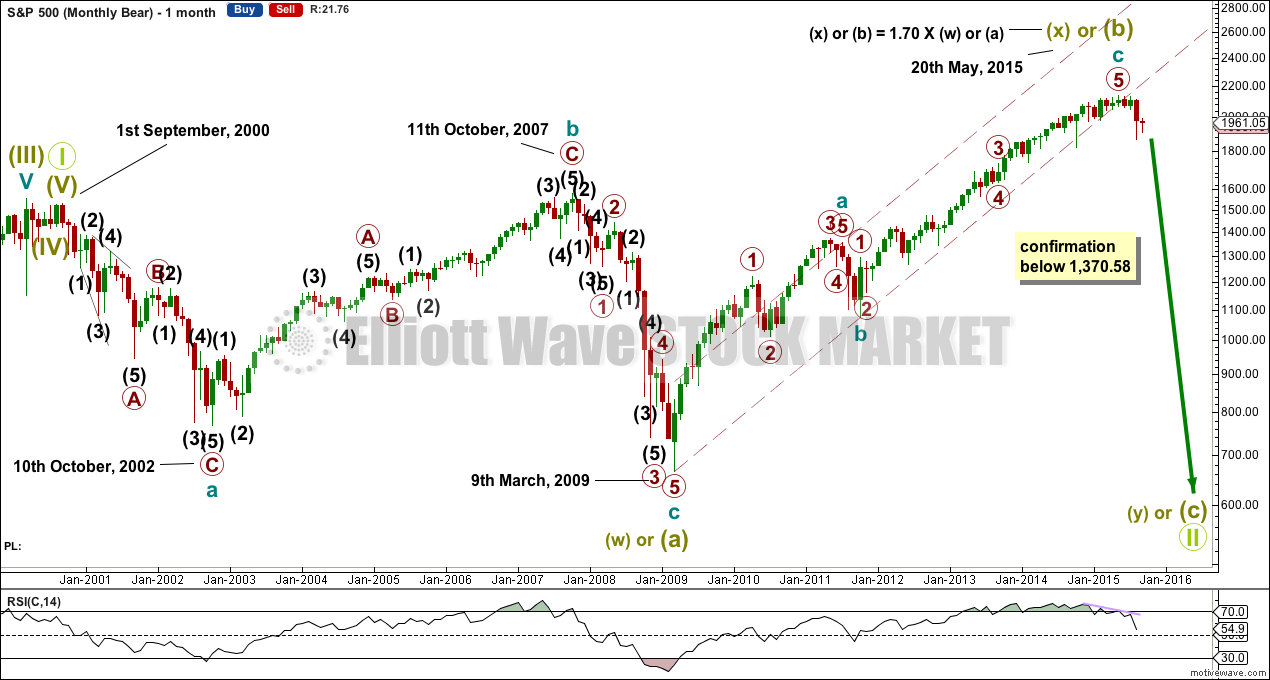
This wave count is bullish at cycle degree.
The two big bear markets of 2000 – 2002 and 2007 – 2009 may have been waves A and C within a large flat correction for a cycle wave IV. The bull market since 2009 may be cycle wave V.
Primary waves 1, 2 and 3 are complete within cycle wave V. Primary wave 2 was a relatively shallow 0.41 zigzag lasting 12 weeks. Primary wave 3 is 55.97 points short of 1.618 the length of primary wave 1. This is a reasonable difference, but as it is less than 10% the length of primary wave 3 (it is 5.2%) I consider this an acceptable Fibonacci ratio.
Draw an Elliott channel about this bull market: draw the first trend line from the ends of primary waves 1 to 3, then place a parallel copy on the end of primary wave 2. Primary wave 4 may find support at the lower edge of this channel.
Primary wave 4 may not move into primary wave 1 price territory below 1,370.58. If this bull wave count is invalidated by downwards movement, then the bear wave count shall be fully confirmed.
Primary wave 3 shows an increase in upwards momentum beyond primary wave 1.
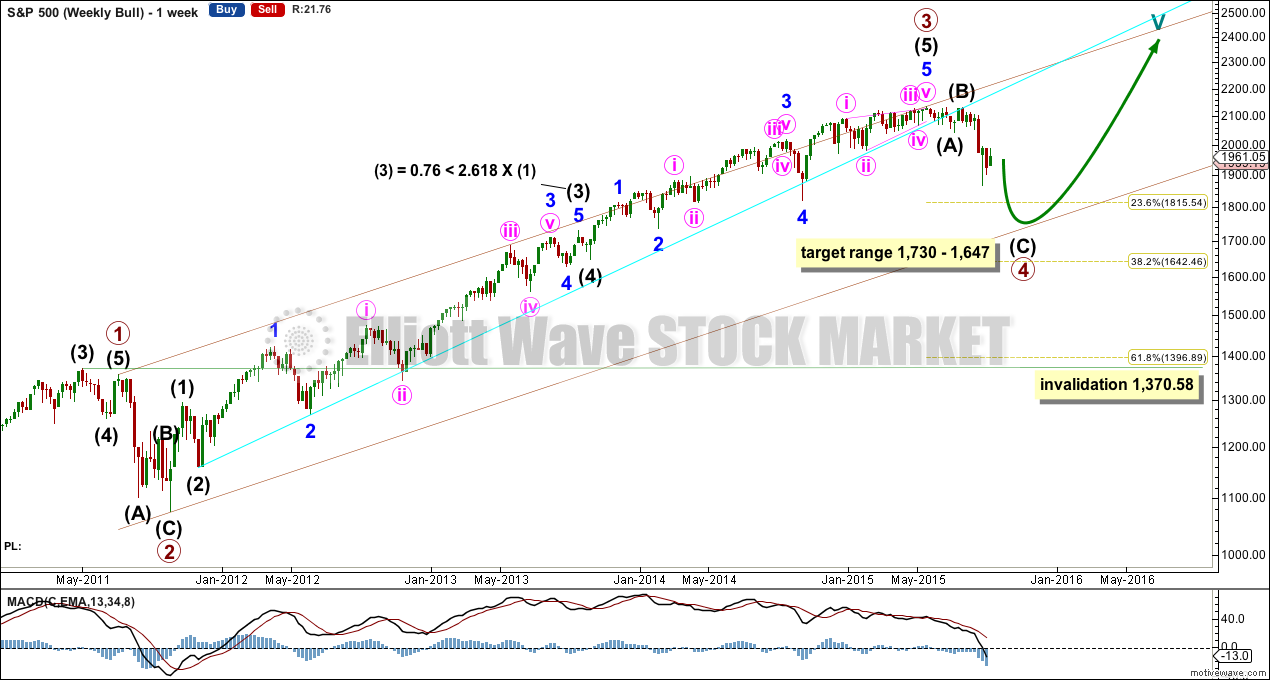
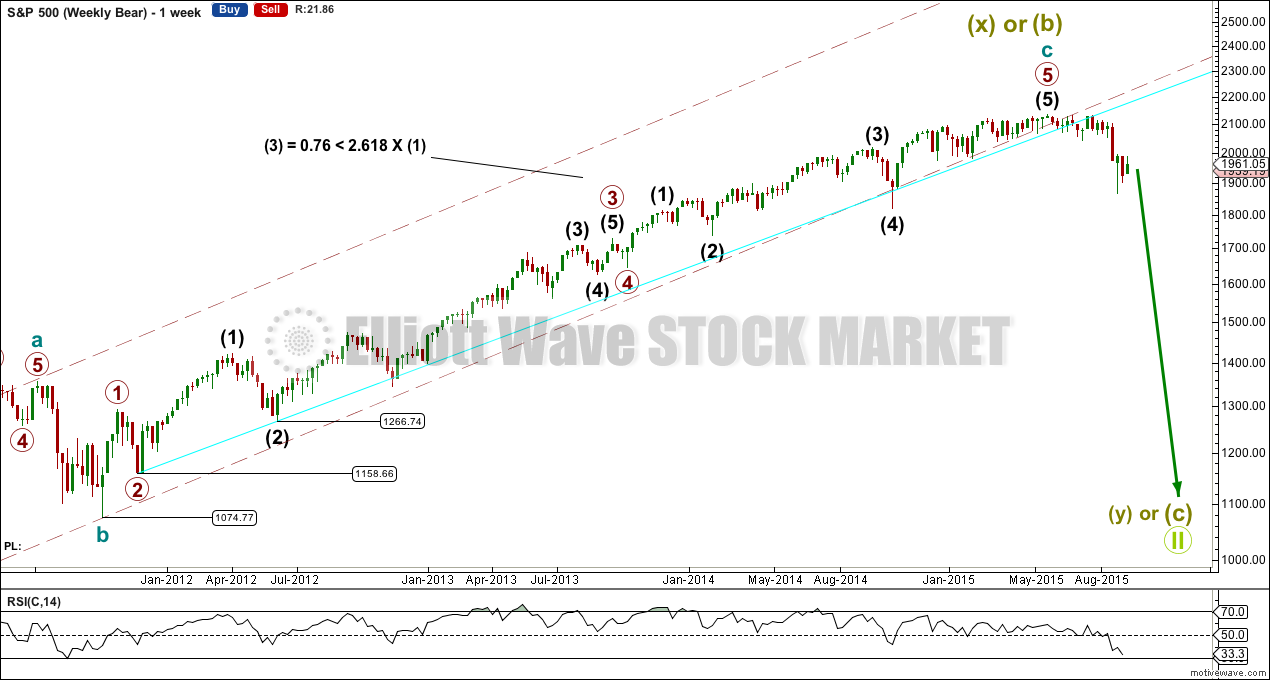
The weekly chart’s focus is on all of primary wave 3.
WEEKLY CHART
Click chart to enlarge.
Within primary wave 3, intermediate wave (3) is just 0.76 points less than 2.618 the length of intermediate wave (1). There is no Fibonacci ratio between intermediate wave (5) and either of (3) or (1).
Intermediate wave (3) subdivides perfectly as an impulse. Intermediate wave (5) ends with an ending contracting diagonal (the regular technical analysis equivalent is a rising wedge), which is a terminal structure.
Primary wave 4 should exhibit alternation to primary wave 2. Primary wave 4 is most likely to be more shallow (to find support at the maroon channel) and a flat, combination or triangle. So far it looks like it may be a flat.
Primary wave 4 is likely to end within the price range of the fourth wave of one lesser degree. Because of the good Fibonacci ratio for intermediate wave (3) and the perfect subdivisions within it, I am confident that intermediate wave (4) has its range from 1,730 to 1,647.
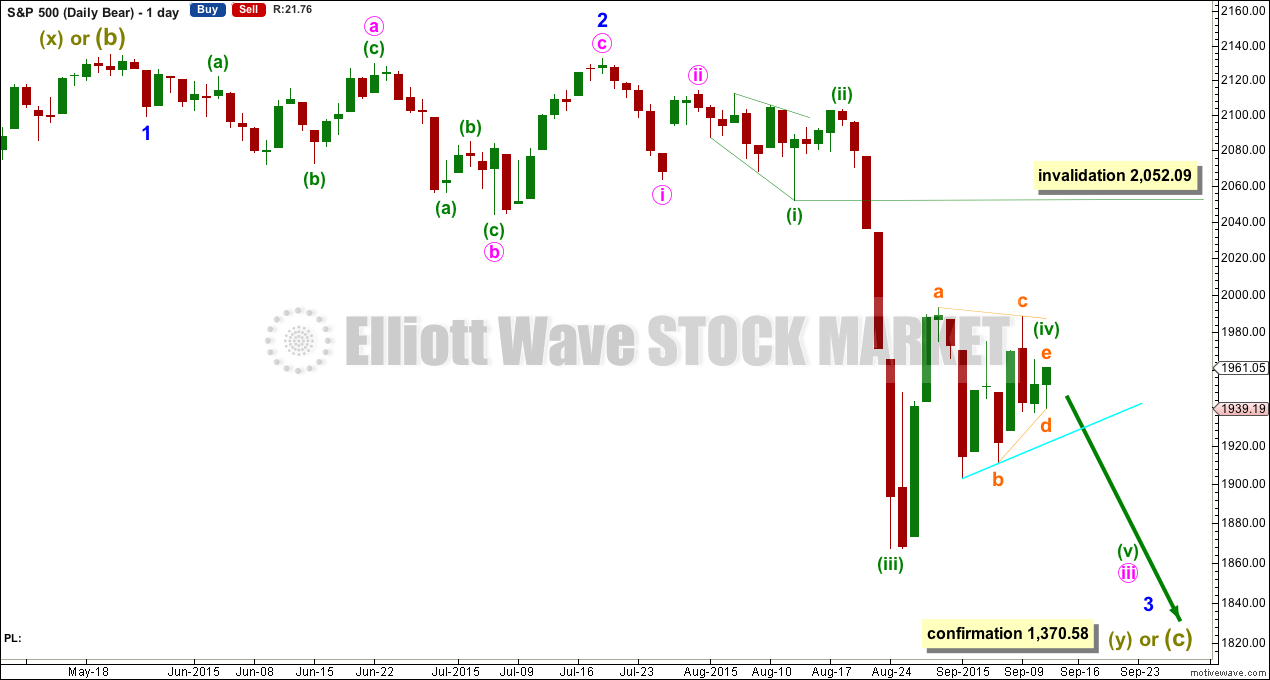
DAILY CHART
Click chart to enlarge.
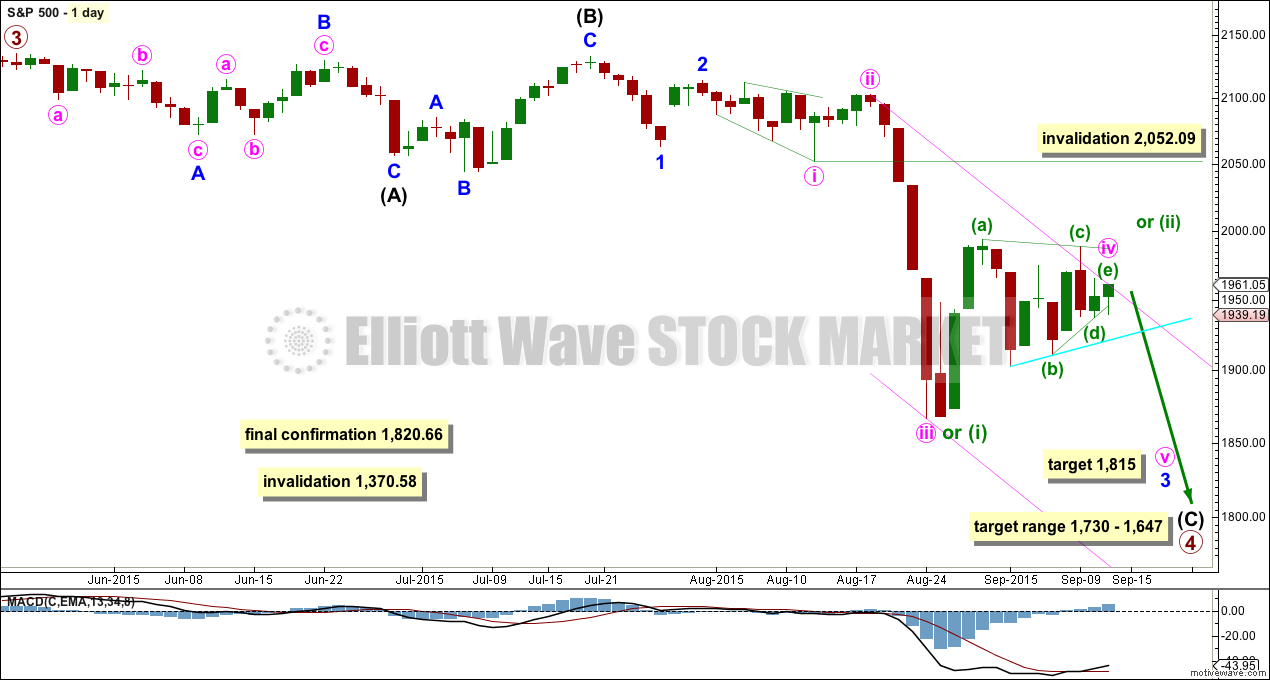
Primary wave 4 may longer lasting than primary wave 2 as these types of sideways corrective structures tend to be more time consuming than zigzags. Primary wave 4 may complete in a total Fibonacci 21 weeks. Primary wave 4 has completed its 16th week, but it may not exhibit a Fibonacci duration because the S&P does not reliably do this. Time estimates may only be taken as a very rough guide.
Within primary wave 4, it may be that intermediate waves (A) and (B) are both complete as three wave structures indicating a flat may be unfolding. Intermediate wave (C) down must be a five wave structure; it looks like it is unfolding as an impulse. For now I will leave this degree as is, but depending on where intermediate wave (C) ends I may move it back down one degree. It is also possible that only minor wave A may be unfolding as a flat correction.
At the daily chart level, this wave count sees primary wave 4 as a possible regular flat correction: intermediate wave (B) is a 98% correction of intermediate wave (A). However, regular flats normally have C waves which are close to equality with their A waves, and they normally fit nicely within parallel channels. Here intermediate wave (C) is much longer than (A) and will still move lower as its structure is incomplete. When the five wave impulse down for intermediate wave (C) is complete, then I will revisit the structure of primary wave 4 which may not be a flat. The structure at the daily chart level so far fits for the very bearish wave count better than this wave count.
If this impulse does not bring price down to the target range or the lower edge of the big channel on the weekly chart, then it may only be intermediate wave (A) of a bigger flat for primary wave 4. If it does bring price lower to the target range, then it may be primary wave 4 in its entirety.
Full and final confirmation of a bear market (mid term) would come with:
1. A clear five down on the daily chart.
2. A new low below 1,820.66.
As each condition is met further confidence may be had in the bigger picture for this wave count.
Primary wave 4 may not move into primary wave 1 price territory below 1,370.58. Invalidation of this bull wave count (still bullish at cycle degree) would be confirmation of the bear wave count.
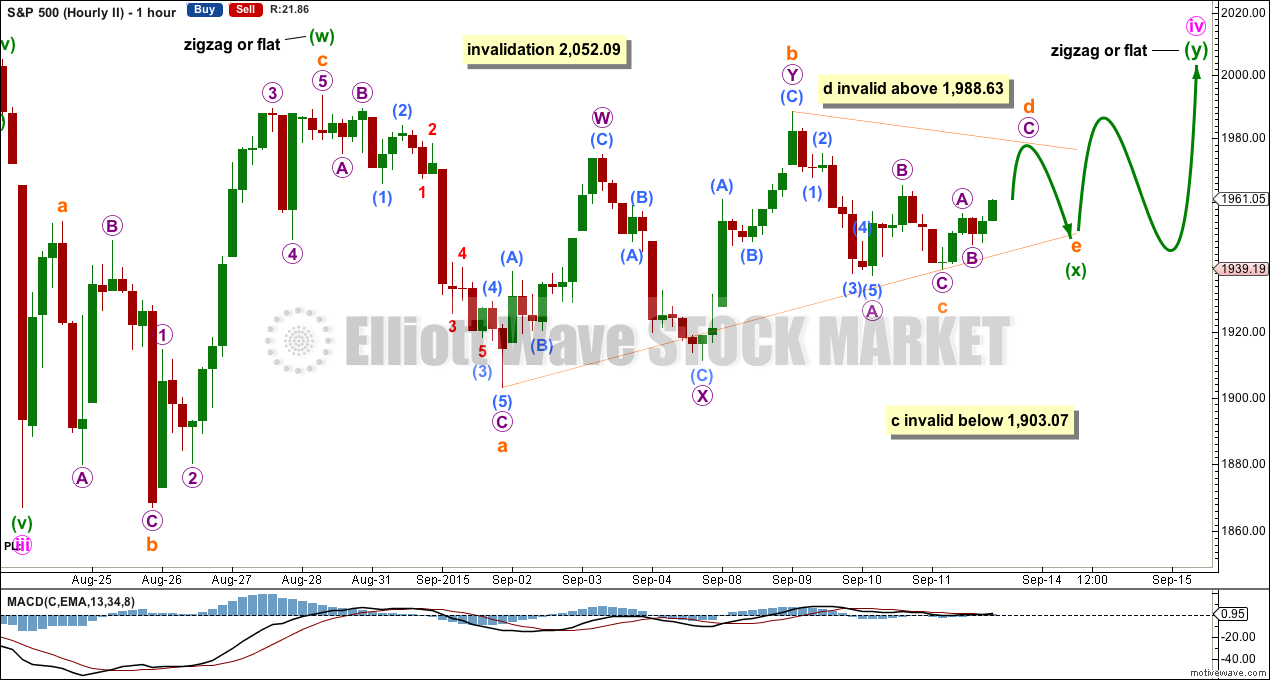
To end the week I have only two ideas remaining at the hourly chart level. They are presented in order of probability.
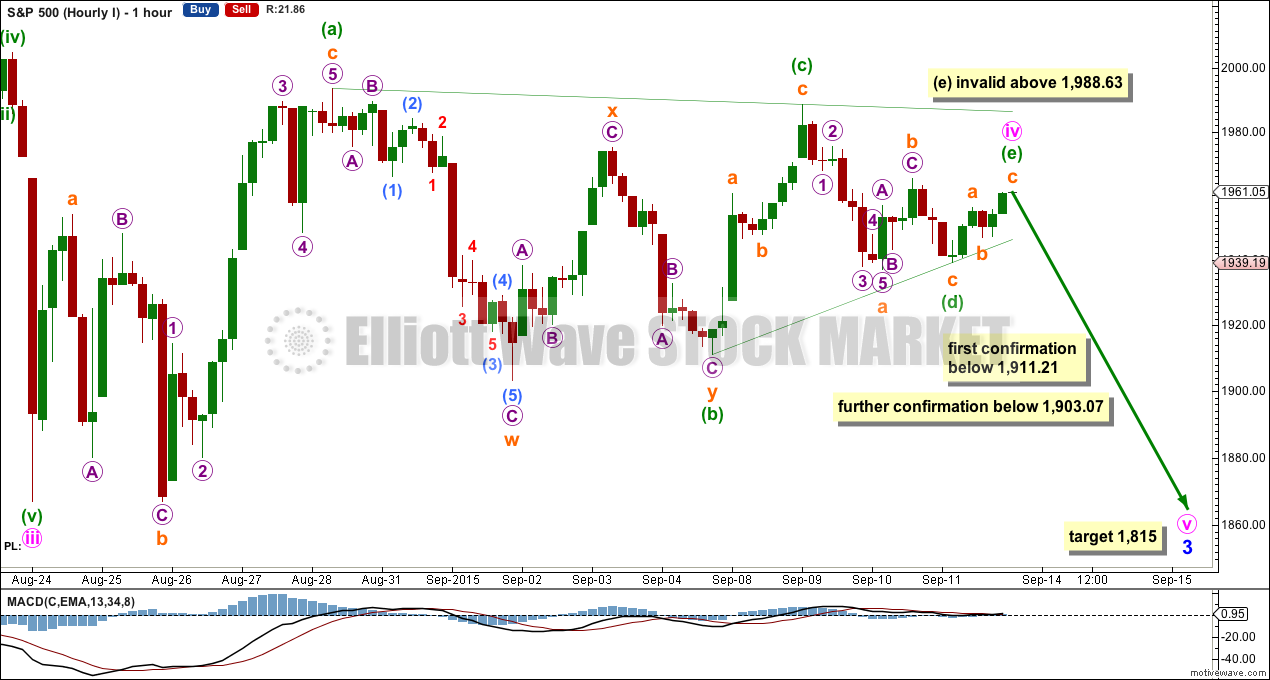
Draw a trend channel about the recent downwards movement using Elliott’s second technique: draw the first trend lien from the ends of minute waves ii to iv (and redraw this line if minute wave iv moves any higher on Monday), then place a parallel copy on the low of minute wave iii. Expect minute wave v to end mid way within the channel or to find support at the lower edge.
FIRST HOURLY ELLIOTT WAVE COUNT
Click chart to enlarge.
At this stage, a triangle may now be complete. This idea has the right look. If price remains below 1,988.63 and moves lower, then a new low below 1,911.21 would be earliest indication that the correction is over and a downwards breakout has begun.
If this correction is a triangle, then it may only be a fourth wave for minute wave iv. A triangle may not be the sole structure for minuette wave (ii); second waves may not subdivide as triangles.
At this stage, it is possible that minuette wave (d) within the triangle is not over, because sideways movement for Friday may be a continuation of subminuette wave b within a downwards zigzag for minuette wave (d). Minuette wave (d) may not move beyond the end of minuette wave (b) at 1,911.21 for a contracting triangle, and for a barrier triangle should end about that point. Reasonable movement below 1,911.21 could not be a continuation of the triangle, so at that stage the triangle would have to be over and would be as labelled here.
If minuette wave (e) is over and does not move higher, then at 1,815 minute wave v would reach 0.618 the length of minute wave iii. If minuette wave (e) moves higher when markets open on Monday, then this target must also move correspondingly higher.
There is no Fibonacci ratio between minute waves i and iii; it is more likely that minute wave v will exhibit a Fibonacci ratio to either of i or iii. The price point 1,815 is also the 0.236 Fibonacci ratio of primary wave 3, so some support may be expected there.
The triangle is supported by MACD hovering about the zero line while it unfolds. This does not always happen while triangles unfold, but when it does then they have a higher probability.
This first hourly wave count expects the downwards trend to resume on Monday most likely. But it remains possible that the triangle could drift sideways a little more for another couple of days until it is done.
The breakout should be down. A new low below 1,903.07 would invalidate the second idea below and provide further confirmation of a breakout.
SECOND HOURLY ELLIOTT WAVE COUNT
Click chart to enlarge.
It has been my experience over the years that too many times when I think a triangle is unfolding it is invalidated right at the last minute and the correction turns out to be a combination. Alternates should always be considered when it looks like a triangle is unfolding so that we are prepared for all possibilities.
At this stage, if a combination is unfolding, then it may be a zigzag or flat – X wave (as a triangle) – to complete for the second structure.
The first structure looks more like a zigzag than a flat, which means the second structure is most likely to be a flat correction for a double combination.
The triangle for minuette wave (x) needs to move sideways some more to complete subminuette waves d and e.
It is possible also that subminuette wave c is not over and is unfolding as a more time consuming zigzag. It may not move beyond the end of subminuette wave a below 1,903.07.
Subminuette wave d may not move reasonably above the end of submineutte wave b at 1,988.63.
When the triangle is complete a false upwards breakout may happen for the start of minuette wave (y). Minuette wave (y) may move in overlapping sideways movement in an ever increasing range.
This idea has a very low probability for two reasons:
1. X waves are commonly zigzags. It is unusual for an X wave to be a triangle.
2. This would see the duration of the correction much longer than minute wave ii. Minute wave ii lasted four days. While combinations and triangles are more time consuming structures, so far this correction has lasted a Fibonacci 13 days. For it to continue for several more days would see it grossly disproportionate to minute wave ii, which would give the wave count an unusual look at the daily chart level.
This second idea is an alternate to consider all possibilities.
BEAR ELLIOTT WAVE COUNT
MONTHLY CHART
Click chart to enlarge.
What if the big flat correction labelled super cycle wave (w) or (a) was only the first three in a larger correction?
This bear wave count fits better than the bull with the even larger picture, super cycle analysis found here. It is also well supported by regular technical analysis at the monthly chart level.
There are two ideas presented in this chart: a huge flat correction or a double flat / double combination. The huge flat is more likely. They more commonly have deep B waves than combinations have deep X waves (in my experience).
A huge flat correction would be labelled super cycle (a)-(b)-(c). It now expects a huge super cycle wave (c) to move substantially below the end of (a) at 666.79. C waves can behave like third waves. This idea expects a devastating bear market, and a huge crash to be much bigger than the last two bear markets on this chart.
The second idea is a combination which would be labelled super cycle (w)-(x)-(y). The second structure for super cycle wave (y) would be a huge sideways repeat of super cycle wave (a) for a double flat, or a quicker zigzag for a double combination. It is also possible (least likely) that price could drift sideways in big movements for over 10 years for a huge triangle for super cycle wave (y).
WEEKLY CHART
Click chart to enlarge.
This bull market since 2009 is seen as a zigzag for the bear wave count. A-B-C of a zigzag subdivides 5-3-5, exactly the same as 1-2-3 for an impulse. There is no difference in subdivisions between bull and bear wave counts at the monthly chart level. Only the degree of labelling differs.
Here the bull market trend line is shown, which is drawn using the approach outlined by Magee in the classic “Technical Analysis of Stock Trends”. The trend line was breached some first by a close of more than 3% of market value back on 29th June, telling us the market had changed from bull to bear. Because this trend line is repeatedly tested, reasonably shallow and long lasting it is highly technically significant.
DAILY CHART
Click chart to enlarge.
A big impulse down must begin, for this bear wave count, so a series of overlapping first and second waves should now be complete. The idea for the bull wave count does not work for this bear wave count.
A new low below 1,370.58 would invalidate the bull wave count confirming a huge market crash. Before that price point is passed though, structure should be a strong indication that this bear wave count would be correct. It is supported by regular technical analysis at the monthly chart level.
TECHNICAL ANALYSIS
MONTHLY CHART
Click chart to enlarge. Chart courtesy of StockCharts.com.
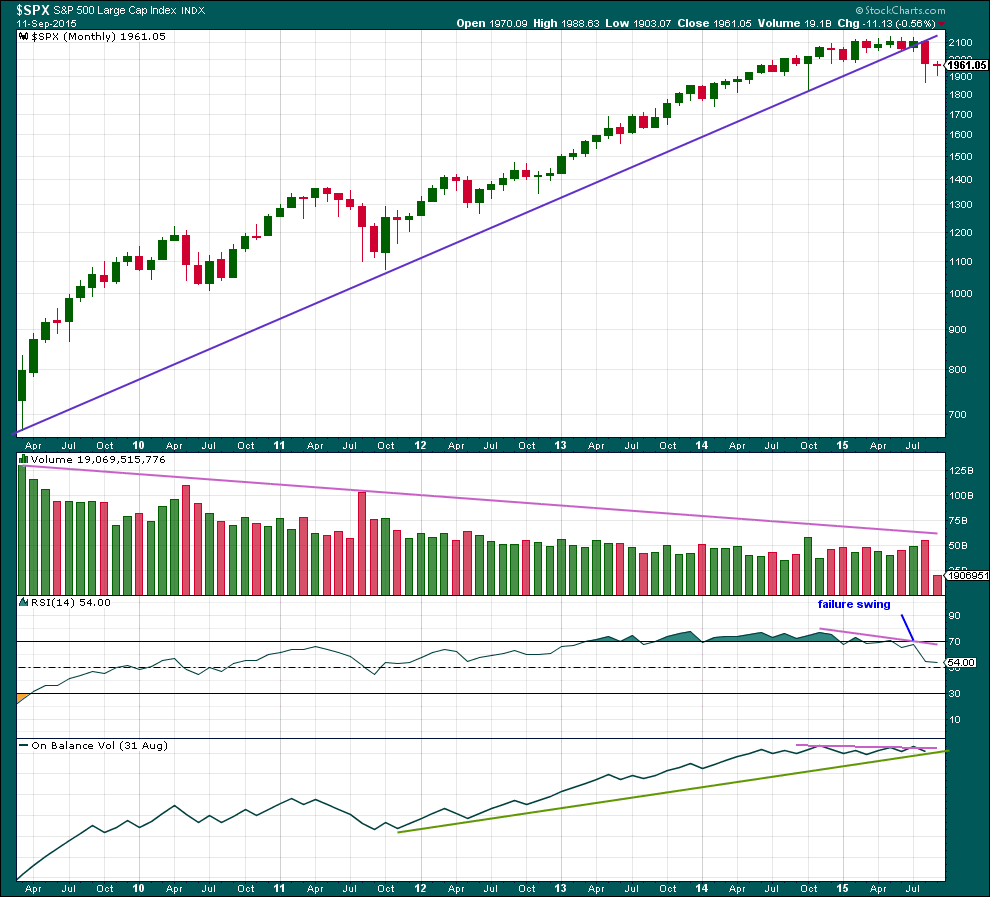
Monthly: The long trend line on price is drawn from the low of March 2009, at 666.79 to the low in October 2011. This trend line was repeatedly tested, breached, and then provided resistance in August 2015. Price has closed well over 3% of market value below it. Trend lines like this one which are reasonably shallow, long held and repeatedly tested are highly technically significant. The breach tells us the market has switched from bull to bear. This supports the bear wave count over the bull.
Volume has overall declined during the bull market spanning over 6 years. The rise in price was not supported by volume at the monthly chart level. This also supports the bear wave count over the bull.
RSI shows double negative divergence with price as the final highs were made. Finally, a failure swing on RSI completes a pattern which was last seen in September 2000, and October 2007. This pattern indicates a large bear market may begin from here and supports the bear wave count over the bull.
On Balance Volume also shows divergence with price as the final highs were made.
Not only is there nothing bullish about this picture at the monthly chart level, it is very bearish indeed. It indicates that recent downwards movement is more likely to be the start of a large bear market than it is to be another correction within a continuing bull market.
DAILY CHART
Click chart to enlarge. Chart courtesy of StockCharts.com.
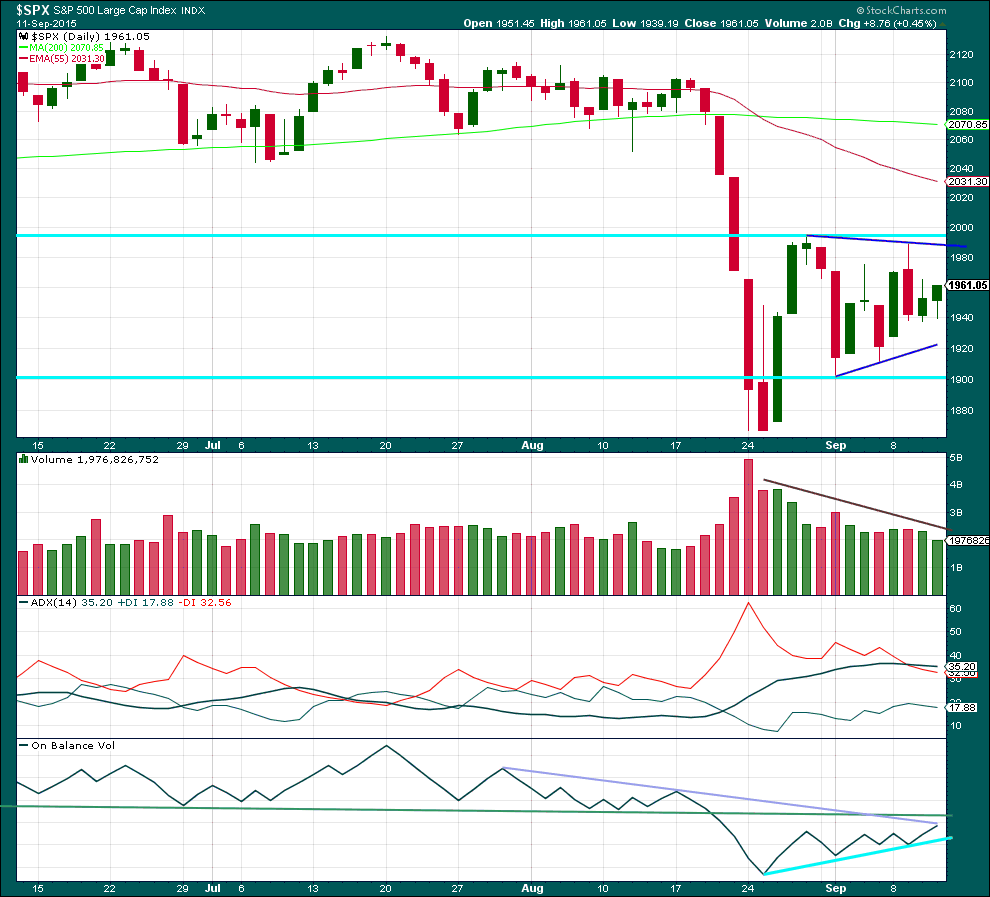
Daily: Another inside day on lighter volume looks corrective. The consolidation is maturing. The breakout will come, and I remain confident it is most likely to be downwards.
ADX is flat indicating the market is not currently trending. ADX does tend to be a lagging indicator.
I have redrawn the purple line on On Balance Volume because the last line was breached. The green line is more technically significant because it is more shallow, longer held and tested more often. OBV should find resistance at that line, if it comes up to touch it. A break below the shorter held bright aqua blue line on OBV would be further bearishness. If OBV turns down from here, then that would strengthen the resistance of the purple line as it is now drawn.
The sloping purple lines showing some support and resistance first need to be breached for a price breakout. And upwards breach is not expected, but is a slim possibility (only in the sense that anything is possible). A breach of the lower line is expected. When price breaks above or below the horizontal aqua blue lines, then that would provide strong confirmation of a breakout. The breakout should come on a day with increased volume, this is especially so for any upwards breakout. But to the downside the market can fall of its own weight.
If I wanted to see anything bullish in this whole picture, I could say that within this recent sideways movement the strongest day’s volume is the first day which had highest volume. But that really would be stretching credulity, because as price rose for the first three days of the correction volume fell. It’s not really bullish at all.
A note on Dow Theory: for the bear wave count I would wait for Dow Theory to confirm a huge market crash. So far the industrials and the transportation indices have made new major swing lows, but the S&P500 and Nasdaq have not.
S&P500: 1,820.66
Nasdaq: 4,116.60
DJT: 7,700.49 – this price point was breached.
DJIA: 15,855.12 – this price point was breached.
This analysis is published about 08:30 p.m. EST.
My waves II and IV both show .382 retracement and their bottoms line up perfectly. Is that because I am using a daily chart instead of a monthly?