
Again, sideways movement was expected to continue. This is exactly what happened for Thursday.
Summary: The short term picture is exactly the same as yesterday. The consolidation is most likely a fourth wave, but may also be a second wave correction. The pathway on the hourly chart is uncertain. There are more than a few possible structures which could be unfolding. In the short term, I will use a trend line on the daily chart which shows support to indicate when this consolidation is over. A break below the line, which must come for a down day with increased volume, is required to indicate a return of the downwards trend.
To view the last weekly chart click here.
Changes to last analysis are bold.
ELLIOTT WAVE COUNT
Click chart to enlarge.
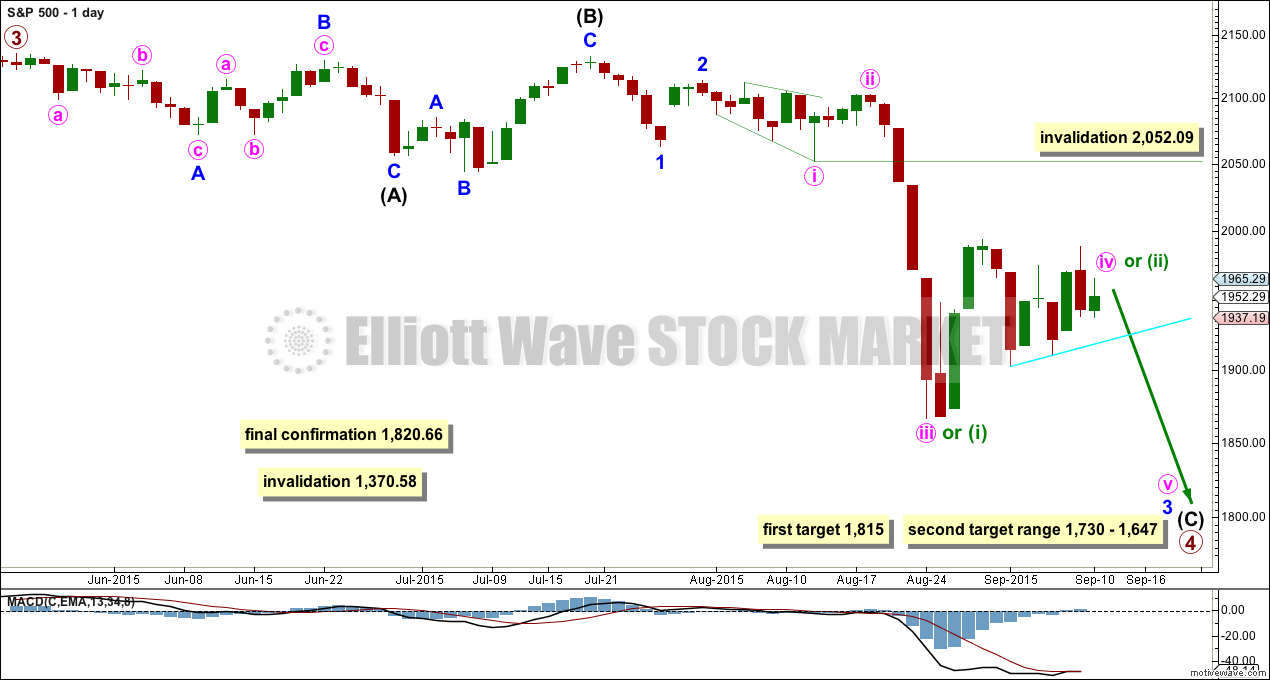
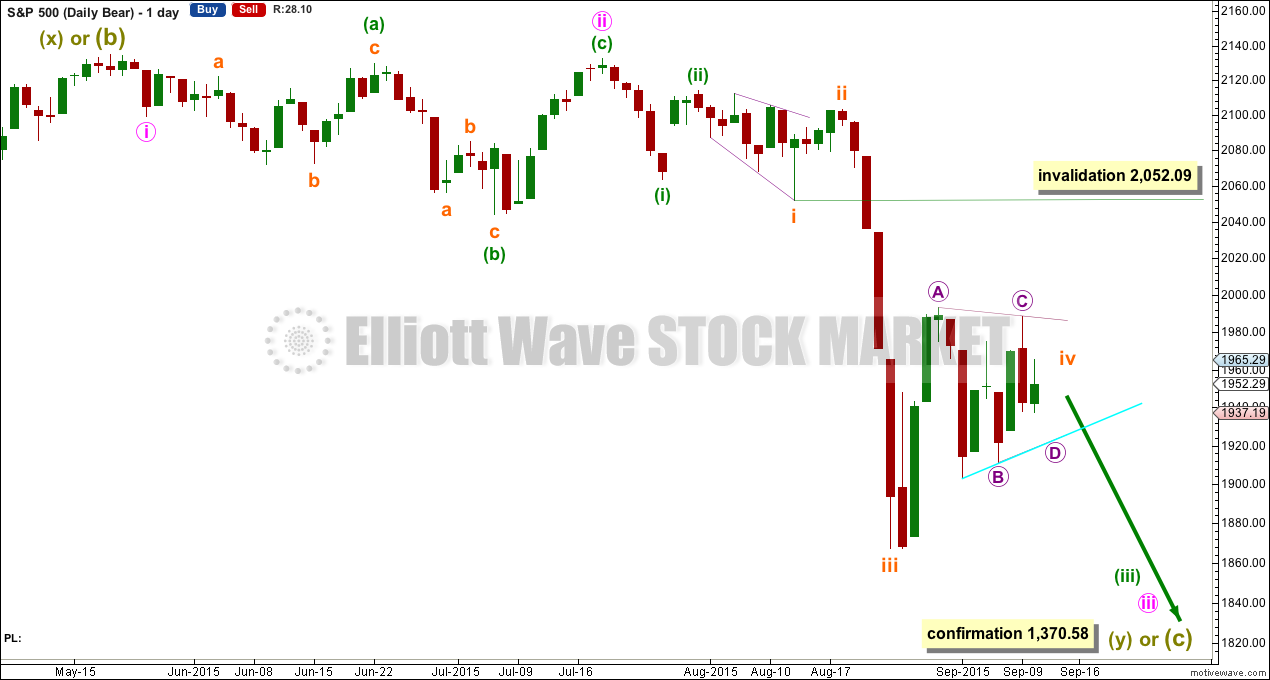
The S&P has seen a primary degree (or for the bear count below a Super Cycle degree) trend change.
Primary wave 2 was a relatively shallow 0.41 zigzag lasting 12 weeks. Primary wave 4 may be more shallow, most likely to be a flat, combination or triangle, and may be longer lasting than primary wave 2 as these types of sideways corrective structures tend to be more time consuming than zigzags. Primary wave 4 may complete in a total Fibonacci 21 weeks. Primary wave 4 is in its 16th week, but it may not exhibit a Fibonacci duration because the S&P does not reliably do this. Time estimates may only be taken as a very rough guide.
Primary wave 4 may reach down into the fourth wave of one lesser degree price range from 1,730 to 1,647, but it may not be that deep. It may end only about the 0.236 Fibonacci ratio of primary wave 3 at 1,815.
Within primary wave 4, it may be that intermediate waves (A) and (B) are both complete as three wave structures indicating a flat may be unfolding. Intermediate wave (C) down must be a five wave structure; it looks like it is unfolding as an impulse. For now I will leave this degree as is, but depending on where intermediate wave (C) ends I may move it back down one degree. It is also possible that only minor wave A may be unfolding as a flat correction.
At the daily chart level, this wave count sees primary wave 4 as a possible regular flat correction: intermediate wave (B) is a 98% correction of intermediate wave (A). However, regular flats normally have C waves which are close to equality with their A waves, and they normally fit nicely within parallel channels. Here intermediate wave (C) is much longer than (A) and will still move lower as its structure is incomplete. When the five wave impulse down for intermediate wave (C) is complete, then I will revisit the structure of primary wave 4 which may not be a flat. The structure at the daily chart level so far fits for the very bearish wave count better than this wave count.
If this impulse does not bring price down to the target range or the lower edge of the big channel on the weekly chart, then it may only be intermediate wave (A) of a bigger flat for primary wave 4. If it does bring price lower to the target range, then it may be primary wave 4 in its entirety.
This wave count now has some confirmation at the daily chart level with a close more than 3% of market value below the long held bull market trend line.
Full and final confirmation would come with:
1. A clear five down on the daily chart.
2. A new low below 1,820.66.
As each condition is met further confidence may be had in the bigger picture for this wave count.
Primary wave 4 may not move into primary wave 1 price territory below 1,370.58. Invalidation of this bull wave count (still bullish at cycle degree) would be confirmation of the bear wave count.
Today I will present three ideas on the hourly chart level for recent movement, and I will present them in order of probability. The first idea works only if minute wave iv is unfolding, but the second and third ideas work in exactly the same way for minute wave iv or minuette wave (ii).
FIRST HOURLY ELLIOTT WAVE COUNT
Click chart to enlarge.
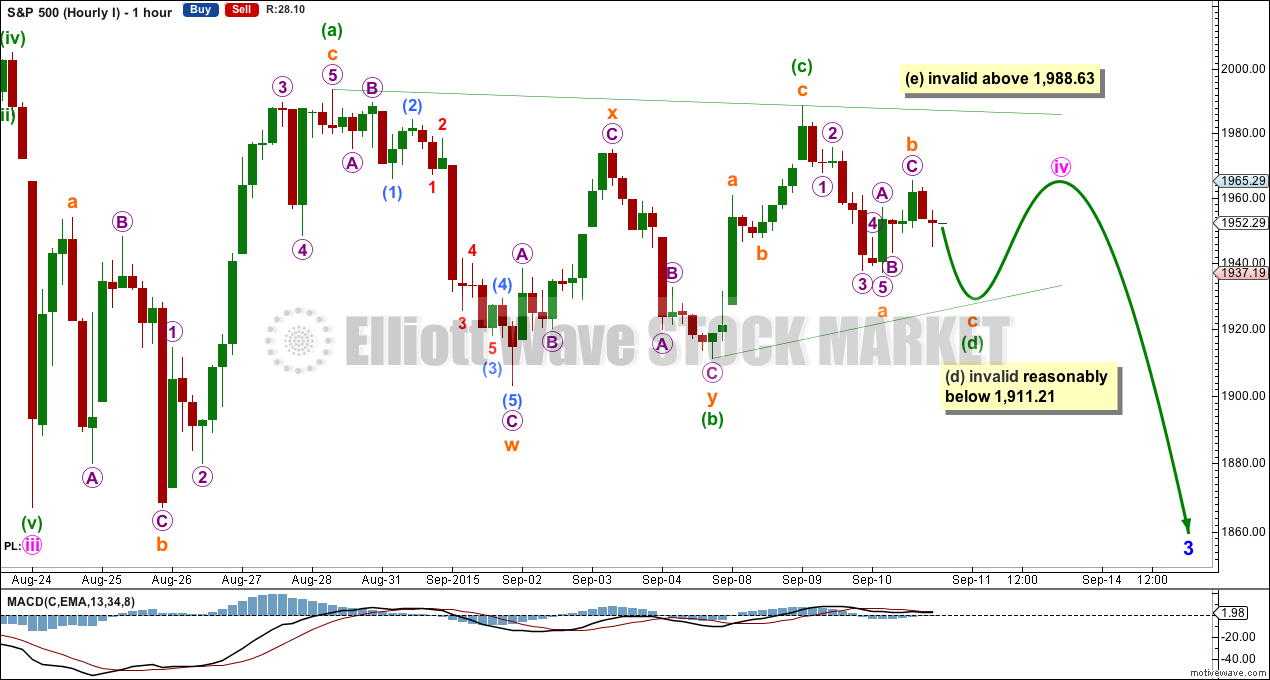
So far this first wave count still looks most likely. If a triangle completes, then it may only be a fourth wave and may not be a second wave for minuette wave (ii) because a second wave correction may not have its sole structure as a triangle.
Minuette wave (d) of a regular contracting triangle may not move beyond the end of minuette wave (b) below 1,911.21. Minuette wave (d) of a regular barrier triangle should end about the same level as minuette wave (b) at 1,911.21 as long as the (b)-(d) trend line remains essentially flat. What this means in practice is minuette wave (d) can end slightly below 1,911.21 and this wave count would remain valid. This invalidation point is not black and white, and this is the only Elliott wave rule which has any grey area.
Today I do not think minuette wave (d) is over at Thursday’s low because it would be too shallow to have the right look, the (b)-(d) trend line would be too steep.
The rule for minuette wave (e) of both a contracting and barrier triangle is the same and is black and white. Minuette wave (e) may not move beyond the end of minuette wave (c) above 1,988.63. Minuette wave (e) would most likely fall short of the (a)-(c) trend line.
This first idea expects to see a continuation of overlapping sideways movement for the rest of this week and into next week now as a triangle comes to an end. Triangles exist to take up time, move price sideways, and test our patience. They do the latter very well indeed.
If this is how the consolidation unfolds, then we shall know it was a fourth wave, not a second, and the following wave down for minute wave v may show slower momentum than the prior wave down labelled minute wave iii.
When minute wave iv is over and its end is known then a target may be calculated for minute wave v down to end. That cannot be done yet.
SECOND HOURLY ELLIOTT WAVE COUNT
Click chart to enlarge.
It has been my experience over the years that when I think a triangle is unfolding it can be invalidated right at the last minute, so the correction turns out to be something else, most often a combination. This second idea is considered for that reason. Triangles are very tricky structures.
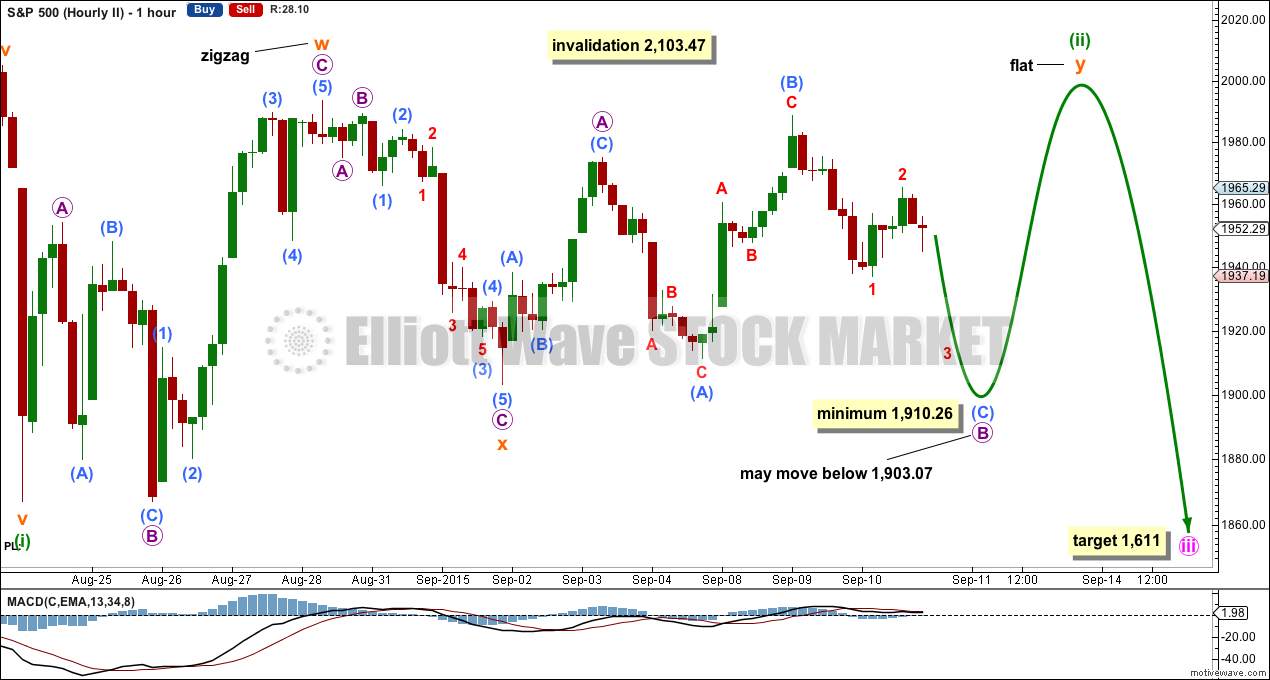
This idea works in the same way whether this consolidation is minute wave iv or minuette wave (ii). Here I have moved everything within the last wave down and this sideways movement down one degree to show the degree of labelling for minuette wave (ii).
Minuette wave (ii) may not move beyond the start of minuette wave (i) above 2,103.47.
However, price should not get close to the invalidation points of either minute wave iv at 2,052.09 or minuette wave (ii) at 2,103.47. Combinations move price sideways; they do not normally have a strong slope against the trend.
Here the first structure is seen as a zigzag which has the right look. The double combination is joined by a “three”, a zigzag labelled subminuette wave x in the opposite direction.
The second structure in the double may be unfolding as a flat correction. Flats subdivide 3-3-5 and within them their B waves must retrace a minimum 90% of their A waves, and the B wave may make a new price extreme beyond the start of the A wave. Micro wave B must reach down to 1,910.26 minimum and may move below the start of micro wave A at 1,903.07 as in an expanded flat. This unfortunately means that a new low below 1,903.07 would not provide any confirmation that the consolidation is over.
When micro wave B is complete then the type of flat would be known. If it is 90 – 109% of micro wave A, then this may be a regular flat. If it is 110% or more of micro wave A, then this may be an expanded flat. A regular flat would expect micro wave C to be about equal in length with micro wave A. An expanded flat would expect micro wave C to be 1.618 the length of micro wave A. Both ideas would expect micro wave C to end at least slightly above micro wave A at 1,975.01 to avoid a truncation.
The only thing to add today is that this idea looks a little less likely than yesterday due to the size of upwards movement for Thursday’s session. Submicro wave (C) must subdivide as a five wave structure, and I would not expect the subdivisions within it to be so large to show up on the daily chart.
Subminuette wave y would be expected to end about the same level as subminuette wave w at 1,993.48, so that the whole structure for the double combination moves sideways.
What the second and third hourly wave counts are showing is that the pathway of this correction, whether it be a second or fourth wave, cannot be known with any degree of certainty. There are too many possible structures which may be unfolding at this stage. The focus needs to be not on what may happen at the hourly chart level for short term movements but when the consolidation is over, and what to look for to confirm a downwards breakout.
If the consolidation is a second wave as labelled here, then the implication is that the next wave down should be much stronger than the last wave down. But if the consolidation is a fourth wave, then the next wave down may show a decline in momentum from the last wave down.
THIRD HOURLY ELLIOTT WAVE COUNT
Click chart to enlarge.
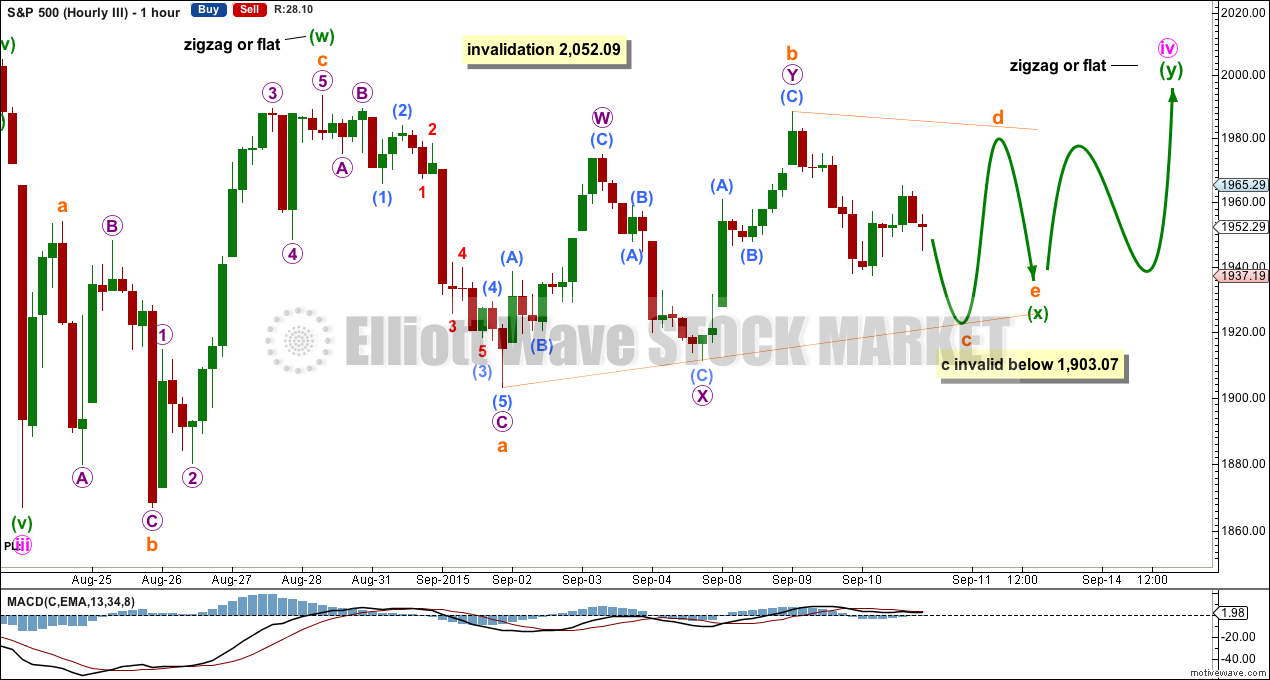
This third idea has the lowest probability, but is still viable. It looks at a combination or double flat with a triangle for the X wave. This has a lower probability because X waves are most commonly zigzags, and it is uncommon for them to be triangles. The first structure in the double may be seen as either a zigzag or a flat correction because subminuette wave a will subdivide as either a three or a five on the five minute chart. The first structure is more likely to be a zigzag though, because it has a better look and does not look like a normal regular flat correction.
The double may be joined by a “three” in the opposite direction: a triangle for minuette wave (x).
The second structure in the double would be yet to begin. If the first was a zigzag most likely, then the second structure is most likely to be a flat correction for minuette wave (y). If the first structure is a flat, then the second structure may also be a flat for a double flat, or it may be a zigzag for a double combination.
The whole correction should move price sideways. The second structure should end about the same level as the first at 1,993.48. The purpose of combinations is the same as triangles: to take up time, move price sideways, and test our patience. Their pathway is less clear than triangles, so combinations are even more tricky to analyse as they unfold.
This second idea also works in exactly the same way for a possible second wave correction of minuette wave (ii); when we move everything here down one degree, then minuette wave (i) may have been the last wave down and this sideways movement may be minuette wave (ii).
BEAR ELLIOTT WAVE COUNT
Click chart to enlarge.
The subdivisions within cycle waves a-b-c are seen in absolutely exactly the same way as primary waves 1-2-3 for the main wave count.
In line with recent Grand Super Cycle wave analysis, I have moved the degree of labelling for the bear wave count all up one degree.
This bear wave count expects a Super Cycle wave (c) to unfold downwards for a few years, and if it is a C wave it may be devastating. It may end well below 666.79.
However, if this wave down is a Super Cycle wave (y), then it may be a time consuming repeat of the last big flat correction with two market crashes within it, equivalent to the DotCom crash and the recent Global Financial Crisis, and it may take another 8-9 years to unfold sideways.
For this bear wave count a big impulse down must begin, so a series of overlapping first and second waves should now be complete. The new idea for the first wave count does not work for this bear wave count.
A new low below 1,370.58 would invalidate the first wave count confirming a huge market crash. Before that price point is passed though, structure should be a strong indication that this bear wave count would be correct. It is supported by regular technical analysis at the monthly chart level.
TECHNICAL ANALYSIS
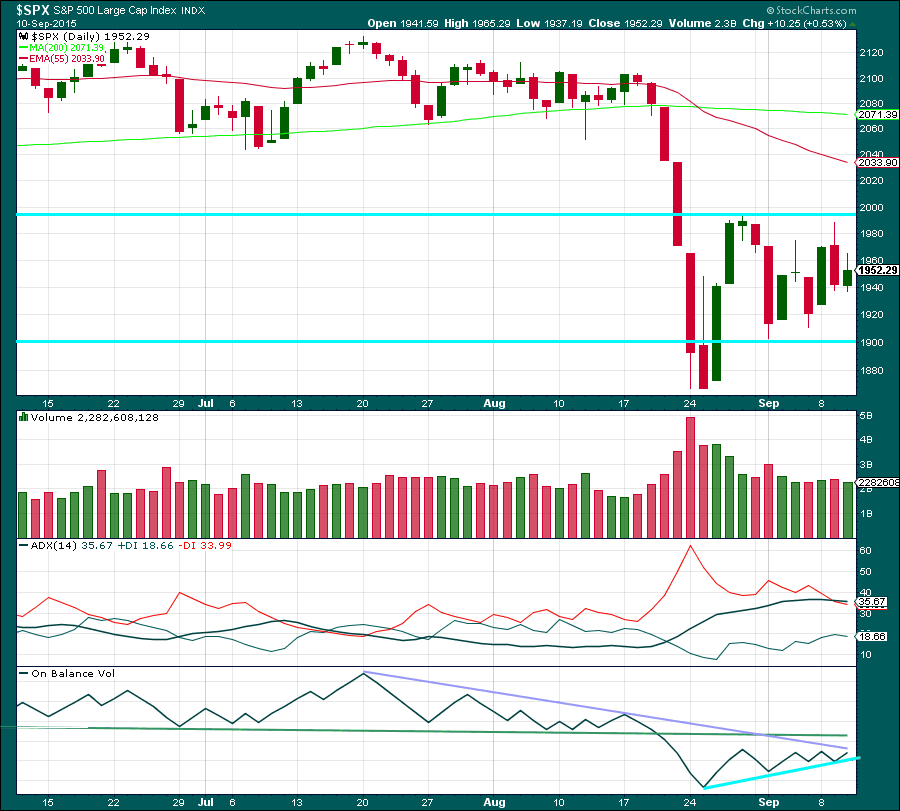
Click chart to enlarge. Chart courtesy of StockCharts.com.
An inside day on light volume fits for a consolidation.
Still, there is nothing bullish about this picture at all. All regular technical analysis indicators plus the Elliott wave count are bearish.
ADX is flat indicating the market is range bound. ADX does tend to be a lagging indicator. I have added today horizontal lines showing support and resistance. A downwards breakout is expected and would be confirmed with a break below the lower bright aqua blue trend line.
On Balance Volume is bearish while it remains below the green trend line. A breakout is getting closer, OBV is becoming squeezed between the purple and bright aqua blue lines.
A note on Dow Theory: for the bear wave count I would wait for Dow Theory to confirm a huge market crash. So far the industrials and the transportation indices have made new major swing lows, but the S&P500 and Nasdaq have not.
S&P500: 1,820.66
Nasdaq: 4,116.60
DJT: 7,700.49 – this price point was breached.
DJIA: 15,855.12 – this price point was breached.
This analysis is published about 10:04 p.m. EST.
Lara,
I am just wondering if the duration of this sideways movement lends itself more to a wave ii interpretation rather than a wave iv. Thanks.
Peter
The opposite I think.
This correction has now lasted a Fibonacci 13 days. It’s much longer in duration than the prior correction which was 4 days.
That’s okay if this correction is a fourth wave triangle and the second wave was a double zigzag, zigzags are much quicker than triangles.
But it isn’t so good if this is a lower degree second wave, it would be much longer in duration than a second wave one degree higher.
Looks like there are market conditions bushing back against a drop: One is the current % of the NYSE stocks bellow their 50 & 200 DMA: Hard to fall more with out a reset of some sort http://stockcharts.com/h-sc/ui?s=%24NYA50R&p=D&yr=5&mn=2&dy=0&id=p75379954522&a=364739675
The other standout is the daily MACD
http://stockcharts.com/h-sc/ui?s=%24SPX&p=D&yr=1&mn=0&dy=1&id=p55441326171&a=423782191
It will be fascinating to see how this works out!
As counter-intuitive as it seems, some of the most dramatic declines come after markets are unable to recover from an already over-sold condition….