
The alternate Elliott wave analysis expected sideways movement and is correct.
Summary: In the short term, the situation is unclear. A fourth wave is most likely unfolding; there is still more than one possible structure that it may be. Sideways / upwards movement is expected to complete this correction, which may continue for most of this week. A new low reasonably below 1,911.21 would indicate the correction is over and the next wave down has begun to new lows.
To view the last weekly chart click here.
Changes to last analysis are bold.
ELLIOTT WAVE COUNT
Click chart to enlarge.
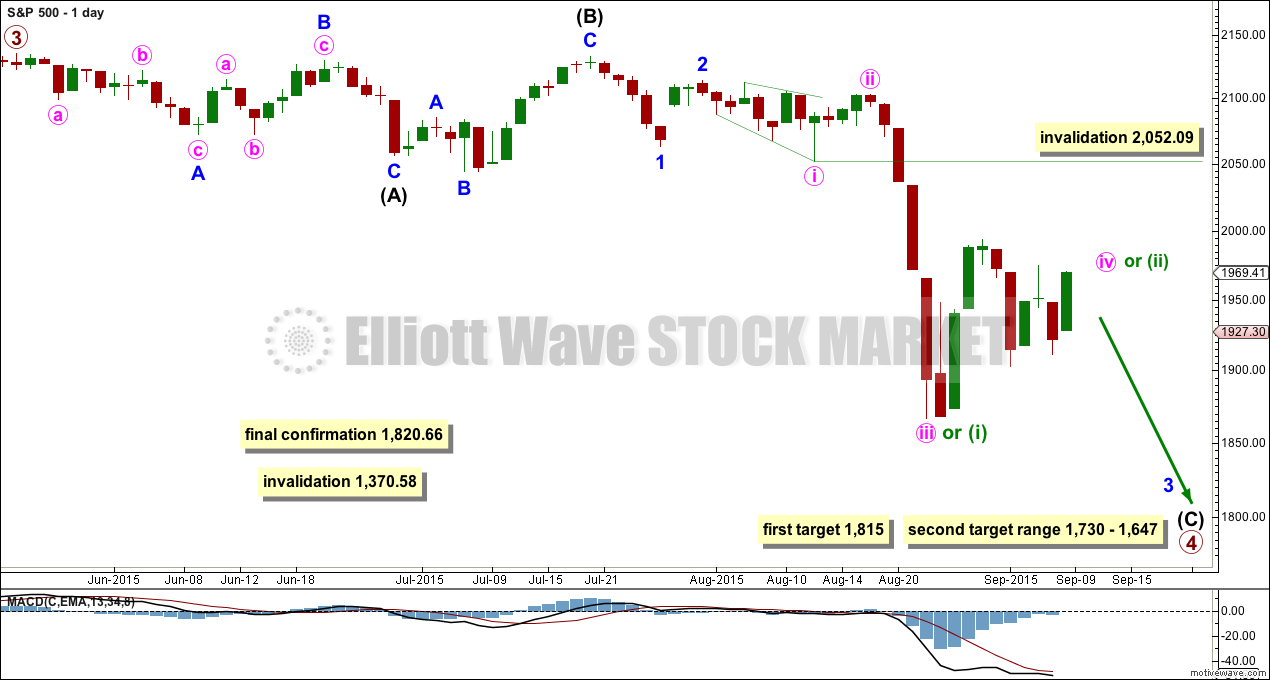
The S&P has seen a primary degree (or for the bear count below a Super Cycle degree) trend change.
Primary wave 2 was a relatively shallow 0.41 zigzag lasting 12 weeks. Primary wave 4 may be more shallow, most likely to be a flat, combination or triangle, and may be longer lasting than primary wave 2 as these types of sideways corrective structures tend to be more time consuming than zigzags. Primary wave 4 may complete in a total Fibonacci 21 weeks. Primary wave 4 has started its 16th week, but it may not exhibit a Fibonacci duration because the S&P does not reliably do this. Time estimates may only be taken as a very rough guide.
Primary wave 4 may reach down into the fourth wave of one lesser degree price range from 1,730 to 1,647, but it may not be that deep. It may end only about the 0.236 Fibonacci ratio of primary wave 3 at 1,815.
Within primary wave 4, it may be that intermediate waves (A) and (B) are both complete as three wave structures indicating a flat may be unfolding. Intermediate wave (C) down must be a five wave structure; it looks like it is unfolding as an impulse. For now I will leave this degree as is, but depending on where intermediate wave (C) ends I may move it back down one degree. It is also possible that only minor wave A may be unfolding as a flat correction.
If this impulse does not bring price down to the target range or the lower edge of the big channel on the weekly chart, then it may only be intermediate wave (A) of a bigger flat for primary wave 4. If it does bring price lower to the target range, then it may be primary wave 4 in its entirety.
This wave count now has some confirmation at the daily chart level with a close more than 3% of market value below the long held bull market trend line.
Full and final confirmation would come with:
1. A clear five down on the daily chart.
2. A new low below 1,820.66.
As each condition is met further confidence may be had in the bigger picture for this wave count.
Primary wave 4 may not move into primary wave 1 price territory below 1,370.58. Invalidation of this bull wave count (still bullish at cycle degree) would be confirmation of the bear wave count.
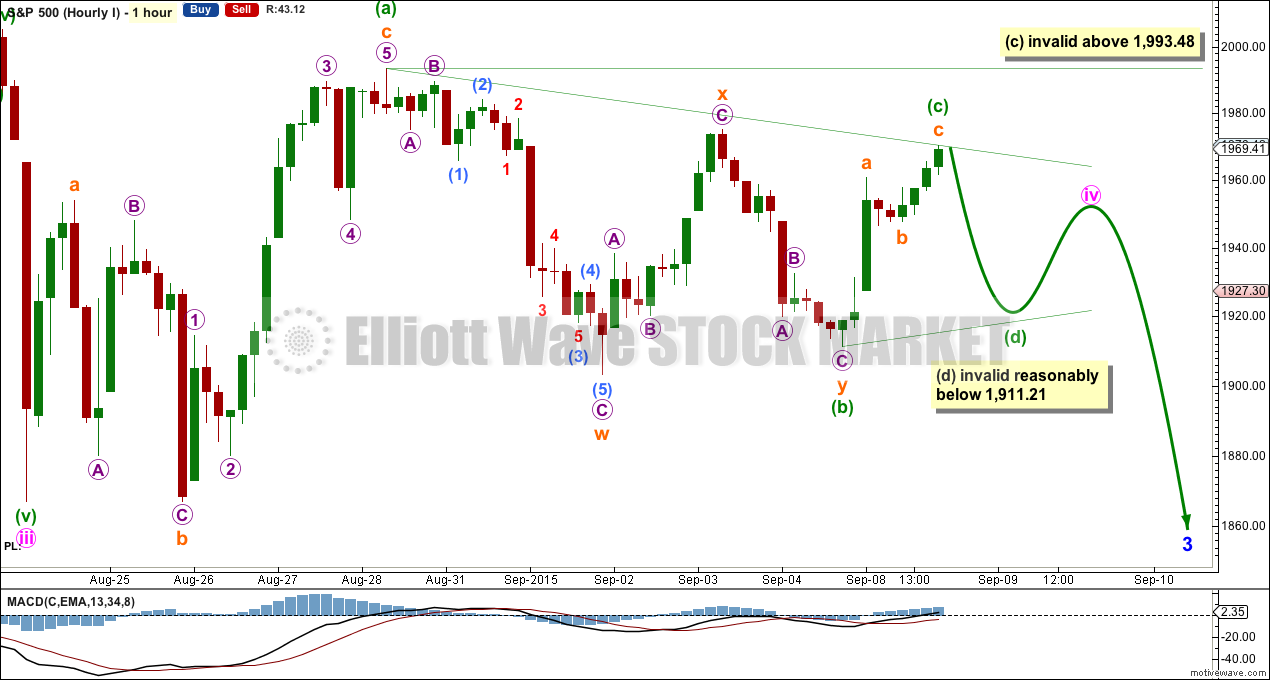
Today I will present three ideas on the hourly chart level for recent movement, and they appear in order of probability.
FIRST HOURLY ELLIOTT WAVE COUNT
Click chart to enlarge.
At this stage, this first wave count looks more likely. Minute wave iv is most likely unfolding, and up to now the most likely looking structure is a regular contracting or regular barrier triangle.
I changed today how I have labelled the triangle.
Minuette wave (b) may have ended later as a double zigzag. One of the five triangle sub waves should be a longer lasting and more complicated double. All the remaining sub waves must be threes.
Minuette wave (c) may yet move a little higher when markets open tomorrow, but may not move beyond the end of minuette wave (a) above 1,993.48.
Minuette wave (d) should then move lower. For a contracting triangle (more common), minuette wave (d) may not move beyond the end of minuette wave (b) below 1,911.21. For a barrier triangle, minuette wave (d) should end about the same level as 1,911.21 as long as the (b)-(d) trend line remains essentially flat. What this means in practice is minuette wave (d) can move slightly below 1,911.21 (this invalidation point is not black and white).
The final wave for minuette wave (e) may not move beyond the end of (c) for both contracting and barrier triangles.
This first wave count essentially expects sideways movement in an ever decreasing range which may continue for another two to four days, but could continue all week. Triangles exist to take time, move price sideways, and test our patience.
If this first wave count is correct and the triangle remains valid, then we would have a very high probability for a downwards breakout when it is done. When I know where minute wave iv has ended I can calculate a target for minute wave v. That cannot be done yet.
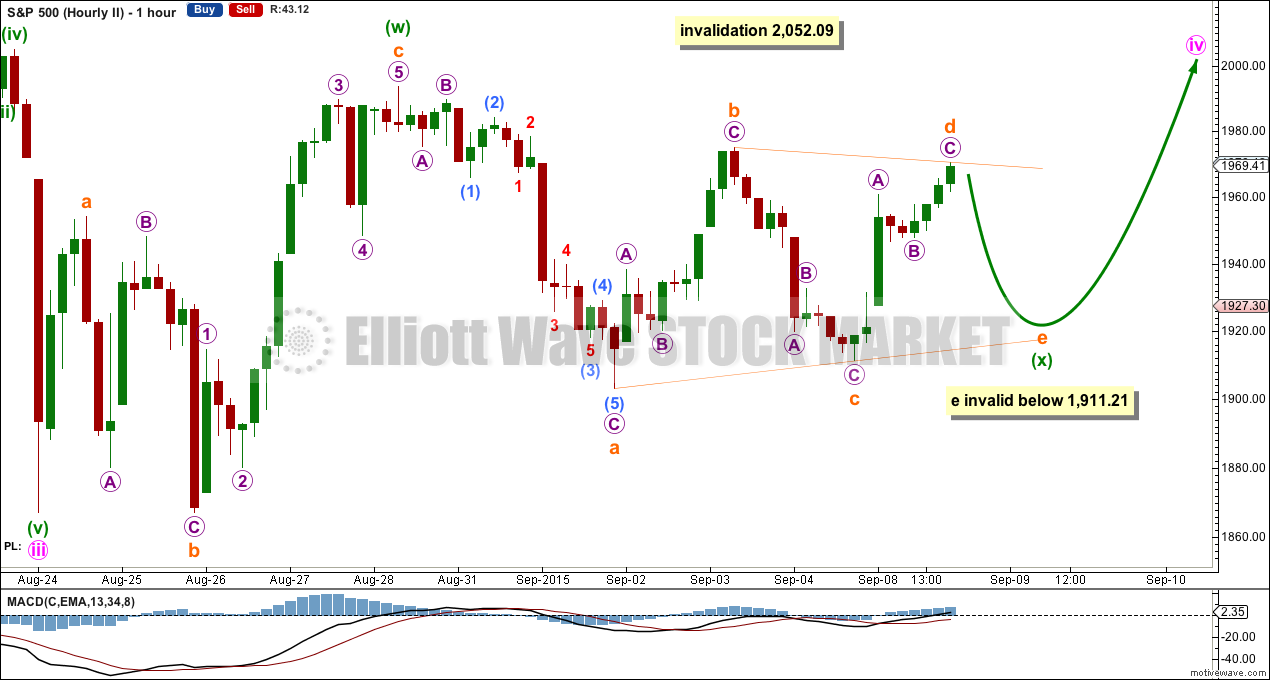
SECOND HOURLY ELLIOTT WAVE COUNT
Click chart to enlae.
There are a total of 23 possible corrective structures that a fourth wave may unfold as when all the different types of triangles and combinations are considered. A few may be eliminated in this case for minute wave iv.
The idea presented here is a combination or double zigzag with minuette wave (x) as a contracting or barrier triangle.
When markets open tomorrow, if subminuette wave d continues a little higher, this idea will only remain valid as long as the b-d trend line remains essentially flat.
Subminuette wave e may not move beyond the end of subminuette wave c below 1,911.21. This invalidation point is black and white for this idea.
When minuette wave (x) is complete then a second corrective structure should unfold for minuette wave (y), which may be a zigzag so minute wave iv may be a double zigzag. If this is how it unfolds, then price may move substantially higher. The purpose of a second zigzag in a double is to deepen a correction when the first does not move price deep enough. However, minute wave ii was a deep double zigzag and minute wave iv is extremely unlikely to also be a deep double zigzag as there would be no alternation in either depth or structure between the two.
What would be more likely is that minuette wave (w) is seen as a flat correction (although this is problematic). Or if minuette wave (w) is seen as a zigzag, then minuette wave (y) may be expected to be a flat correction. This would see minute wave iv as a double combination. The purpose of combinations is the same as triangles, to move price sideways, take up time, and test our patience. To achieve this purpose the second structure in the double normally ends about the same level as the first. Minuette wave (y) may be a flat to end about 1,993.48.
A combination for minute wave iv would provide alternation with the double zigzag of minute wave ii.
Minute wave iv may not move into minute wave i price territory above 2,052.09.
Overall this second idea is not just possible but reasonably likely. It would also expect sideways movement for a few days, maybe all week, but in a less clear pathway than the first wave count.
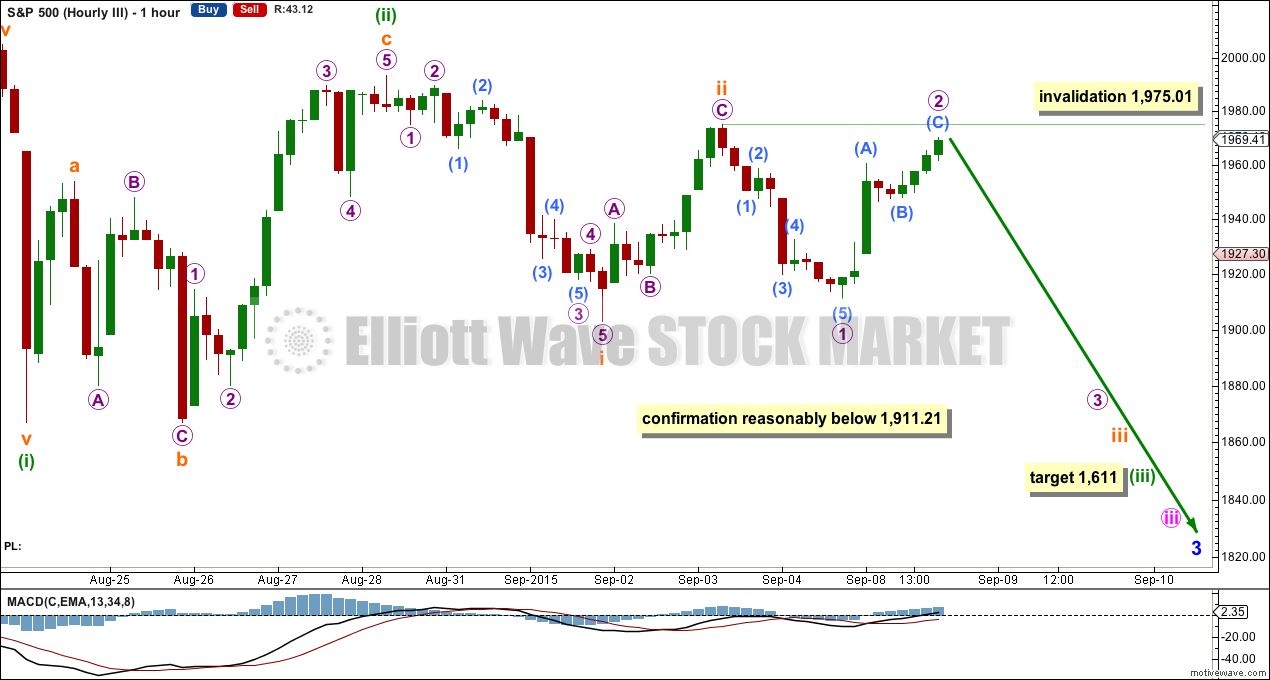
THIRD HOURLY ELLIOTT WAVE COUNT
Click chart to enlae.
At this stage, this idea is the least likely of all three ideas presented today. Although this idea is possible, its probability is low.
The last wave down, which is labelled minute wave iii for the first two hourly wave counts, is here moved down one degree because it may still have only been minuette wave (i) within minute wave iii.
Subsequent sideways movement may be a series of now three overlapping first and second waves.
Probability for this idea is lowest now because each second wave correction breaches a base channel drawn about the first and second wave one or more degrees higher (not shown because those lines are not providing resistance). Lower degree second waves should not breach base channels drawn about first and second waves one or more degrees higher.
If price begins to move lower, then only a new low reasonably below 1,911.21 would provide confidence in this idea at this stage. If that happens, then the target for downwards movement for a very strong third wave may be at 1,611 where minuette wave (iii) would reach 1.618 the length of minuette wave (i). If this target is wrong, then it may not be low enough.
Micro wave 2 may not move beyond the start of micro wave 1 above 1,975.01.
If this price point is breached, then there is a fourth possibility I would chart and use. Minuette wave (ii) may not be over as labelled and may be moving higher as a double zigzag. This would see the subdivisions for minuette wave (ii) seen in exactly the same way as the second wave count sees minute wave iv. A double zigzag for minuette wave (ii) may move price comfortably deeper. The invalidation point for this idea is right up at the start of minuette wave (i) at 2,103.47. Second wave corrections can be very deep.
BEAR ELLIOTT WAVE COUNT
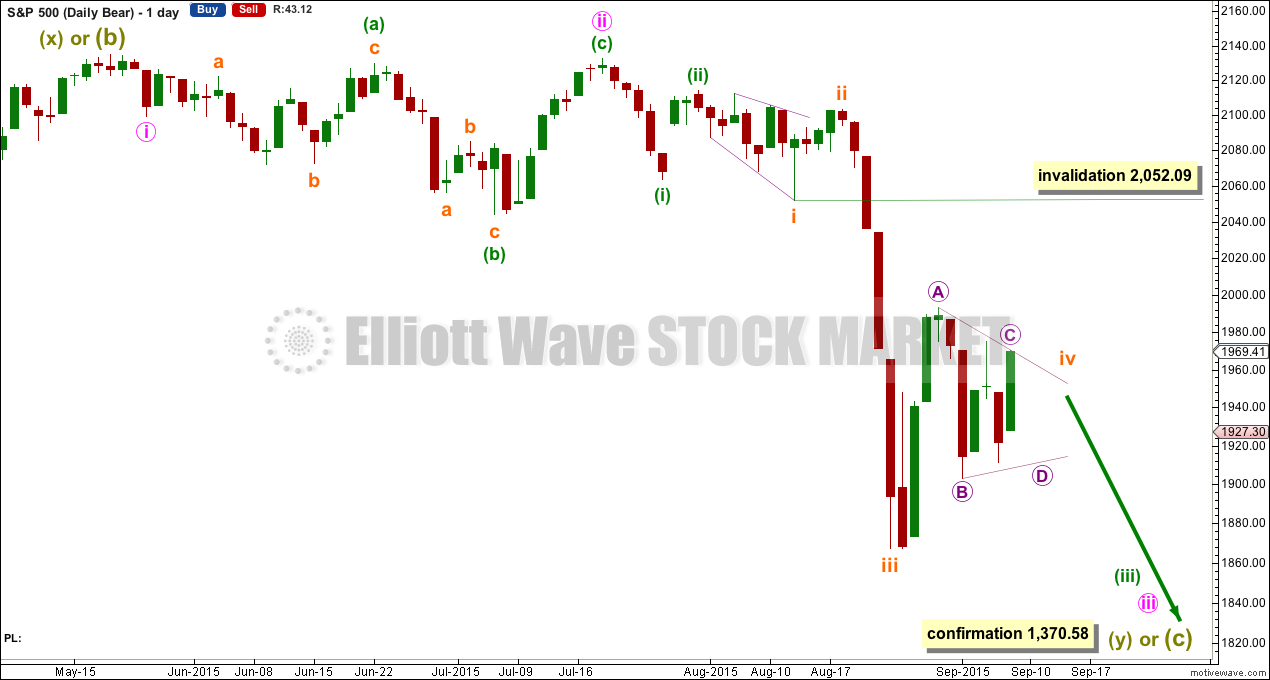
Click chart to enlarge.
The subdivisions within cycle waves a-b-c are seen in absolutely exactly the same way as primary waves 1-2-3 for the main wave count.
In line with recent Grand Super Cycle wave analysis, I have moved the degree of labelling for the bear wave count all up one degree.
This bear wave count expects a Super Cycle wave (c) to unfold downwards for a few years, and if it is a C wave it may be devastating. It may end well below 666.79.
However, if this wave down is a Super Cycle wave (y), then it may be a time consuming repeat of the last big flat correction with two market crashes within it, equivalent to the DotCom crash and the recent Global Financial Crisis, and it may take another 8-9 years to unfold sideways.
For this bear wave count a big impulse down must begin, so a series of overlapping first and second waves should now be complete. The new idea for the first wave count does not work for this bear wave count.
A new low below 1,370.58 would invalidate the first wave count confirming a huge market crash. Before that price point is passed though, structure should be a strong indication that this bear wave count would be correct. It is supported by regular technical analysis at the monthly chart level.
TECHNICAL ANALYSIS
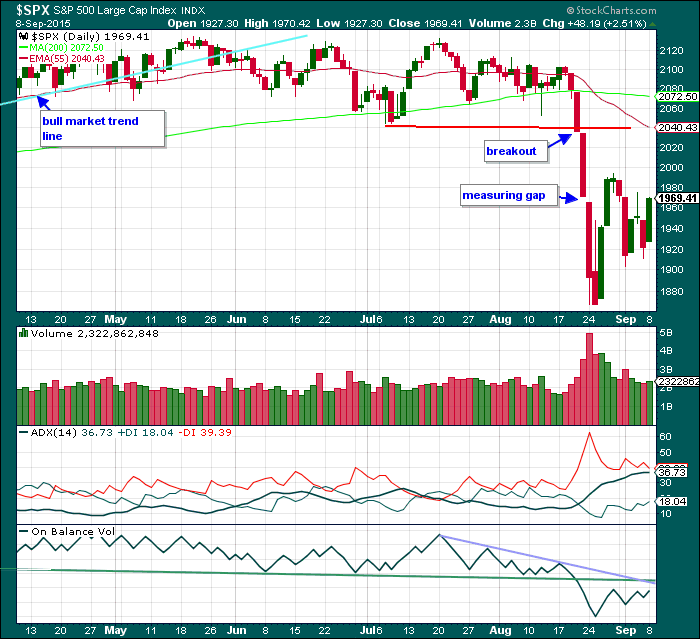
Click chart to enlarge. Chart courtesy of StockCharts.com.
Daily Chart: Volume for the last few days of sideways movement is declining overall. This is a typical volume profile for a correction and strongly supports the Elliott wave count.
Again, there is nothing bullish about this picture at all. All regular technical analysis indicators plus the Elliott wave count are bearish.
ADX continues to agree. The black ADX line continues to rise and the red -DX line is above the green +DX line indicating there is a strengthening trend and it is down.
On Balance Volume is bearish while it remains below the green trend line.
A note on Dow Theory: for the bear wave count I would wait for Dow Theory to confirm a huge market crash. So far the industrials and the transportation indices have made new major swing lows, but the S&P500 and Nasdaq have not.
S&P500: 1,820.66
Nasdaq: 4,116.60
DJT: 7,700.49 – this price point was breached.
DJIA: 15,855.12 – this price point was breached.
This analysis is published about 07:37 p.m. EST.
Diamonds ETF (DIA) putting in a fat bearish engulfing candlestick. That’s all she wrote…gap from last Friday’s close will amazingly, probably be filled prior to close…wow!
We are starting to see real panic from the central banks. Japan is up over 7%!
Starting to look like a second wave of higher degree underway and I would not be surprised to see a run at the 200 day SMA. It will have to happen over the next three days if it has any chance of kissing the underside. The next wave down should be breath-taking…
Its funny you mentioned that. S&P hit the 200day SMA and immediately headed south after that… Kiss of death maybe?!!
actually it just missed it by 4 points… but very close indeed
The SPX 200 day sma is around 2070. The high today, 9/9, was about 1988 or 90 points below the 200 day sma. I am not sure how you think it was only 4 points away.
Lara,
Is your analysis futures or cash?
Thanks.
Nevermind, I read the About section and see it is cash.
Thanks.