
Downwards movement for Friday was expected by both hourly Elliott wave counts.
Summary: Downwards movement should continue on Tuesday (NY is closed for Labour day on Monday). How low this next move goes may tell us which hourly wave count is correct. A new low reasonably below 1,903.07 would favour the first hourly count which expects very strong downwards movement. Sideways movement is expected for the second hourly count before another wave down to show a decrease in momentum beyond the last wave which made the last low at 1,867. Both have the same invalidation point now at 1,975.01.
To view the last weekly chart click here.
Changes to last analysis are bold.
ELLIOTT WAVE COUNT
Click chart to enlarge.
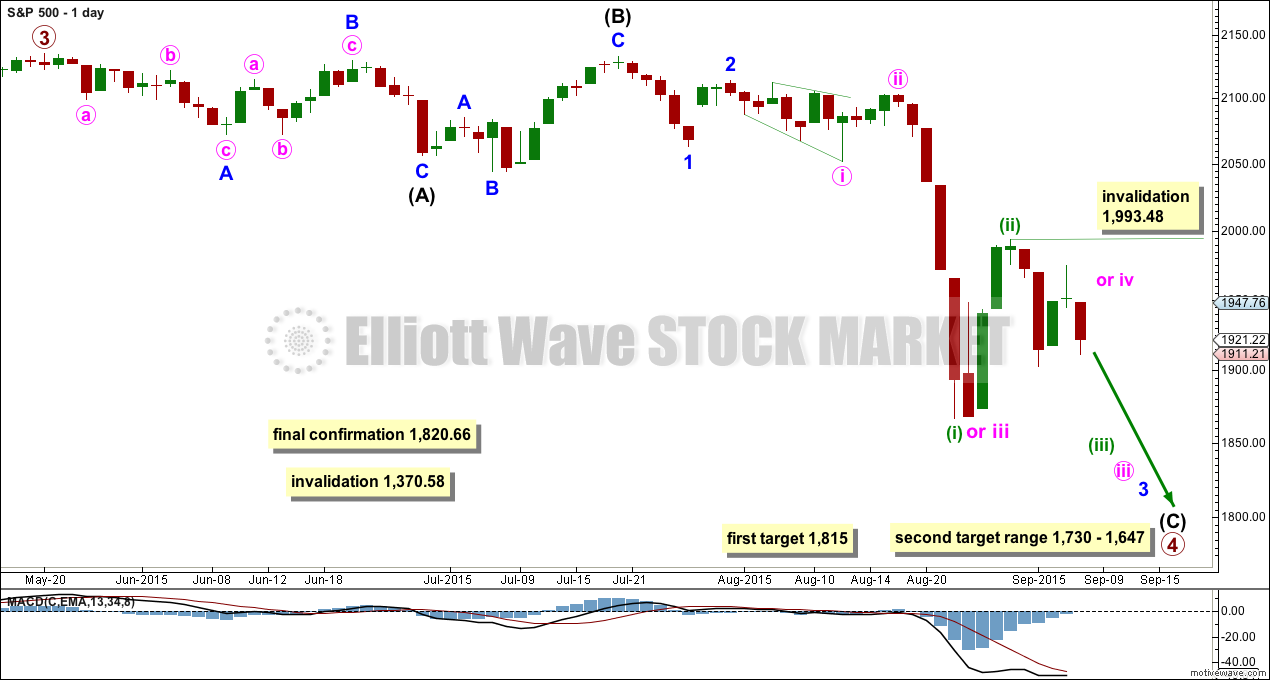
The S&P has seen a primary degree (or for the bear count below a Super Cycle degree) trend change.
Primary wave 2 was a relatively shallow 0.41 zigzag lasting 12 weeks. Primary wave 4 may be more shallow, most likely to be a flat, combination or triangle, and may be longer lasting than primary wave 2 as these types of sideways corrective structures tend to be more time consuming than zigzags. Primary wave 4 may complete in a total Fibonacci 21 weeks. Primary wave 4 ended its 15th week, but it may not exhibit a Fibonacci duration because the S&P does not reliably do this. Time estimates may only be taken as a very rough guide.
Primary wave 4 may reach down into the fourth wave of one lesser degree price range from 1,730 to 1,647, but it may not be that deep. It may end only about the 0.236 Fibonacci ratio of primary wave 3 at 1,815.
Within primary wave 4, it may be that intermediate waves (A) and (B) are both complete as three wave structures indicating a flat may be unfolding. Intermediate wave (C) down must be a five wave structure; it looks like it is unfolding as an impulse. For now I will leave this degree as is, but depending on where intermediate wave (C) ends I may move it back down one degree. It is also possible that only minor wave A may be unfolding as a flat correction.
If this impulse does not bring price down to the target range or the lower edge of the big channel on the weekly chart, then it may only be intermediate wave (A) of a bigger flat for primary wave 4. If it does bring price lower to the target range, then it may be primary wave 4 in its entirety.
This wave count now has some confirmation at the daily chart level with a close more than 3% of market value below the long held bull market trend line.
Full and final confirmation would come with:
1. A clear five down on the daily chart.
2. A new low below 1,820.66.
As each condition is met further confidence may be had in the bigger picture for this wave count.
Primary wave 4 may not move into primary wave 1 price territory below 1,370.58. Invalidation of this bull wave count (still bullish at cycle degree) would be confirmation of the bear wave count.
FIRST HOURLY ELLIOTT WAVE COUNT
Click chart to enlarge.
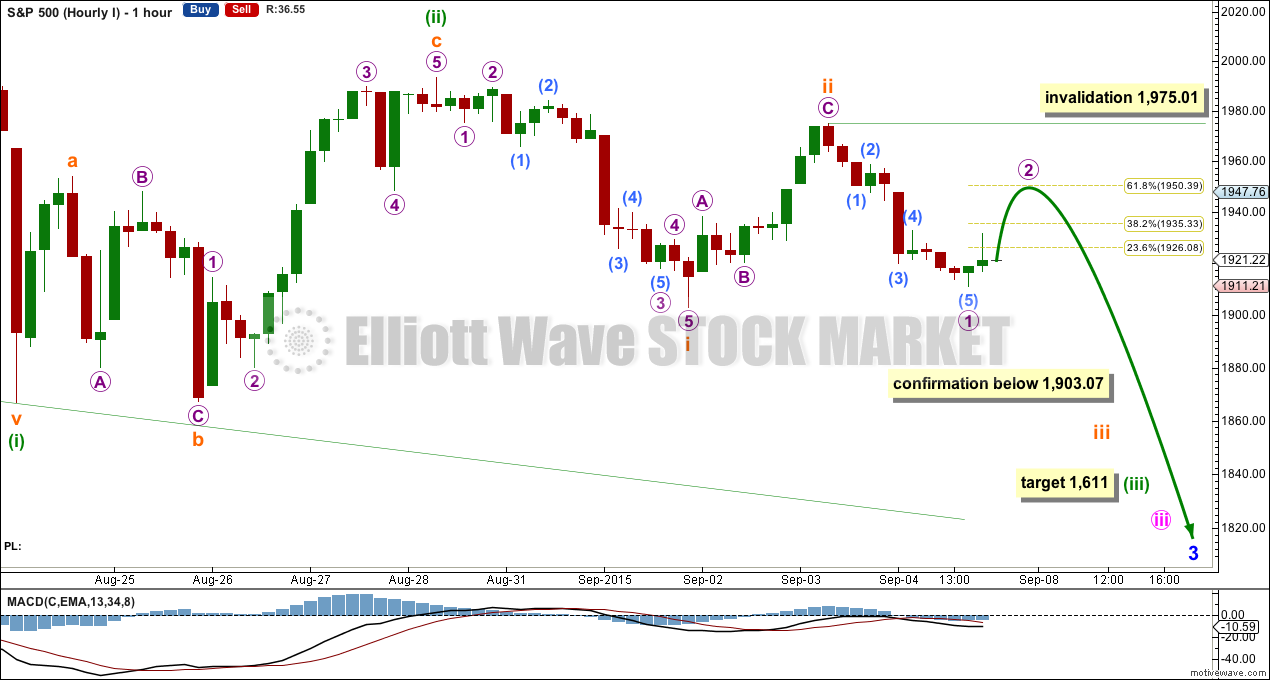
This first wave count has a problem with a breach of a base channel. The base channel drawn on this main hourly chart was breached by upwards movement. A lower degree second wave correction should not breach a base channel drawn about a first and second wave one or more degrees higher. This reduces the probability of this first wave count to about even with the second.
A new low short term below 1,903.07 would invalidate the second wave count and confirm this first wave count. At that stage, it would be expected that a strong middle of a third wave may be beginning to unfold downwards. At 1,611 minuette wave (iii) would reach 1.618 the length of minuette wave (i).
Downwards movement for Friday’s session subdivides so far as a complete five wave structure. Overall the last two waves down look best as fives while upwards waves look like threes. This supports this first wave count better than the second.
Micro wave 2 may not move beyond the start of micro wave 1 above 1,975.01.
Micro wave 2 is very unlikely to show up on the daily chart, and so this first wave count expects downwards movement and a red candlestick for Tuesday. Micro wave 2 may correct to about the 0.618 Fibonacci ratio of micro wave 1 at 1,950, this is a reasonable expectation, but it does not have to be this deep. This wave count now has a series of four overlapping first and second waves. There may now be enough of a strong downwards pull exerted by the middle of a big third wave to force micro wave 2 to be quicker and more shallow than second waves normally are.
SECOND HOURLY ELLIOTT WAVE COUNT
Click chart to enlarge.
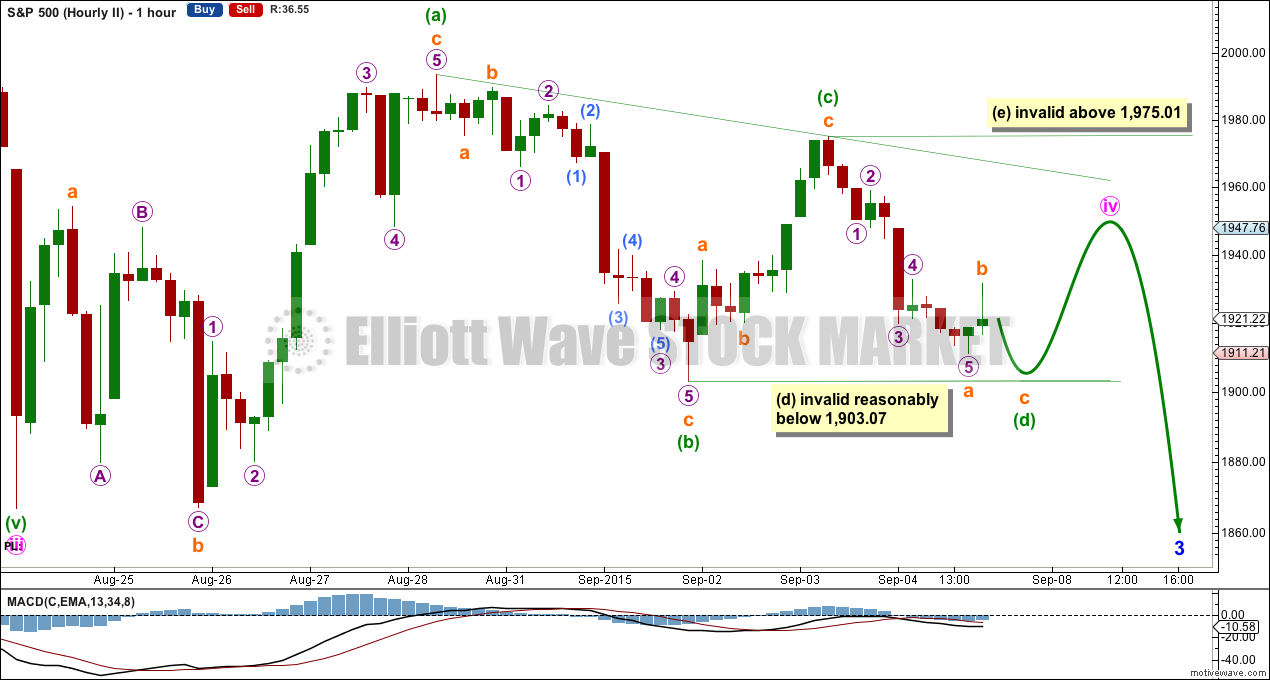
It is still possible that minute wave iii was over at the last low and subsequent upwards / sideways movement is minute wave iv.
Minute wave iv may be unfolding as a sideways regular contracting or barrier triangle. This would explain sideways movement for the last four days.
Within a triangle, four of the five sub waves must be zigzag or zigzag multiples. While triangles unfold MACD often (not always) hovers about the zero line, particularly as the triangle comes to an end. If we see more sideways movement in an ever narrow range for another few days and MACD stays about the zero line, then this will be the preferred wave count.
Within both a contracting and barrier triangle, minuette wave (e) may not move beyond the end of minuette wave (c) above 1,975.01. This upper invalidation point is black and white.
Within a contracting triangle, minuette wave (d) may not move beyond the end of minuette wave (b) below 1,903.07.
Within a barrier triangle, minuette wave (d) may end about the same level as minuette wave (b) at 1,903.07, so long as the (b)-(d) trend line is essentially flat. What this means in practice is (d) can end slightly below (b). For this reason, the lower invalidation point at 1,903.07 is not black and white.
It is also possible that minuette wave (b) is not over and could be continuing further sideways as a larger zigzag or double zigzag. But here minuette wave (b) is 0.71 of minuette wave (a), and from 0.618 to 0.8 the depth of the prior wave is a normal range for a triangle sub wave. Therefore, minuette wave (b) is very likely to be over here.
If a triangle completes over the next few trading days, then a downwards breakout when it is done is extremely likely for a fifth wave. If the triangle is a barrier triangle, then the fifth wave may be either very quick and short, or a very long extension. When the triangle is complete then it would be known where the fifth wave begins and a target for it to end could be calculated. That cannot be done yet.
At its end the triangle for minute wave iv may be only a shallow correction of minute wave iii. This would provide perfect alternation between the deep double zigzag of minute wave ii. Triangles do tend to be more time consuming structures than zigzags, so some difference in duration would be expected.
BEAR ELLIOTT WAVE COUNT
Click chart to enlarge.
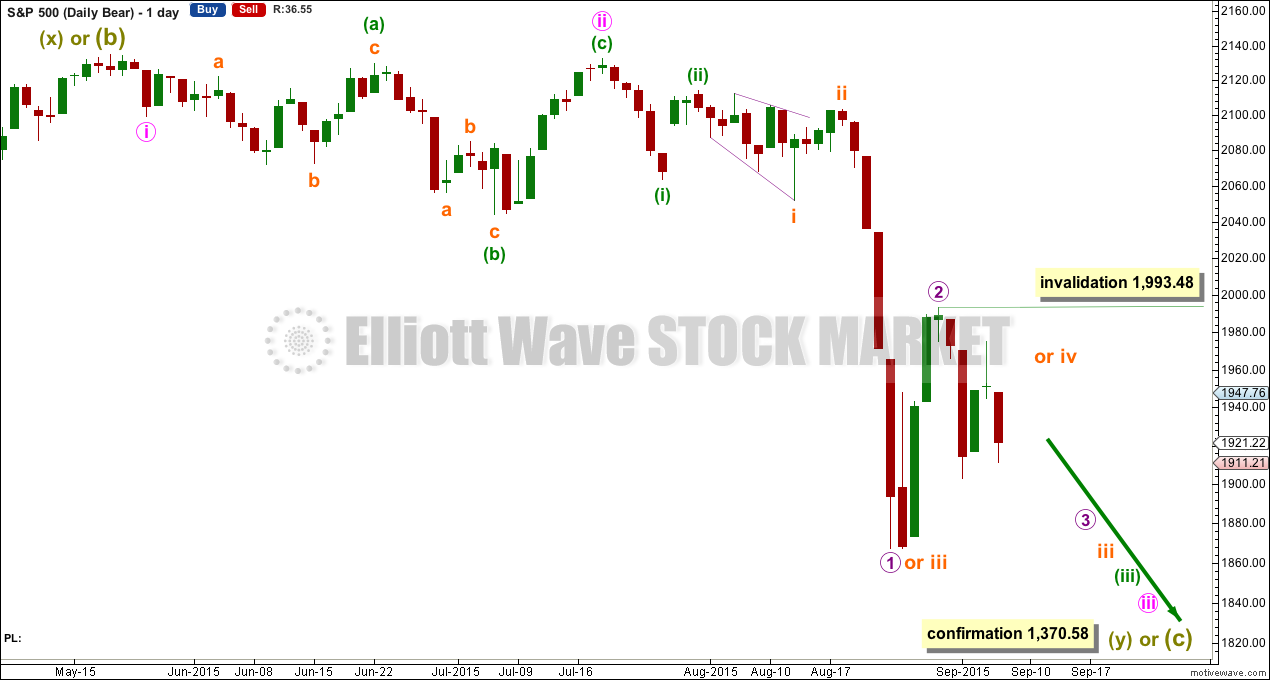
The subdivisions within cycle waves a-b-c are seen in absolutely exactly the same way as primary waves 1-2-3 for the main wave count.
In line with recent Grand Super Cycle wave analysis, I have moved the degree of labelling for the bear wave count all up one degree.
This bear wave count expects a Super Cycle wave (c) to unfold downwards for a few years, and if it is a C wave it may be devastating. It may end well below 666.79.
However, if this wave down is a Super Cycle wave (y), then it may be a time consuming repeat of the last big flat correction with two market crashes within it, equivalent to the DotCom crash and the recent Global Financial Crisis, and it may take another 8-9 years to unfold sideways.
For this bear wave count a big impulse down must begin, so a series of overlapping first and second waves should now be complete. The new idea for the first wave count does not work for this bear wave count.
A new low below 1,370.58 would invalidate the first wave count confirming a huge market crash. Before that price point is passed though, structure should be a strong indication that this bear wave count would be correct. It is supported by regular technical analysis at the monthly chart level.
TECHNICAL ANALYSIS
Click chart to enlarge. Chart courtesy of StockCharts.com.
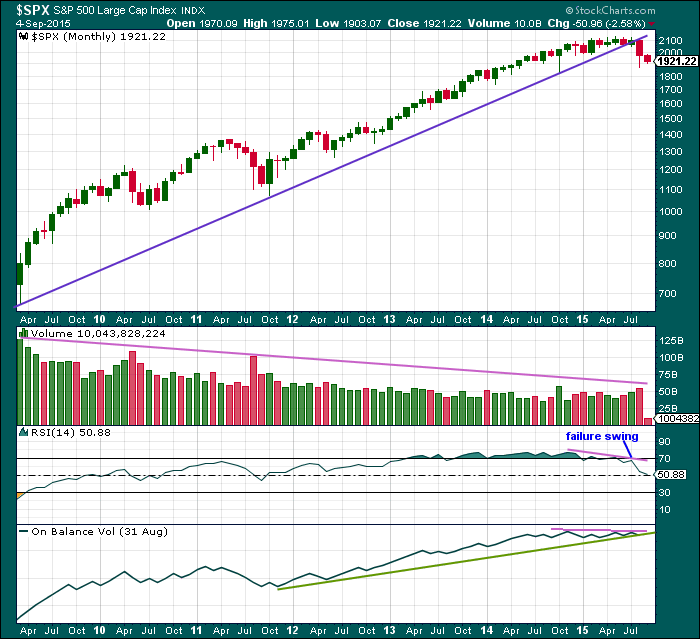
Monthly Chart: A long held trend line from the end of the big low at 666.79 in March 2009, to the next big swing low at 1,074.77 in October 2011, has been breached and now provides resistance.
Volume has been falling during this bull market spanning six years and five months. This rise in price is not supported by volume, so is suspicious at the monthly chart level.
During the bull market of the last six and a half years, the majority of downwards corrections saw a decline in volume at the monthly chart level as the final low was reached. At this time, there is no decline in volume; the fall in price is supported by a rise in volume at the monthly chart level which indicates the downwards movement is probably not over yet.
Back to November 2014, there is now double negative divergence between price and RSI at the end of this movement. This pattern was last seen just prior to the DotCom crash and the GFC. In both of those instances there was also a failure swing by RSI, which appears here too.
On Balance Volume shows slight negative divergence with price. OBV is coming to touch its long held green trend line. If OBV breaches that trend line, then the regular TA picture will be even more bearish.
At the monthly chart level, this regular technical analysis favours the bear wave count
The last two bear markets for the S&P, that of the Dotcom crash from September 2000, to October 2002, and the Global Financial Crisis from October 2007, to March 2009, were reliably indicated as complete by RSI on the weekly and monthly chart. I will use this indicator this time to see when this bear market could be complete.
As each of those last two bear markets ended, RSI showed oversold on the monthly chart level plus had one divergence with the final month: as price moved lower RSI turned up. That was the end.
So far RSI is nowhere near oversold. There is plenty of room for price to fall.
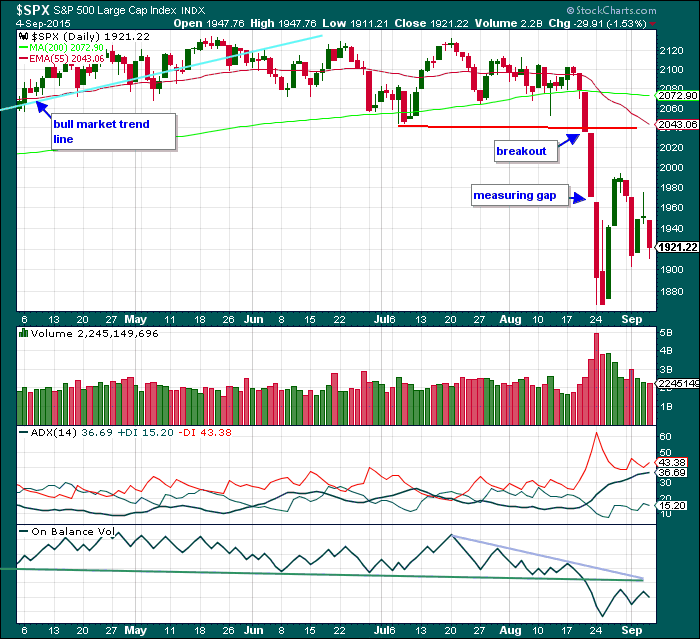
Click chart to enlarge. Chart courtesy of StockCharts.com.
Daily Chart: Friday’s red candlestick comes on lower volume. If Friday’s movement was part of a correction, then that would expect lower volume. Corrections should unfold with declining volume. This supports the second hourly wave count.
Again, there is nothing bullish about this picture at all. All regular technical analysis indicators plus the Elliott wave count are bearish.
ADX continues to agree. The black ADX line continues to rise and the red -DX line is above the green +DX line indicating there is a strengthening trend and it is down.
On Balance Volume is bearish while it remains below the green trend line.
A note on Dow Theory: for the bear wave count I would wait for Dow Theory to confirm a huge market crash. So far the industrials and the transportation indices have made new major swing lows, but the S&P500 and Nasdaq have not.
S&P500: 1,820.66
Nasdaq: 4,116.60
DJT: 7,700.49 – this price point was breached.
DJIA: 15,855.12 – this price point was breached.
This analysis is published about 12:05 a.m. EST.
Futures suggest coordinated central bank buying in both US and EU markets. The dramatic reversal in the China markets leaves no doubt that there was also intervention there. It is an act of sheer desperation indicating wave two up probably already under way and leading to an absolutely perfect set-up for wave three…this going to be the mother of all bull traps I think.
Vernecarty, how high does this correction go?
In my humble opinion, we go up to 1980.
One unusual Elliott wave rule, though it rarely happens, is that a second wave can actually retrace 100% of a first wave. While I don’t think this is going to happen, if this is indeed a second wave of higher degree exceeding
1975.01, I think it is going to be very deep; deep enough to convince everyone the bull is back. I realize that in this case the rally could continue all week but I am shorting the bounce. I don’t think you want to be long this market going into this weekend. This may be the market’s last gasp effort to stay aloft, courtesy central bankers of the world united… ;D
There is an AAPL event tomorrow. AAPL will sell hard after the news. The indexes will follow…
Probably right. AAPL has been a great candidate for bearish call credit spreads….
Ilia, so you are saying SP 500 corrects up to about 1980 before AAPL bad news ?
I’ve seen this happen on EURUSD, and it actually stopped me out for a huge loss (this happened years ago).
So yes, it can happen, I’ve learned that lesson the hardest way.
Is it possible that we may actually have a completed impulse down at least minor degree? I realize we would have to see the fifth as truncated but there are some cycle considerations that would fit well with a massive third wave decline for the coming week.
It’s possible. The truncation would be pretty big though, 36.06 points.
But it would be a truncation which came after a third wave which moved “too far too fast”.
Still, I just don’t know if I can handle such a big truncation. I will keep this possibility in mind and mention it in the analysis, but I think I would only want to actually publish it if it proves itself to be true. I’ll figure out exactly which price point that would be at.