
The Dead Cat Bounce continues.
Summary: A Dead Cat Bounce is most likely still unfolding and may now end on Monday (Tuesday at the latest). The bounce looks more likely to be another deep second wave correction, so the next wave down may be more explosive than the last. A target for this upwards correction to end is at 2,005 – 2,008.
To view the last weekly chart click here.
Changes to last analysis are bold.
ELLIOTT WAVE COUNT
Click chart to enlarge.
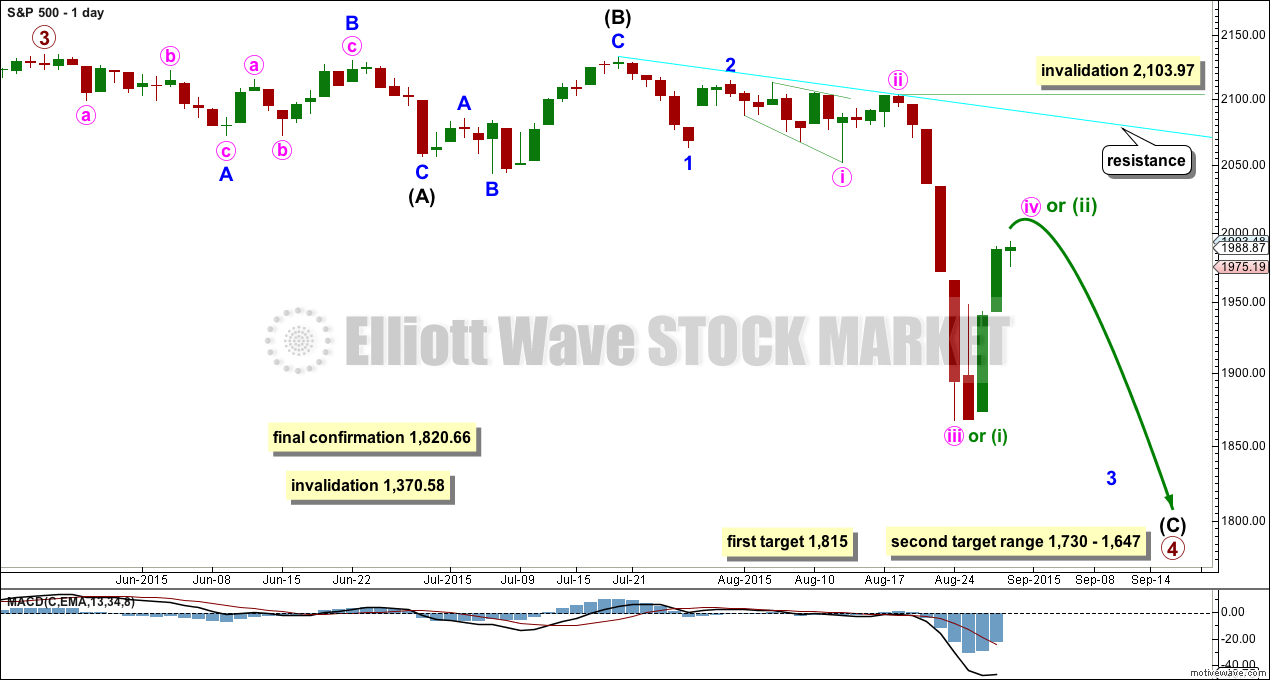
The S&P has seen a primary degree (or for the bear count below a Super Cycle degree) trend change.
Primary wave 2 was a relatively shallow 0.41 zigzag lasting 12 weeks. Primary wave 4 may be more shallow, most likely to be a flat, combination or triangle, and may be longer lasting than primary wave 2 as these types of sideways corrective structures tend to be more time consuming than zigzags. Primary wave 4 may complete in a total Fibonacci 21 weeks. So far primary wave 4 has just completed its 14th week, but it may not exhibit a Fibonacci duration because the S&P does not reliably do this. Time estimates may only be taken as a very rough guide.
Primary wave 4 may reach down into the fourth wave of one lesser degree price range from 1,730 to 1,647, but it may not be that deep. It may end only about the 0.236 Fibonacci ratio of primary wave 3 at 1,815.
Within primary wave 4, it may be that intermediate waves (A) and (B) are both complete as three wave structures indicating a flat may be unfolding. Intermediate wave (C) down must be a five wave structure; it looks like it is unfolding as an impulse. For now I will leave this degree as is, but depending on where intermediate wave (C) ends I may move it back down one degree. It is also possible that only minor wave A may be unfolding as a flat correction.
If this impulse does not bring price down to the target range or the lower edge of the big channel on the weekly chart, then it may only be intermediate wave (A) of a bigger flat for primary wave 4. If it does bring price lower to the target range, then it may be primary wave 4 in its entirety.
Sideways movement on the hourly chart looks like minute wave iv has arrived. Because minute wave ii shows up clearly on the daily chart, I would expect minute wave iv to also take a few days and show up. This would give the impulse for minor wave 3 the “right look”. Minute wave iv may not move into minute wave i price territory above 2,052.09.
This wave count now has some confirmation at the daily chart level with a close more than 3% of market value below the long held bull market trend line.
Full and final confirmation would come with:
1. A clear five down on the daily chart.
2. A new low below 1,820.66.
As each condition is met further confidence may be had in the bigger picture for this wave count.
Primary wave 4 may not move into primary wave 1 price territory below 1,370.58. Invalidation of this bull wave count (still bullish at cycle degree) would be confirmation of the bear wave count.
MAIN HOURLY ELLIOTT WAVE COUNT
Click chart to enlarge.
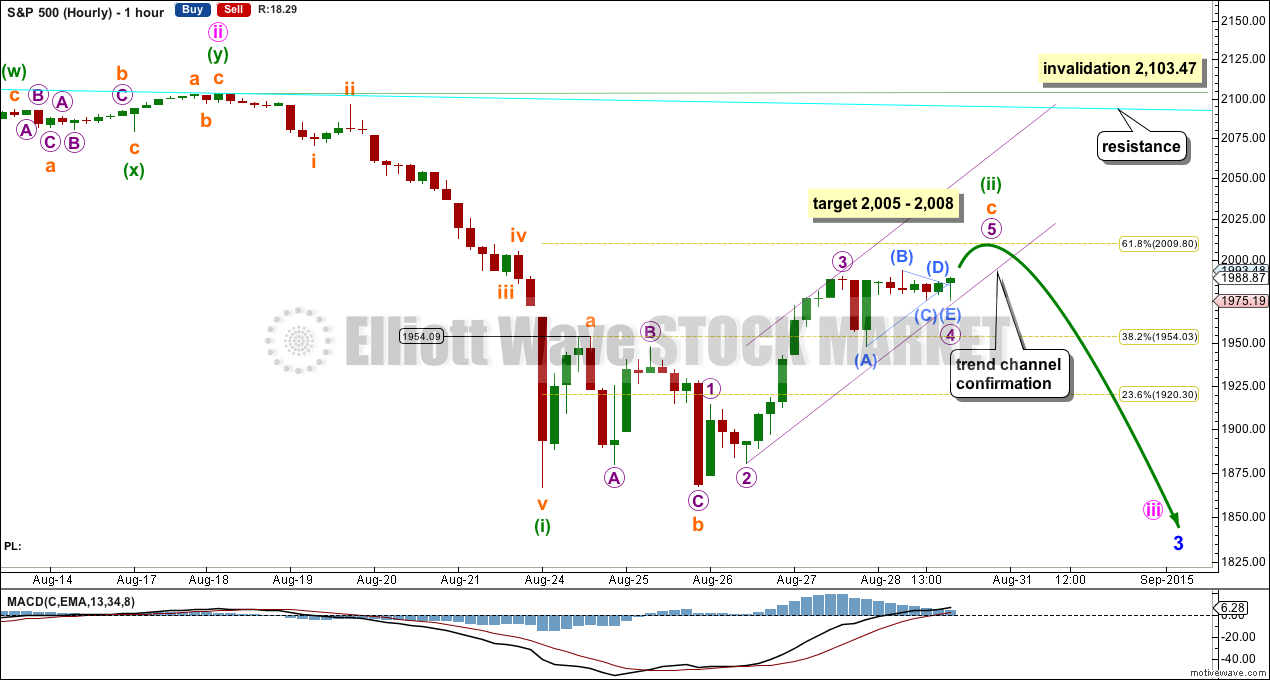
There are still the same two possibilities for this upwards correction, either another deep second wave or a fourth wave.
Today I will swap the two ideas over and favour a deep second wave. This decision is based on structure and depth.
Here minuette wave (ii) may be seen as a zigzag (subminuette wave a up is ambiguous; it may subdivide as either a three or a five on the five minute chart). Within the zigzag, subminuette wave c is longer than subminuette wave a and would reach 1.618 the length of subminuette wave a at 2,008, just below the 0.618 Fibonacci ratio of minuette wave (i).
At 2,005 micro wave 5 would reach 0.618 the length of micro wave 1.
Within subminuette wave c, sideways movement for Friday fits as a contracting triangle for a fourth wave. This illustrates why trend channels need to be breached by downwards movement, not sideways. Sometimes fourth waves aren’t contained within trend channels, and that’s why Elliott had a second technique to redraw the channel when a fourth wave breaches it.
Redraw the channel using Elliott’s second technique: draw the first trend line from the ends of micro waves 2 to 4 then place a parallel copy on the end of micro wave 3. Expect micro wave 5 to end midway within that channel. When that channel is breached by downwards movement, then it shall provide earliest confirmation that minuette wave (ii) is most likely over and the middle of a strong third wave may have begun.
To eliminate the possibility of a new upwards trend beginning with a five wave impulse, if we see a new low below 1,954.09, then that could not be a fourth wave correction (it would overlap into its counterpart first wave price territory) and a new low below that point would confirm the last move up as a three and as complete.
When I know where minuette wave (ii) has ended, then I know where minuette wave (iii) begins. At that stage, I will calculate targets for minuette wave (iii). I cannot do that yet.
If the next wave down shows a strong increase in momentum beyond the last wave down labelled minuette wave (i), then I would discard the alternate hourly wave count below.
ALTERNATE HOURLY ELLIOTT WAVE COUNT
Click chart to enlarge.
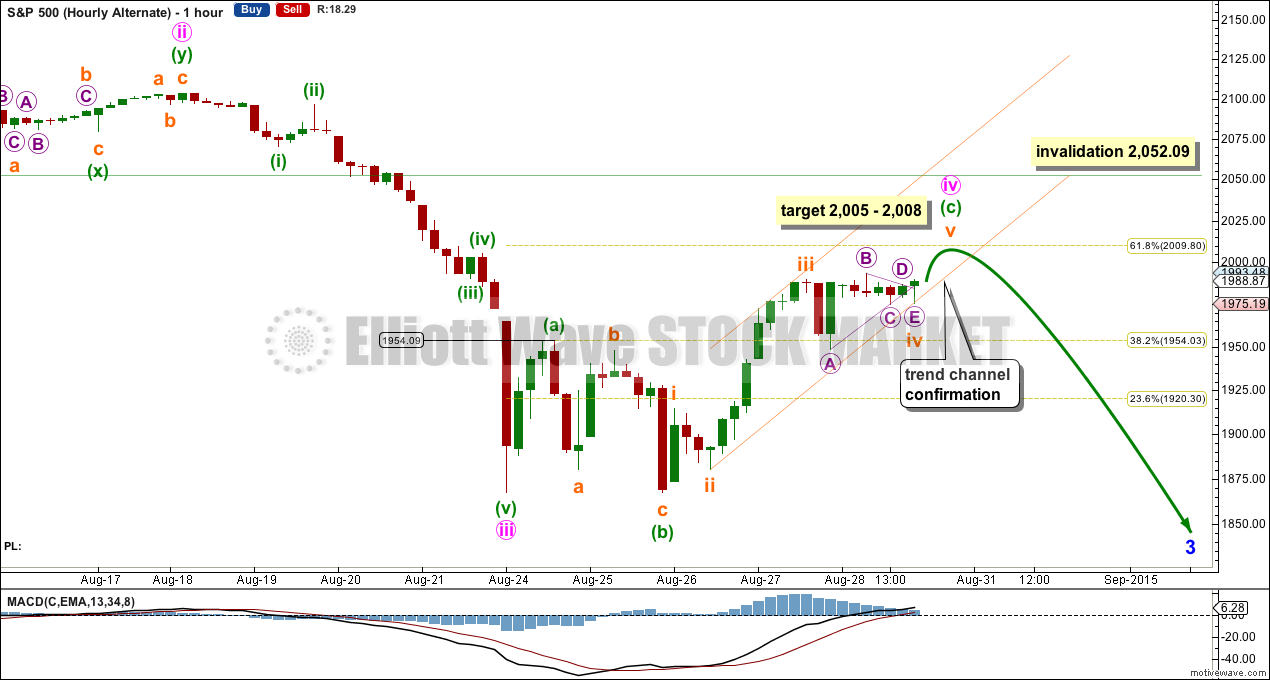
It remains possible that this upwards movement is a fourth wave because it remains below first wave price territory at 2,052.09. However, there is not enough alternation in depth of correction between minute waves ii and iv. Minute wave ii was deep at 0.83 of minute wave i. Minute wave iv is now also deep, closing in on the 0.618 Fibonacci ratio of minute wave iii.
There is a problem with structure here too. Minute wave ii was a double zigzag. Minute wave iv is highly unlikely to be a single or multiple zigzag; there would be inadequate alternation with structure of minute wave ii. Minute wave iv may technically fit as a regular flat correction, because within this upwards movement minuette wave (a) may subdivide as a three on the five minute chart and minuette wave (b) is over 90% the length of minuette wave (a) meeting the rules for a flat correction.
The problem is in the length of minuette wave (c). This would be a regular flat, because minuette wave (b) is less than 110% the length of minuette wave (a), and regular flats normally fit nicely within their channels and normally have C waves which are close to even in length with their A waves. This one is too long to look like a normal regular flat.
Because of these problems, I judge this alternate today to have a lower probability than the main hourly wave count. This is important in figuring out what should happen next. It is less likely that the next wave down will exhibit a slowing of momentum for a fifth wave than it is to exhibit highly explosive movement as the middle of a third wave.
Minute wave iv may not move into minute wave i price territory above 2,052.09.
BEAR ELLIOTT WAVE COUNT
Click chart to enlarge.
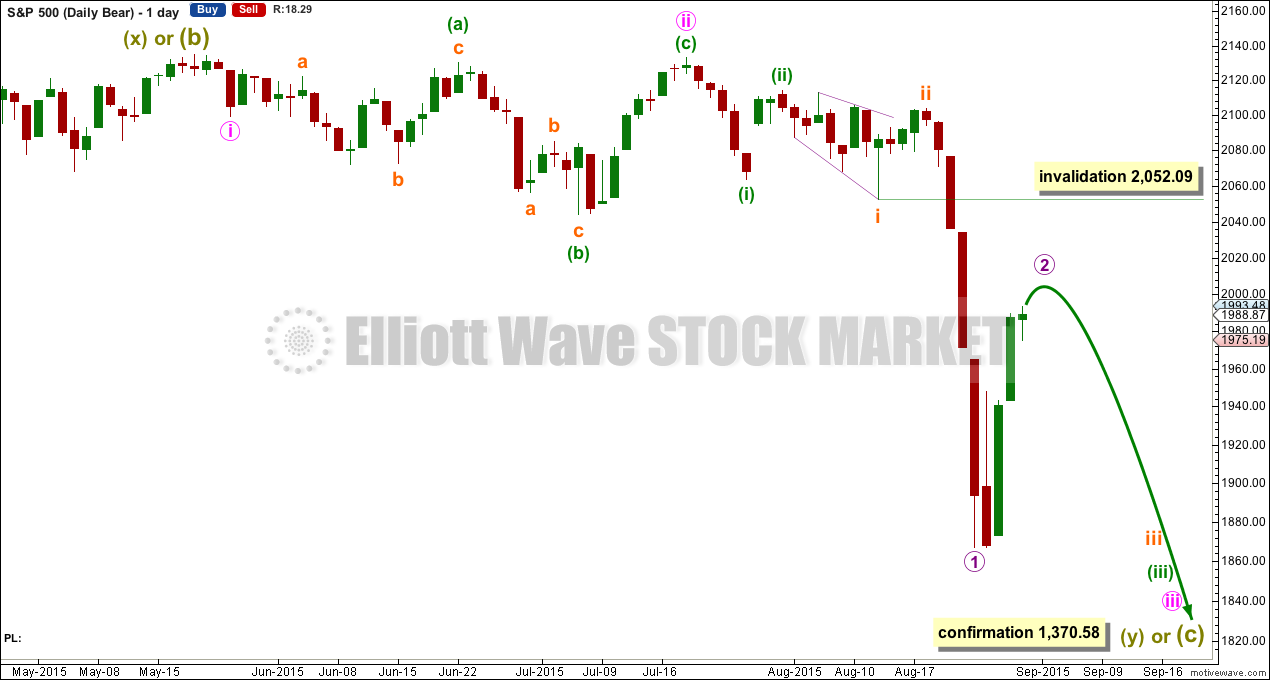
The subdivisions within cycle waves a-b-c are seen in absolutely exactly the same way as primary waves 1-2-3 for the main wave count.
In line with recent Grand Super Cycle wave analysis, I have moved the degree of labelling for the bear wave count all up one degree.
This bear wave count expects a Super Cycle wave (c) to unfold downwards for a few years, and if it is a C wave it may be devastating. It may end well below 666.79.
However, if this wave down is a Super Cycle wave (y), then it may be a time consuming repeat of the last big flat correction with two market crashes within it, equivalent to the DotCom crash and the recent Global Financial Crisis, and it may take another 8-9 years to unfold sideways.
For this bear wave count a big impulse down must begin, so a series of overlapping first and second waves should now be complete. The new idea for the first wave count does not work for this bear wave count.
A new low below 1,370.58 would invalidate the first wave count confirming a huge market crash. Before that price point is passed though, structure should be a strong indication that this bear wave count would be correct. It is supported by regular technical analysis at the monthly chart level.
TECHNICAL ANALYSIS
Click chart to enlarge. Chart courtesy of StockCharts.com.
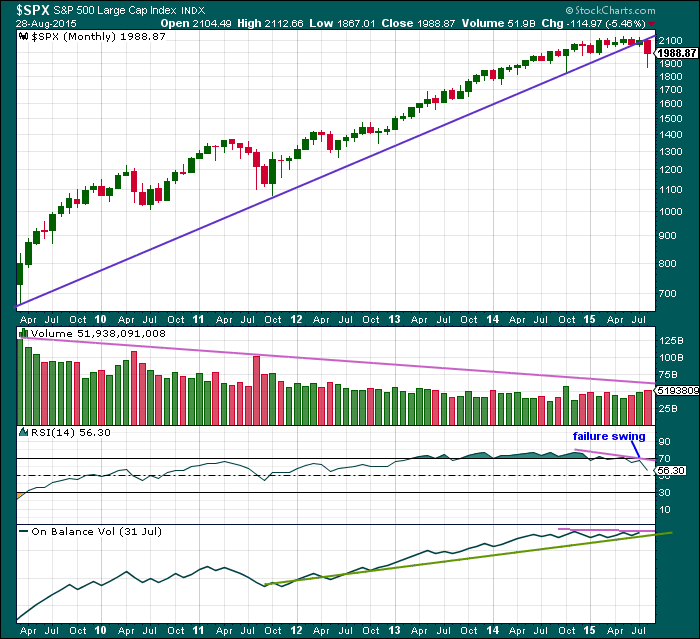
Monthly Chart: A long held trend line from the end of the big low at 666.79 in March 2009, to the next big swing low at 1,074.77 in October 2011, has been breached and now provides resistance.
Volume has been falling during this bull market spanning six years and five months. This rise in price is not supported by volume, so is suspicious at the monthly chart level.
Back to November 2014, there is now double negative divergence between price and RSI at the end of this movement. This pattern was last seen just prior to the DotCom crash and the GFC. In both of those instances there was also a failure swing by RSI, which appears here too.
On Balance Volume shows slight negative divergence with price.
At the monthly chart level, this regular technical analysis favours the bear wave count
The last two bear markets for the S&P, that of the Dotcom crash from September 2000, to October 2002, and the Global Financial Crisis from October 2007, to March 2009, were reliably indicated as complete by RSI on the weekly and monthly chart. I will use this indicator this time to see when this bear market could be complete.
As each of those last two bear markets ended, RSI showed oversold on the monthly chart level plus had one divergence with the final month: as price moved lower RSI turned up. That was the end.
So far RSI is nowhere near oversold. There is plenty of room for price to fall.
Click chart to enlarge. Chart courtesy of StockCharts.com.
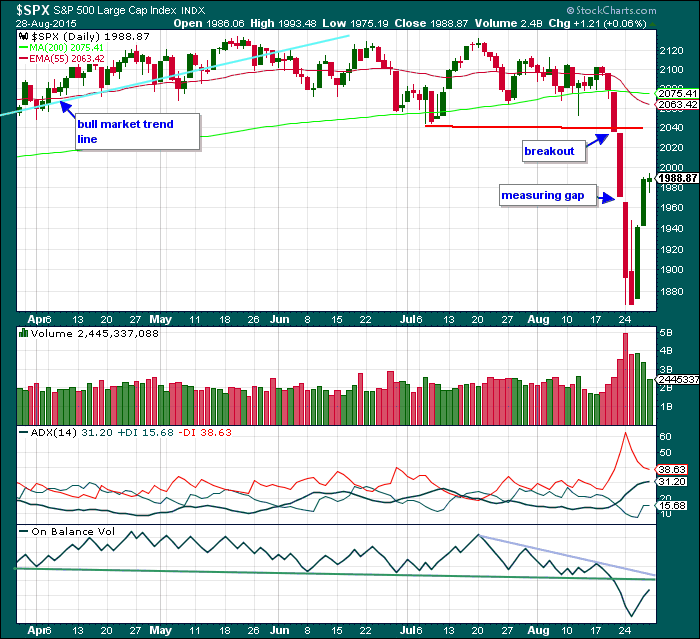
Daily Chart: A green daily candlestick again comes on declining volume. The rise in price is not supported by volume and is suspicious. Volume at the daily chart level this week strongly favours a bear market: volume rises as price falls and volume falls as price rises.
ADX is still very slightly pointing upwards and the -DX line is still above the +DX line. There is still a trend and it is still downwards.
On Balance Volume remains below its green trend line. That line should provide resistance and may be the most useful indicator to show when this Dead Cat Bounce ends. If OBV comes up to touch that trend line, then it may end there.
A note on Dow Theory: for the bear wave count I would wait for Dow Theory to confirm a huge market crash. So far the industrials and the transportation indices have made new major swing lows, but the S&P500 and Nasdaq have not.
S&P500: 1,820.66
Nasdaq: 4,116.60
DJT: 7,700.49 – this price point was breached.
DJIA: 15,855.12 – this price point was breached.
This analysis is published about 6:58 p.m. EST.
VIX has probably seen its lows for quite a while. Price action seems to be saying that we have not put in an intermediate low. There also is a sea change in the way the futures of the index are behaving in that they keep rising along with price action as opposed to declining as is usually the case. Something big is afoot methinks…
Lara any chance this violent move downward get us set up for a horrible Black Tuesday after Labor Day. Vernecarty I think you’re absolutely right about UVXY trading over a few hundreds if we hit our target of 1700 in the s&p. TVIX and UVXY seem to triple on every leg down.
That’s entirely possible. Although, I’m not sure which Labour day you’re referring to?
Next monday is Labor day for the US which should make a very interesting long weekend.
Ah, thank you.