
A small bounce completed a small fourth wave correction while price moved lower.
The wave count is unfolding mostly as expected, but targets continue to be inadequate.
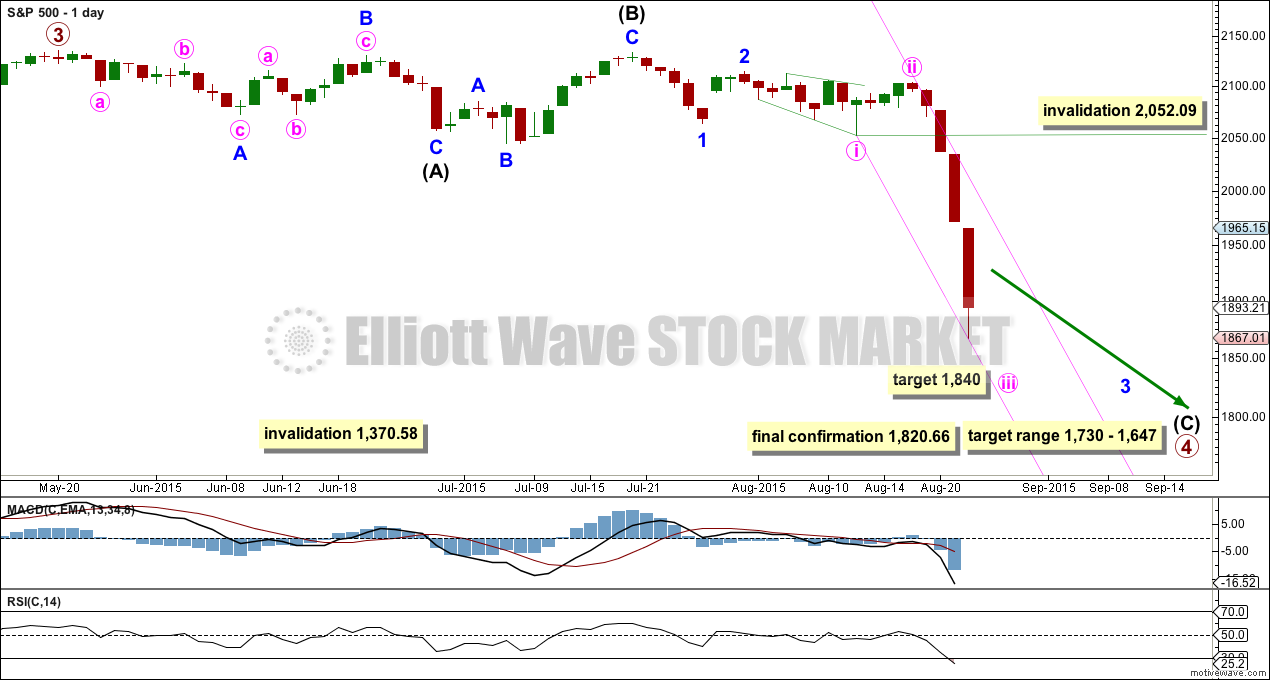
Summary: A target for this third wave to end is at 1,840 which may be met tomorrow. The following fourth wave correction should last a few days and move price sideways, but may not move above 2,052.09.
To view the last weekly chart click here.
Changes to last analysis are bold.
ELLIOTT WAVE COUNT
Click chart to enlarge.
The S&P has seen a primary degree (or for the bear count below a Super Cycle degree) trend change.
Primary wave 2 was a relatively shallow 0.41 zigzag lasting 12 weeks. Primary wave 4 may be more shallow, most likely to be a flat, combination or triangle, and may be longer lasting than primary wave 2 as these types of sideways corrective structures tend to be more time consuming than zigzags. Primary wave 4 is likely to end in the price territory of the fourth wave of one lesser degree between 1,730 – 1,647. It may last about 21 or maybe now even 34 weeks.
Within primary wave 4, it may be that intermediate waves (A) and (B) are both complete as three wave structures indicating a flat may be unfolding. Intermediate wave (C) down must be a five wave structure; it looks like it is unfolding as an impulse. For now I will leave this degree as is, but depending on where intermediate wave (C) ends I may move it back down one degree. It is equally as likely that only minor wave A may be unfolding as a flat correction.
If this impulse does not bring price down to the target range or the lower edge of the big channel on the weekly chart, then it may only be intermediate wave (A) of a bigger flat for primary wave 4. If it does bring price lower to the target range, then it may be primary wave 4 in its entirety.
Within minor wave 3, minute wave iv may not move into minute wave i price territory above 2,052.09.
At 1,840 minute wave iii would reach 4.236 the length of minute wave i. I have a little more confidence in this target now.
This wave count now has some confirmation at the daily chart level with a close more than 3% of market value below the long held bull market trend line.
Full and final confirmation would come with:
1. A clear five down on the daily chart.
2. A new low below 1,820.66.
As each condition is met further confidence may be had in the bigger picture for this wave count.
Minor wave 3 should show its subdivisions clearly on the daily chart. Minor wave 3 still has to show a further increase in downwards momentum beyond that seen for minor wave 1 for it to have a typical third wave look.
Primary wave 4 may not move into primary wave 1 price territory below 1,370.58. Invalidation of this bull wave count (still bullish at cycle degree) would be confirmation of the bear wave count.
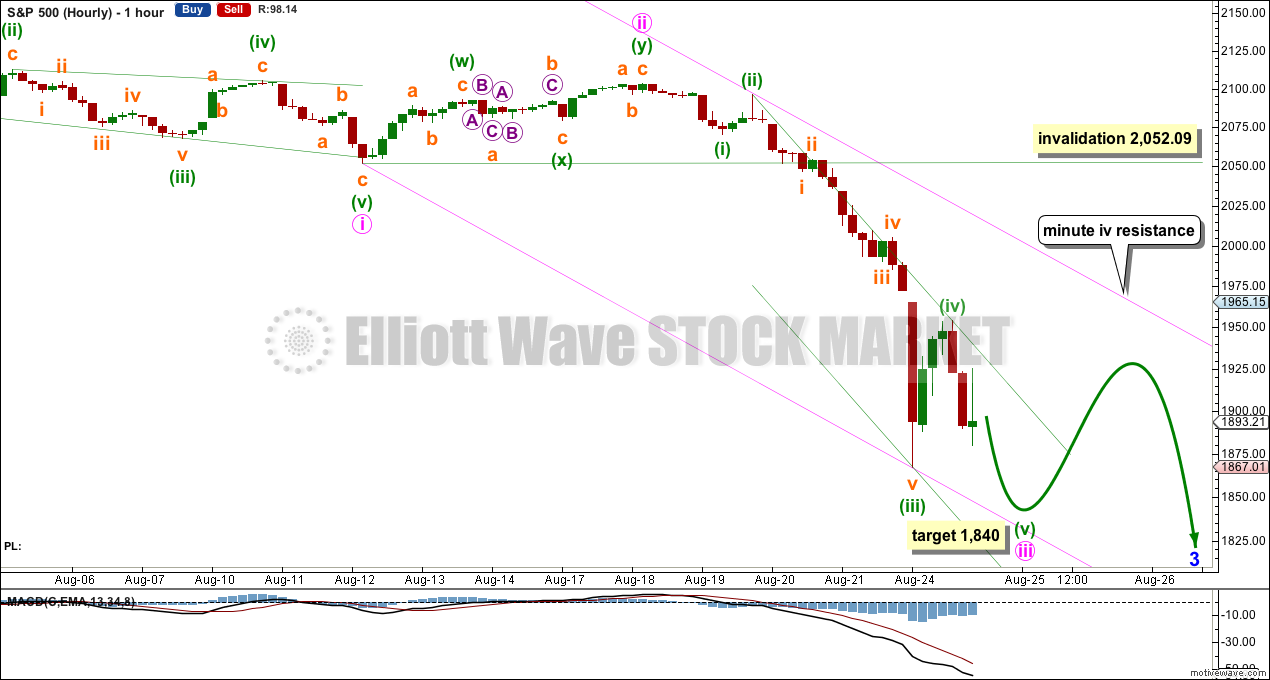
Click chart to enlarge.
Minute wave iii must unfold as an impulse. Within minute wave iii, minuette wave (iii) is most likely complete and just 3.39 points short of 6.854 the length of minuette wave (i). An unusual Fibonacci ratio but mathematically accurate.
Because there is already a close Fibonacci ratio between minuette waves (i) and (iii), we may not see a Fibonacci ratio between minuette wave (v) and either of (i) or (iii). Minute degree would be the best degree to calculate a target for minute wave iii to end.
Minuette wave (ii) was a deep 0.78 single zigzag which did not show up on the daily chart. Minuette wave (iv) exhibits some alternation as a shallow 0.38 double zigzag. Despite inadequate alternation in structure, it is still likely to be over because if it continues it may show up on the daily chart, which would not give minute wave iii the right look at the daily chart level.
Draw a channel about minute wave iii (green narrow): draw the first trend line from the highs of minuette waves (ii) to (iv) then place a parallel copy on the low of minuette wave (iii). Minuette wave (v) may end midway within the channel. When that channel is breached that shall be confirmation that minute wave iii is over and minute wave iv is underway.
Draw also an acceleration channel about minute wave iii (pink wide): draw the first trend line from the end of minute wave i to the last low (keep redrawing this channel as price continues lower) then place a parallel copy on the end of minuette wave (ii) to contain all this movement. Minute wave iv, if it is time consuming enough, may find resistance at the upper edge of that channel.
If the target at 1,840 is met tomorrow, then minute wave iii may end in a total Fibonacci five sessions. Minute wave ii shows up on the daily chart as a deep zigzag lasting four days. Minute wave iv may be shallow (as measured against minute wave iii) ending within the price territory of the fourth wave of one lesser degree between 1,867 to 1,954. Minute wave iv may be a flat, combination or triangle most likely and these tend to be more time consuming structures, so it may last a Fibonacci eight days.
Minute wave iv may not move into minute wave i price territory above 2,052.09.
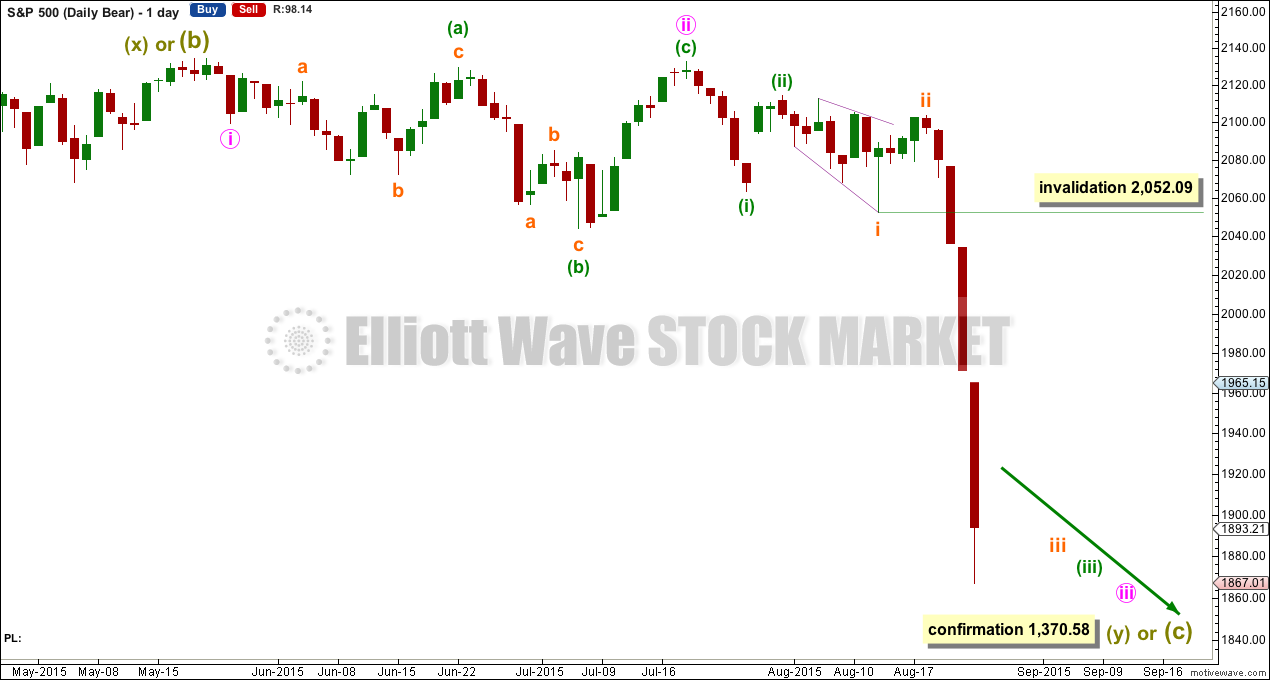
BEAR ELLIOTT WAVE COUNT
Click chart to enlarge.
The subdivisions within cycle waves a-b-c are seen in absolutely exactly the same way as primary waves 1-2-3 for the main wave count.
In line with recent Grand Super Cycle wave analysis, I have moved the degree of labelling for the bear wave count all up one degree.
This bear wave count expects a Super Cycle wave (c) to unfold downwards for a few years, and if it is a C wave it may be devastating. It may end well below 666.79.
However, if this wave down is a Super Cycle wave (y), then it may be a time consuming repeat of the last big flat correction with two market crashes within it, equivalent to the DotCom crash and the recent Global Financial Crisis, and it may take another 8-9 years to unfold sideways.
For this bear wave count a big impulse down must begin, so a series of overlapping first and second waves should now be complete. The new idea for the first wave count does not work for this bear wave count.
A new low below 1,370.58 would invalidate the first wave count confirming a huge market crash. Before that price point is passed though, structure should be a strong indication that this bear wave count would be correct. It is supported by regular technical analysis at the monthly chart level.
TECHNICAL ANALYSIS
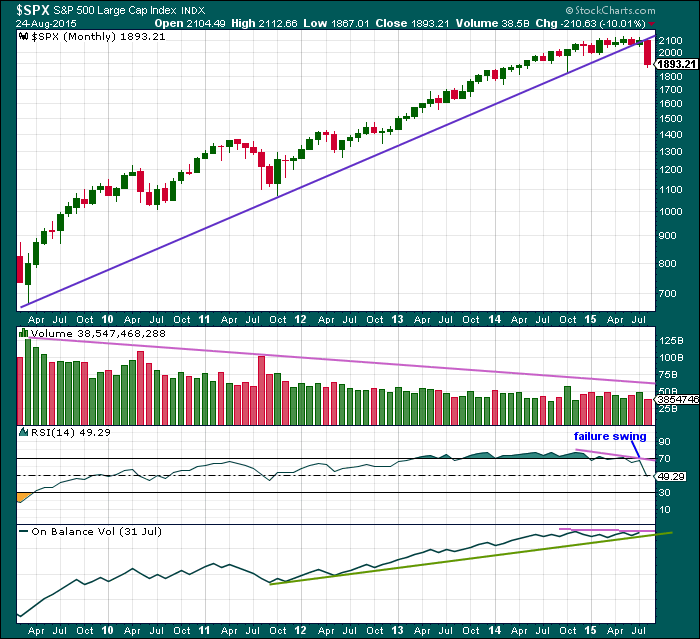
Click chart to enlarge. Chart courtesy of StockCharts.com.
Monthly Chart: A long held trend line from the end of the big low at 666.79 in March 2009, to the next big swing low at 1,074.77 in October 2011, has been breached and now provides resistance.
Volume has been falling during this bull market spanning six years and five months. This rise in price is not supported by volume, so is suspicious at the monthly chart level.
Back to November 2014, there is now double negative divergence between price and RSI at the end of this movement. This pattern was last seen just prior to the DotCom crash and the GFC. In both of those instances there was also a failure swing by RSI, which appears here too.
On Balance Volume shows slight negative divergence with price.
At the monthly chart level, this regular technical analysis favours the bear wave count
The last two bear markets for the S&P, that of the Dotcom crash from September 2000, to October 2002, and the Global Financial Crisis from October 2007, to March 2009, were reliably indicated as complete by RSI on the weekly and monthly chart. I will use this indicator this time to see when this bear market could be complete.
As each of those last two bear markets ended, RSI showed oversold on the monthly chart level plus had one divergence with the final month: as price moved lower RSI turned up. That was the end.
So far RSI is nowhere near oversold. There is plenty of room for price to fall.
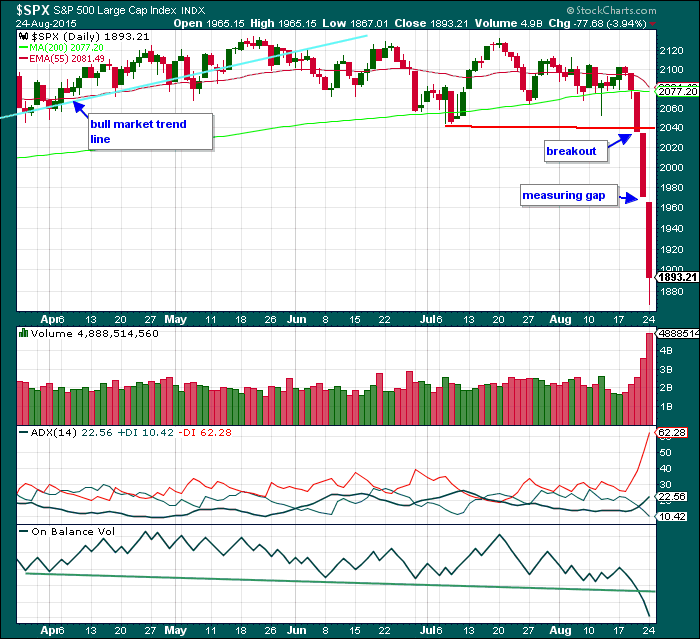
Click chart to enlarge. Chart courtesy of StockCharts.com.
Daily Chart: Another strong downwards day comes on higher volume; the fall in price continues to be supported by volume and is not suspicious at all. The open today gapped lower, which was most likely a measuring (or runaway) gap. Price has reached below the measurement taken by the gap fulfilling its prophecy already for the market to continue to move in the same direction about the same length as that between the breakout and the gap. Although this gap may be filled, it is not true that all measuring gaps are filled and it should not be necessarily expected.
ADX continues to indicate that there is a trend and it is down. There is plenty of room for ADX to strengthen.
On Balance Volume has broken below its trend line. The next correction may be a Dead Cat Bounce which may see OBV find resistance at that trend line. This may be a useful indicator to show when the bounce may end.
A note on Dow Theory: for the bear wave count I would wait for Dow Theory to confirm a huge market crash. So far the industrials and the transportation indices have made new major swing lows, but the S&P500 and Nasdaq have not.
S&P500: 1,820.66
Nasdaq: 4,116.60
DJT: 7,700.49 – today this price point was breached.
DJIA: 15,855.12 – today this price point was breached.
This analysis is published about 11:19 p.m. EST.
Chinese announced a rate cut. The second wave rally will almost certainly be juiced by the Fed making some sort of dovish pronouncement at the Jackson Hole meeting. This re-tracement is probably going to be very deep with VIX hitting new lows. Ya’ll know what to do….it will be a once in a decades opportunity ….