
Yesterday’s first Elliott wave count, which was favoured, expected “explosive movement towards the downside” for Thursday. This is what happened.
Summary: The second Elliott wave count is now invalid and must be discarded. The first Elliott wave count expects downwards movement to continue. The next target for an interruption is about 2,002.
Changes to last analysis are bold.
ELLIOTT WAVE COUNT
Click chart to enlarge.
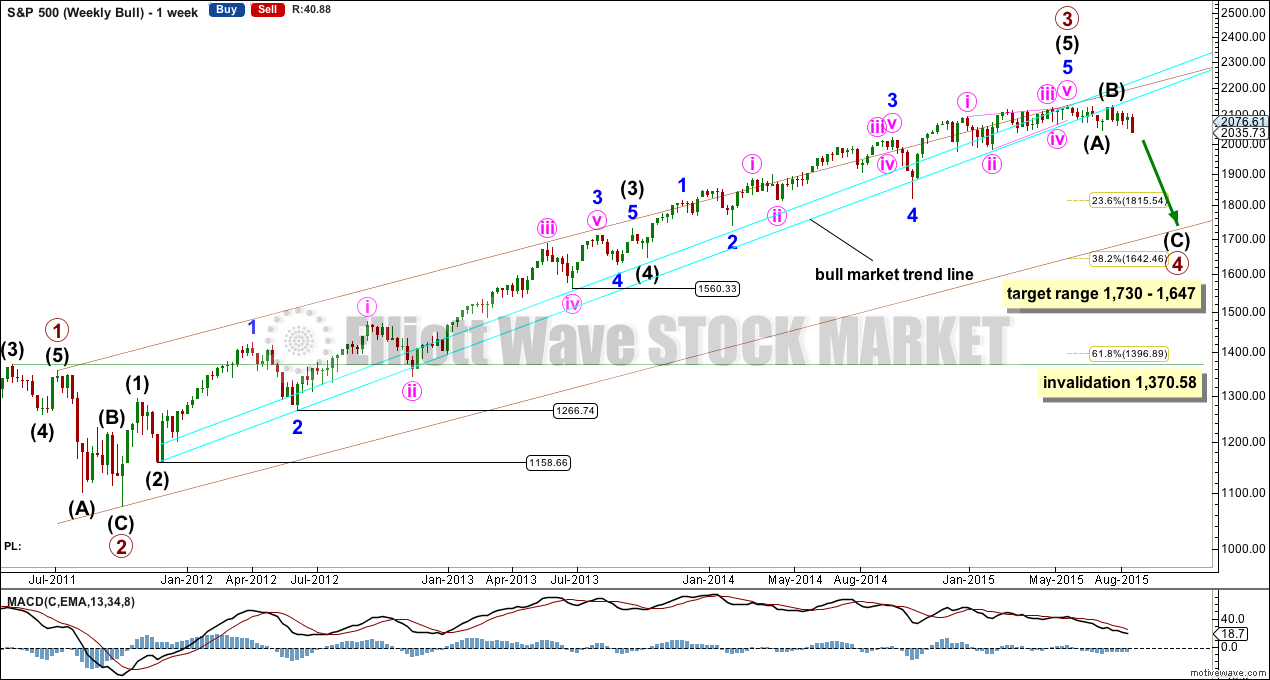
It’s time to step back to look at the big picture. The second bullish wave count may be invalidated today.
Primary wave 2 was a relatively shallow 0.41 zigzag lasting 12 weeks. Primary wave 4 may be more shallow, most likely to be a flat, combination or triangle, and may be longer lasting than primary wave 2 as these types of sideways corrective structures tend to be more time consuming than zigzags. Primary wave 4 is likely to end in the price territory of the fourth wave of one lesser degree between 1,730 – 1,647. It may last about 21 or maybe now even 34 weeks.
Draw a trend channel about this big wave up using Elliott’s first technique: draw the first trend line from the highs labelled primary waves 1 to 3, then place a parallel copy on the low labelled primary wave 2. Primary wave 4 may end when price finds support at the lower edge of the channel. If it ends there, then it would also be within the range of the fourth wave of one lesser degree, intermediate wave (4).
Intermediate wave (3) is 0.76 points short of 2.618 the length of intermediate wave (1). For such a long lasting wave this very close Fibonacci ratio gives confidence this part of the wave is correctly labelled. Intermediate wave (3) subdivides perfectly as an impulse right down to the five minute chart level.
Intermediate wave (4) has its price range from 1,730 – 1,647.
Primary wave 4 may not move into primary wave 1 price territory below 1,370.58. Invalidation of this bull wave count (still bullish at cycle degree) would be confirmation of the bear wave count.
Click chart to enlarge.
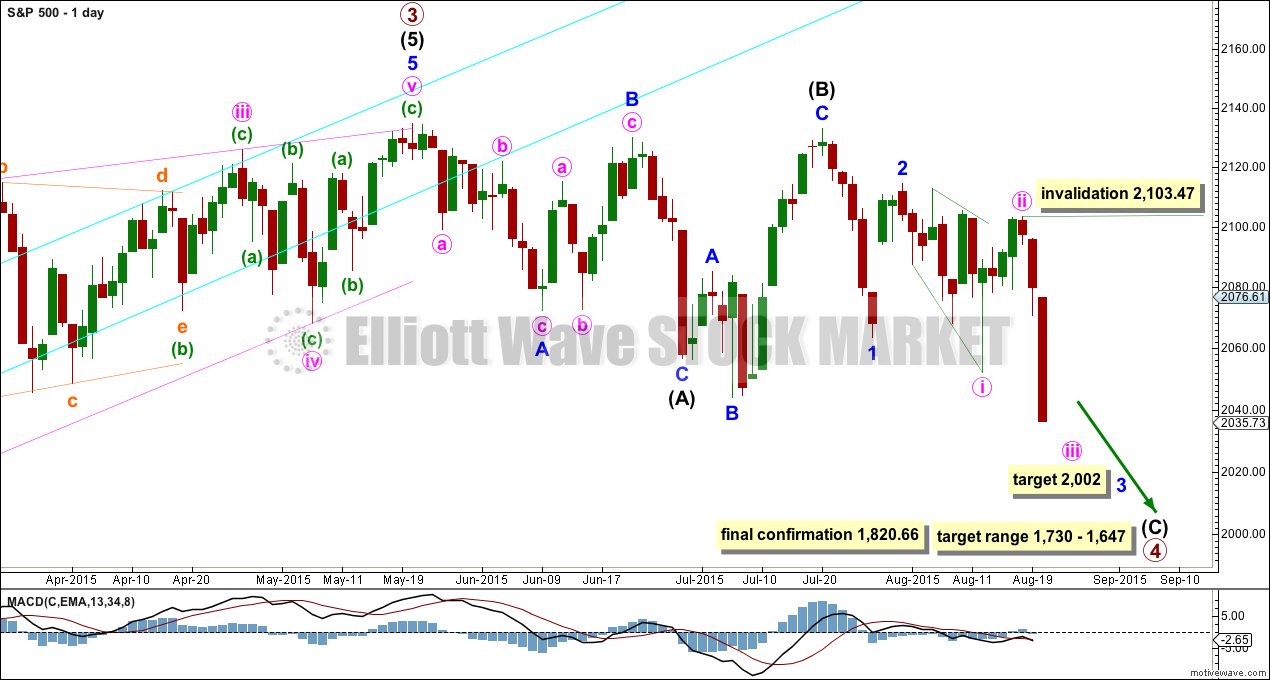
The S&P has seen a primary degree (or for the bear count below a Super Cycle degree) trend change. The second bullish wave count must now be discarded today; it is published for the last time today with an explanation of why it is now invalid.
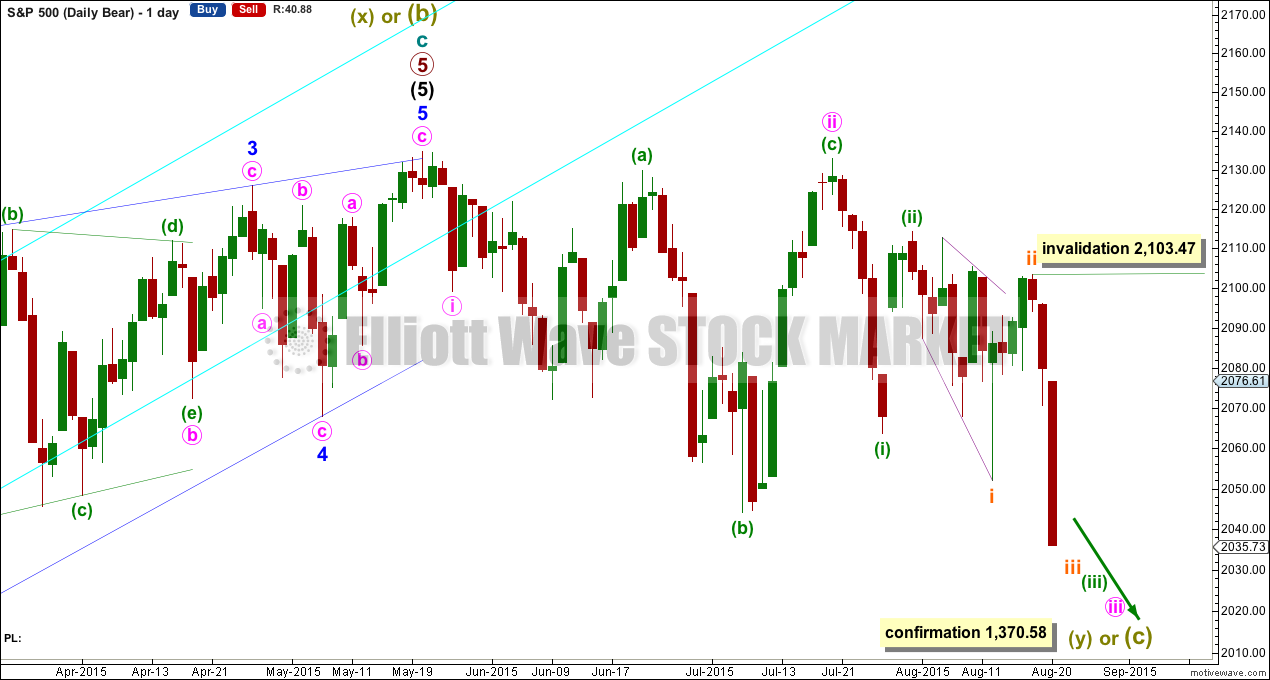
I am moving the degree of labelling within the first movement of primary wave 4 up. It may be that intermediate waves (A) and (B) are both complete as three wave structures indicating a flat may be unfolding. Intermediate wave (C) down must be a five wave structure; it looks like it is unfolding as an impulse. For now I will leave this degree as is, but depending on where intermediate wave (C) ends I may move it back down one degree. It is equally as likely that only minor wave A may be unfolding as a flat correction.
If this impulse does not bring price down to the target range or the lower edge of the big channel on the weekly chart, then it may only be intermediate wave (A) of a bigger flat for primary wave 4. If it does bring price lower to the target range, then it may be primary wave 4 in its entirety.
Within minor wave 3, no second wave correction may move beyond its start above 2,103.47.
This wave count now has some confirmation at the daily chart level with a close more than 3% of market value below the long held bull market trend line.
Further confirmation would come with:
1. A new low below 2,044.02, which was seen today providing further confidence in this trend change.
2. A new low below 2,022.07 to invalidate the second wave count, which is no longer required because the bullish wave count is invalid already.
3. A clear five down on the hourly chart, which was seen for minute wave i.
4. A clear five down on the daily chart.
5. A new low below 1,820.66.
6. A break below the 50 week SMA on the weekly chart or the 200 day SMA on the daily chart. This has been seen today with a break of the 200 day SMA on the daily chart.
As each condition is met the probability of a substantial trend change increases.
At this stage, a trend change is looking somewhat likely so I’ll list points in its favour:
1. The long held bull market trend line, the strongest piece of technical analysis on ALL charts, has been breached now by a close more than 3% of market value.
2. There is quadruple negative divergence between price and MACD on the weekly chart.
3. There is double negative divergence between price and MACD on the daily chart.
4. There is persistent and strong negative divergence between price and RSI on the monthly chart. The last time this happened was October 2007 and we all know what happened after that…
5. A long held bull trend line on On Balance Volume going back to October 2014 has been breached, is no longer providing support, and is now providing resistance.
6. DJT has recently failed to confirm the continuation of a bull market. This does not indicate a bear market, but does indicate caution.
Minor wave 3 should show its subdivisions clearly on the daily chart. It may also be the case that minute wave iii may do so too. Minor wave 3 still has to show a further increase in downwards momentum beyond that seen for minor wave 1 for it to have a typical third wave look.
Click chart to enlarge.
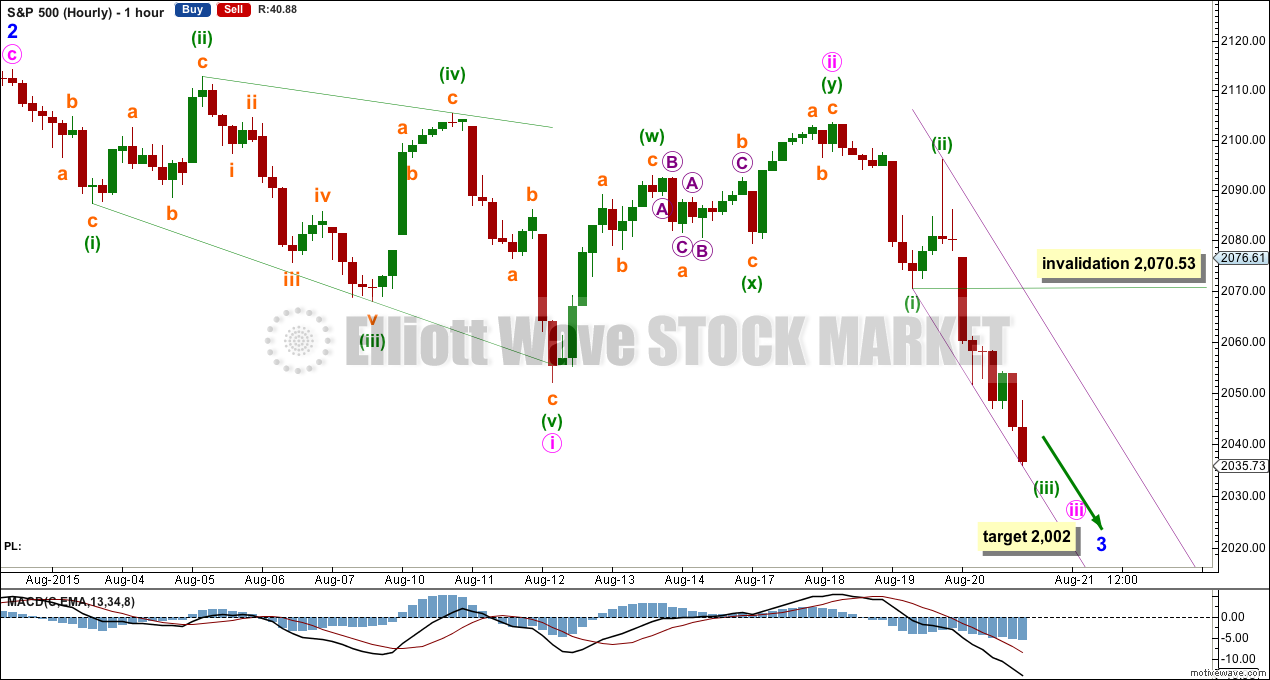
Minor wave 3 may only subdivide as an impulse. At 2,002 it would reach 1.618 the length of minor wave 1.
Minor wave 3 is showing its subdivisions clearly on the daily chart, typical for the S&P.
Draw an acceleration channel about the middle of this third wave: draw the first trend line from the end of minuette wave (i) to the last low, then place a parallel copy on the end of minuette wave (ii). As price moves lower keep redrawing the channel. Look for corrections to find resistance at the upper trend line. When that upper line is breached, then that may be the end of minuette wave (iii).
Minuette wave (iv) may not move into minuette wave (i) price territory above 2,070.53.
SECOND ELLIOTT WAVE COUNT
Click chart to enlarge.
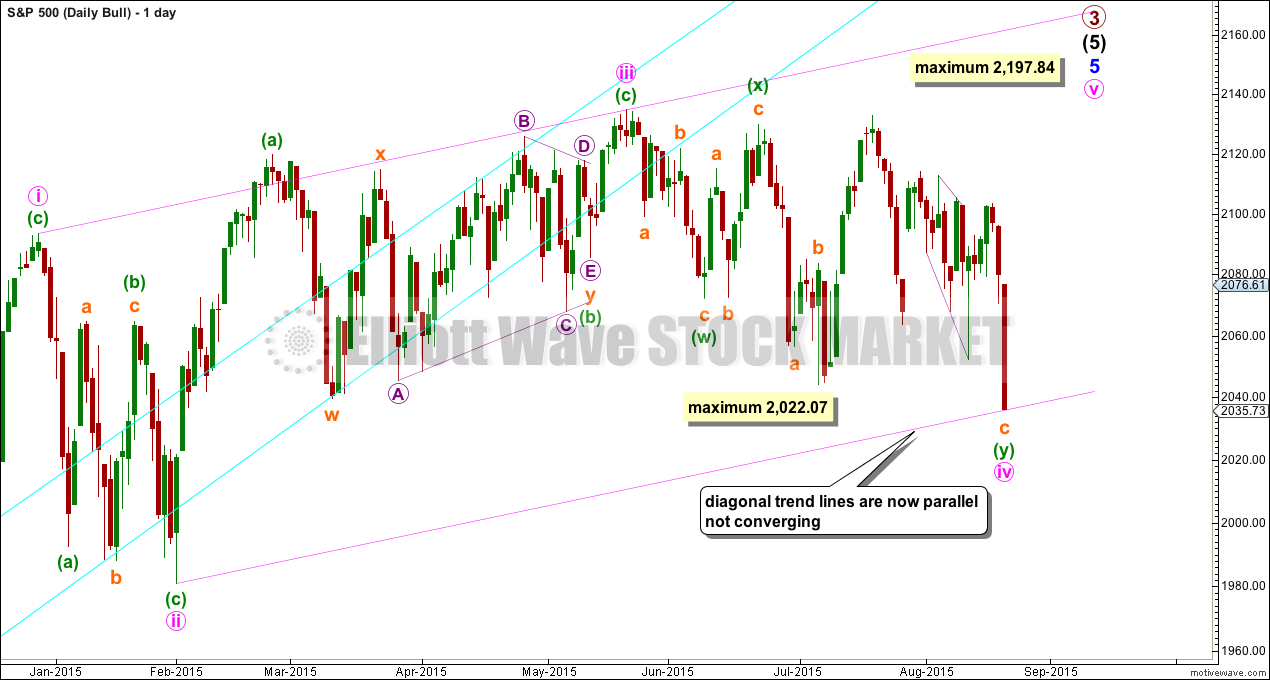
This second wave count is now invalid. If primary wave 3 is continuing, then the final wave of minor 5 would be an ending diagonal. An ending diagonal requires all sub waves to be zigzags and the fourth wave to overlap first wave price territory.
This diagonal would be contracting because the third wave is shorter in length than the first. The trend lines of a contracting diagonal must converge. At this stage, these trend lines are now parallel and not converging. The rule is not met, so the wave count must be invalidated.
BEAR ELLIOTT WAVE COUNT
Click chart to enlarge.
The subdivisions within cycle waves a-b-c are seen in absolutely exactly the same way as primary waves 1-2-3 for the main wave count.
In line with recent Grand Super Cycle wave analysis, I have moved the degree of labelling for the bear wave count all up one degree.
This bear wave count expects a Super Cycle wave (c) to unfold downwards for a few years, and if it is a C wave it may be devastating. It may end well below 666.79.
However, if this wave down is a Super Cycle wave (y), then it may be a time consuming repeat of the last big flat correction with two market crashes within it, equivalent to the DotCom crash and the recent Global Financial Crisis, and it may take another 8-9 years to unfold sideways.
For this bear wave count a big impulse down must begin, so a series of overlapping first and second waves should now be complete. The new idea for the first wave count does not work for this bear wave count.
A new low below 1,370.58 would invalidate the first wave count confirming a huge market crash. Before that price point is passed though, structure should be a strong indication that this bear wave count would be correct. It is supported by regular technical analysis at the monthly chart level.
TECHNICAL ANALYSIS
Click chart to enlarge. Chart courtesy of StockCharts.com.
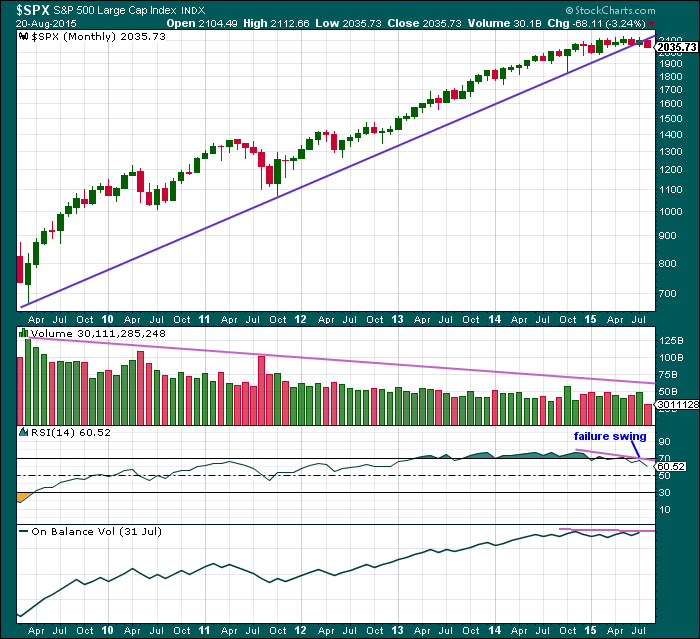
Monthly Chart: A long held trend line from the end of the big low at 666.79 in March 2009, to the next big swing low at 1,074.77 in October 2011, has been breached and now provides resistance.
Volume has been falling during this bull market spanning six years and five months. This rise in price is not supported by volume, so is suspicious at the monthly chart level.
Back to November 2014, there is now double negative divergence between price and RSI at the end of this movement. This pattern was last seen just prior to the DotCom crash and the GFC. In both of those instances there was also a failure swing by RSI, which appears here too.
On Balance Volume shows slight negative divergence with price.
At the monthly chart level, this regular technical analysis favours the bear wave count.
Click chart to enlarge. Chart courtesy of StockCharts.com.
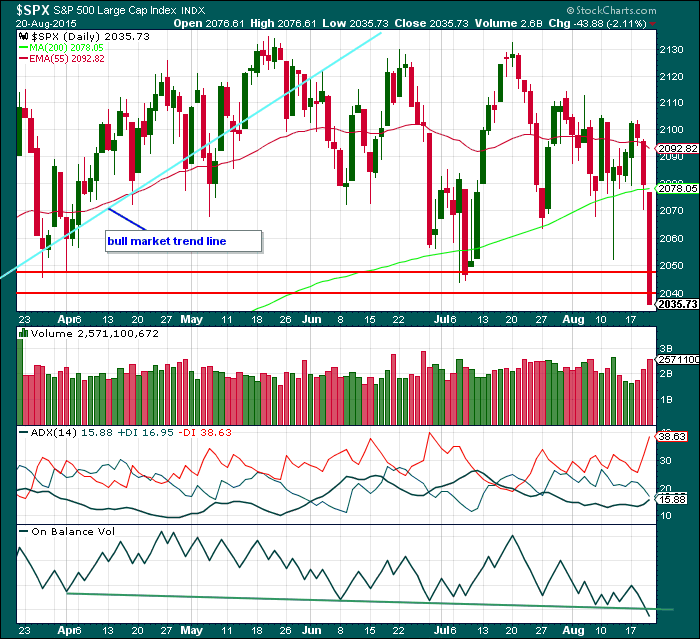
Daily Chart: A strong downwards day on increased volume supports the Elliott wave count. With the 200 day SMA now breached, that provides further confidence in the Elliott wave count.
Price has closed below the lower support line, further bearishness.
ADX is turning up, is above 15, and again rising. With the negative DX line above the positive DX line, a new downwards trend is now indicated by ADX.
On Balance Volume has breached its trend line. This is further bearishness.
The strongest piece of technical analysis on this chart is still the long held bull market trend line (price points to draw this are shown on the weekly Elliott wave chart). This bull market trend line is drawn using the approach outlined by Magee in the classic “Technical Analysis of Stock Trends”. Today saw a close 3.9% of market value below the line taken at the point it was breached. This line is now breached by three closes more than 3% of market value. It tells us the market has very likely changed from bull to bear.
A note on Dow Theory: for the bear wave count I would wait for Dow Theory to confirm a huge market crash. For that to be confirmed the following new lows are needed:
S&P500: 1,820.66
Nasdaq: 4,116.60
DJT: 7,700.49
DJIA: 15,855.12
At this time DJT is closest, but none of these indices have made new major swing lows yet.
This analysis is published about 11:39 p.m. EST.
Bear markets tend to unfold much more quickly than bull markets. As counter-intuitive as it may seem, some of the sharpest rallies you will ever see occur during bear markets due to short covering. Lots of analysts are still insisting that the bull is alive and well. Look for VIX to spike in the next day or two to signal an intermediate bottom. I think Lara is right in that this decline seems to be at least at minor degree, possibly higher…
Most excellent call on the VIX yesterday Vernecarty!!! Should be very interesting at the close. Who’s holding over the weekend?
Thanks Zalomoon. Already nibbling on VIX puts. I think we will see a reversal bounce starting Monday after lows are put in. Of course, the caveat is that this thing could just keep crashing so make sure stops are in place if you are jumping in early…
Definitely chance of a bounce around the 2070-2080 area. Certainly didn’t expect to drop this far this fast. Great job Lara.