
A little upwards movement was expected to begin the session to a target at either 2,115 or 2,117 – 2,121. This is how the session began, with price falling 0.76 short of the first target.
Thereafter, price turned down to complete a red candlestick, which is what was expected.
Summary: Both wave counts expect downwards movement to begin next week. Both wave counts are supported by volume, support and resistance, and Stochastic. The 200 day SMA may provide support. If that is breached next week, then the first wave count would most likely be correct; if it is not breached, then the second wave count may be more likely.
Changes to last analysis are bold.
To see a weekly chart and how to draw trend lines click here.
Note regarding data for Tuesday’s session: I am still unable to get the Google / Yahoo data feed to provide a candlestick for Tuesday. For today’s analysis, I am relying on the candlestick on Tuesday’s chart for Tuesday’s candlestick.
FIRST ELLIOTT WAVE COUNT
Click chart to enlarge.
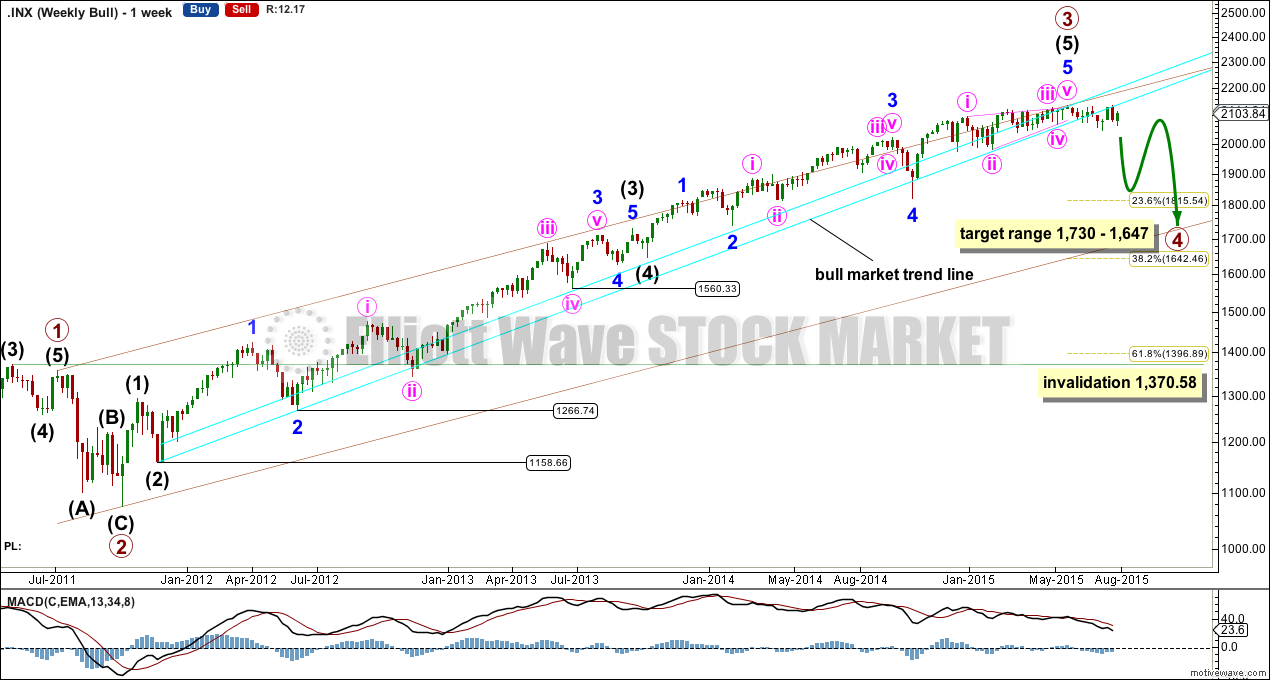
If primary wave 3 is over then primary wave 4 should begin.
Primary wave 2 was a relatively shallow 0.41 zigzag lasting 12 weeks. Primary wave 4 may be more shallow and is most likely to be a flat, combination or triangle. It may be longer lasting than primary wave 2 as these types of sideways corrective structures tend to be more time consuming than zigzags. Primary wave 4 is likely to end in the price territory of the fourth wave of one lesser degree between 1,730 – 1,647. It may last about 13 or maybe even 21 weeks. So far it has completed its tenth week.
This weekly chart shows how I have drawn the aqua blue trend lines: draw the first trend line from the low labelled intermediate wave (2) within primary wave 3 to the next swing low labelled minor wave 2, then create a parallel copy and push it up to sit on the low labelled minute wave iv within minor wave 3 of intermediate wave (3). The lower line has now twice been breached by a daily close more than 3% of market value below the line indicating a market shift from bull to bear.
Draw a trend channel using Elliott’s first technique with the first trend line from the ends of primary waves 1 to 3 and a parallel copy on the end of primary wave 2. If primary wave 4 ends at the lower edge of the channel, then it would perfectly end at within the target range.
If this channel is breached by strong downwards movement that would favour the bear wave count over this bull wave count.
Primary wave 4 may not move into primary wave 1 price territory below 1,370.58. Invalidation of this bull wave count would provide full confidence in the bear wave count.
Because primary wave 4 may be an expanded flat, running triangle or double combination it may include a new high beyond its start at 2,119.59. If this happens the bear wave count would be invalidated. But first a clear five down at the daily chart should be seen for a movement at primary degree.
There is triple (quadruple?) divergence with price and MACD supporting the idea of a trend change, either already or coming up soon.
Click chart to enlarge.
It is possible that the S&P has seen a primary degree (or for the bear count below a Super Cycle degree) trend change.
This wave count now has some confirmation at the daily chart level with a close more than 3% of market value below the long held bull market trend line.
Further confirmation would come with:
1. A new low below 2,044.02.
2. A new low below 2,022.07 to invalidate the alternate wave count.
3. A clear five down on the hourly chart.
4. A clear five down on the daily chart.
5. A new low below 1,820.66.
6. A break below the 50 week SMA on the weekly chart or the 200 day SMA on the daily chart.
As each condition is met the probability of a substantial trend change would increase.
At this stage, a trend change is looking somewhat likely so I’ll list points in its favour:
1. The long held bull market trend line, the strongest piece of technical analysis on ALL charts, has been breached now by a close more than 3% of market value.
2. There is quadruple negative divergence between price and MACD on the weekly chart.
3. There is double negative divergence between price and MACD on the daily chart.
4. There is persistent and strong negative divergence between price and RSI on the monthly chart. The last time this happened was October 2007 and we all know what happened after that…
5. A long held bull trend line on On Balance Volume going back to October 2014 has been breached, is no longer providing support, and is now providing resistance.
6. DJT has recently failed to confirm the continuation of a bull market. This does not indicate a bear market, but does indicate caution.
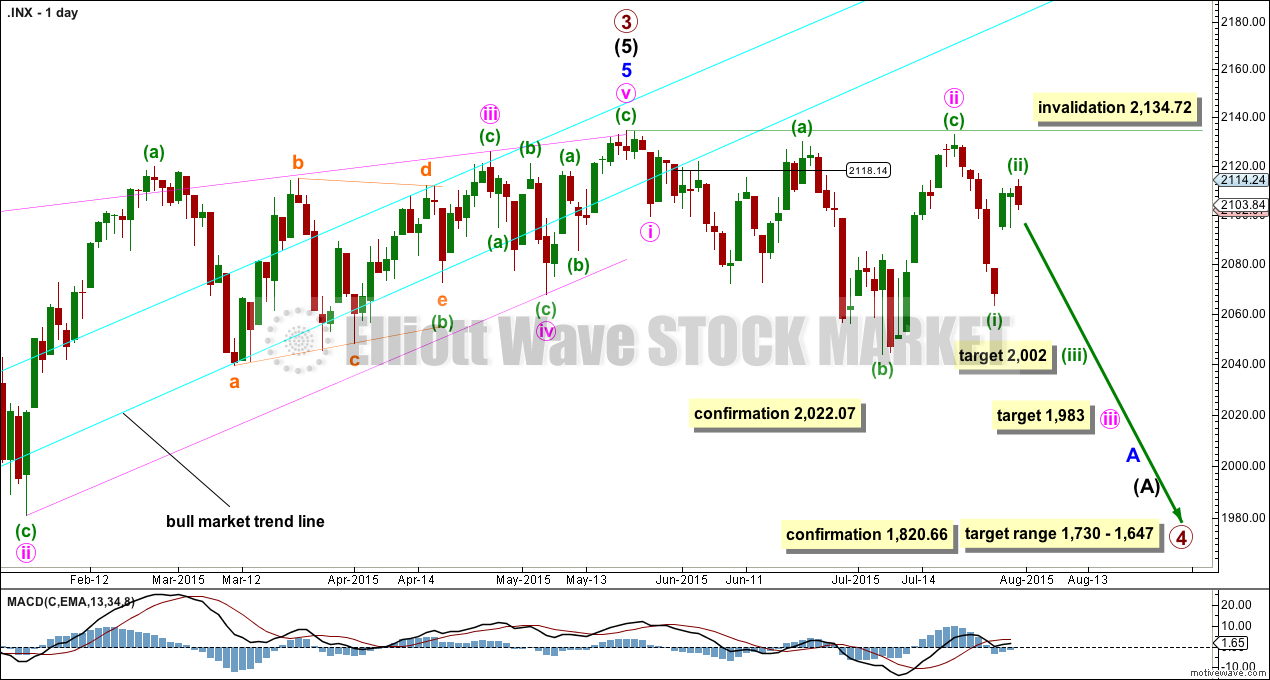
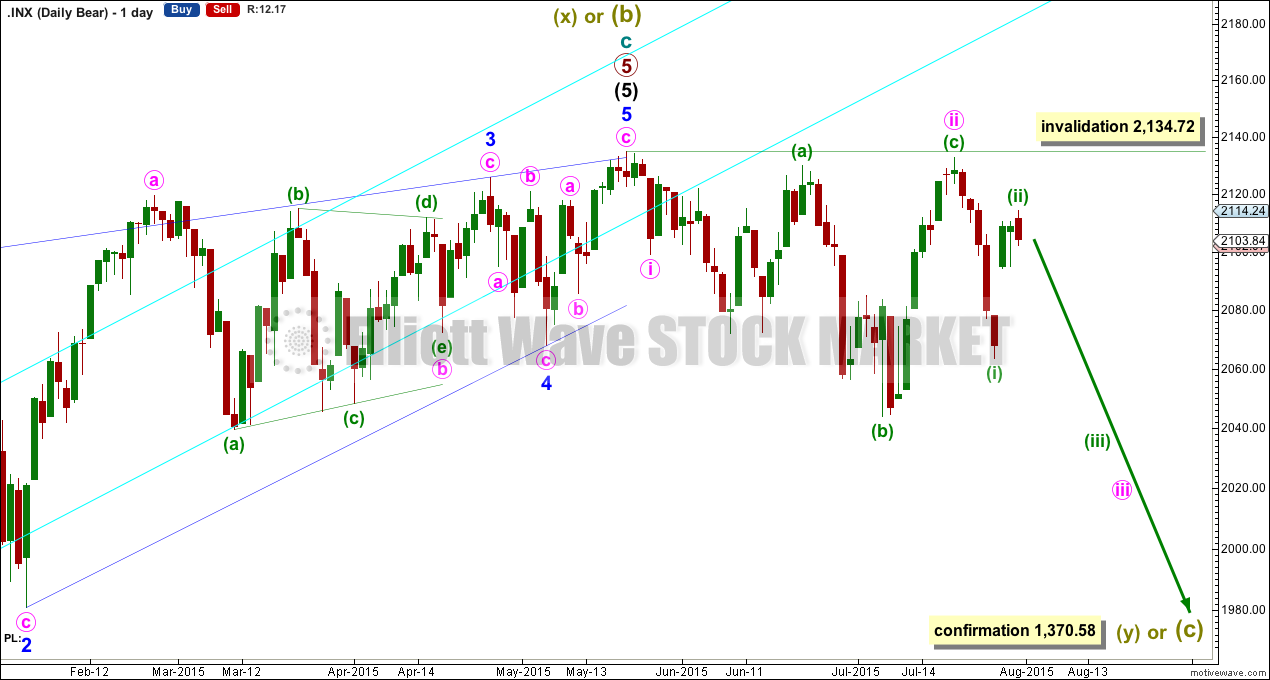
Targets for minute wave iii and minuette wave (iii) are added now to the daily chart and explained below. Minute wave iii should show its subdivisions clearly on the daily chart so that when it is done it has a clear five wave impulse look to it. So far minuette wave (ii) shows up clearly. When it arrives minuette wave (iv) should also show up clearly. Minuette wave (iii) next week should show a strong increase in downwards momentum.
Click chart to enlarge.
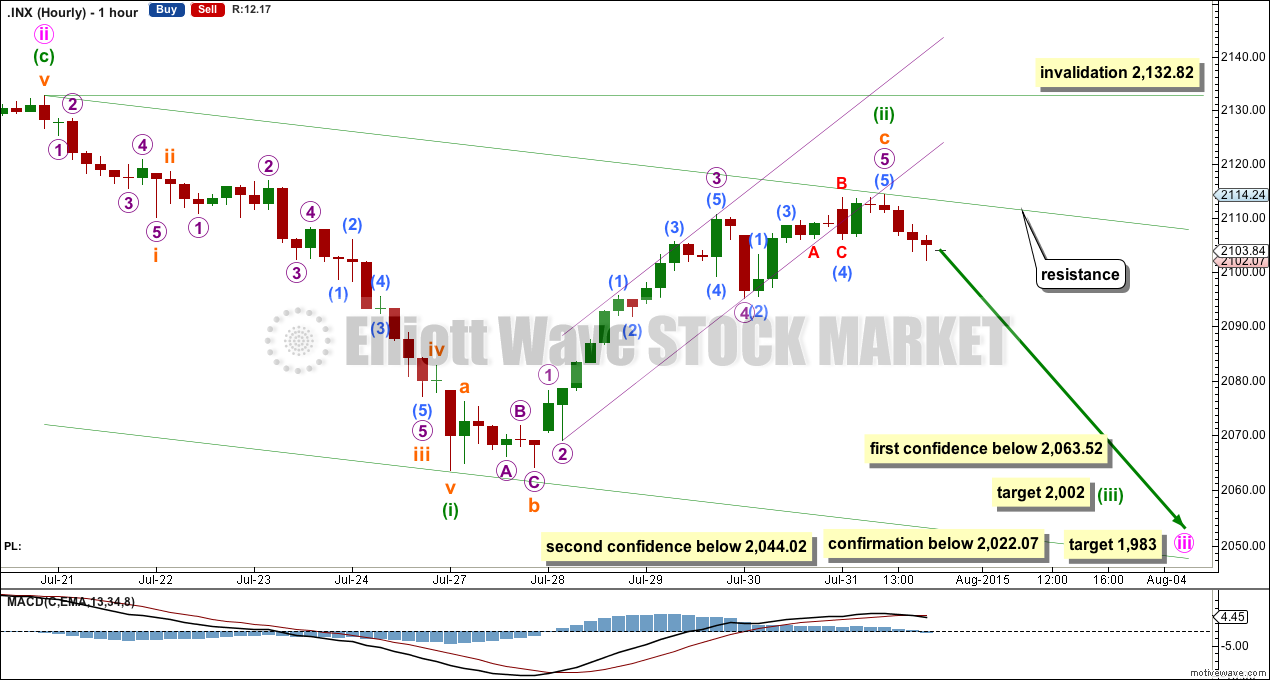
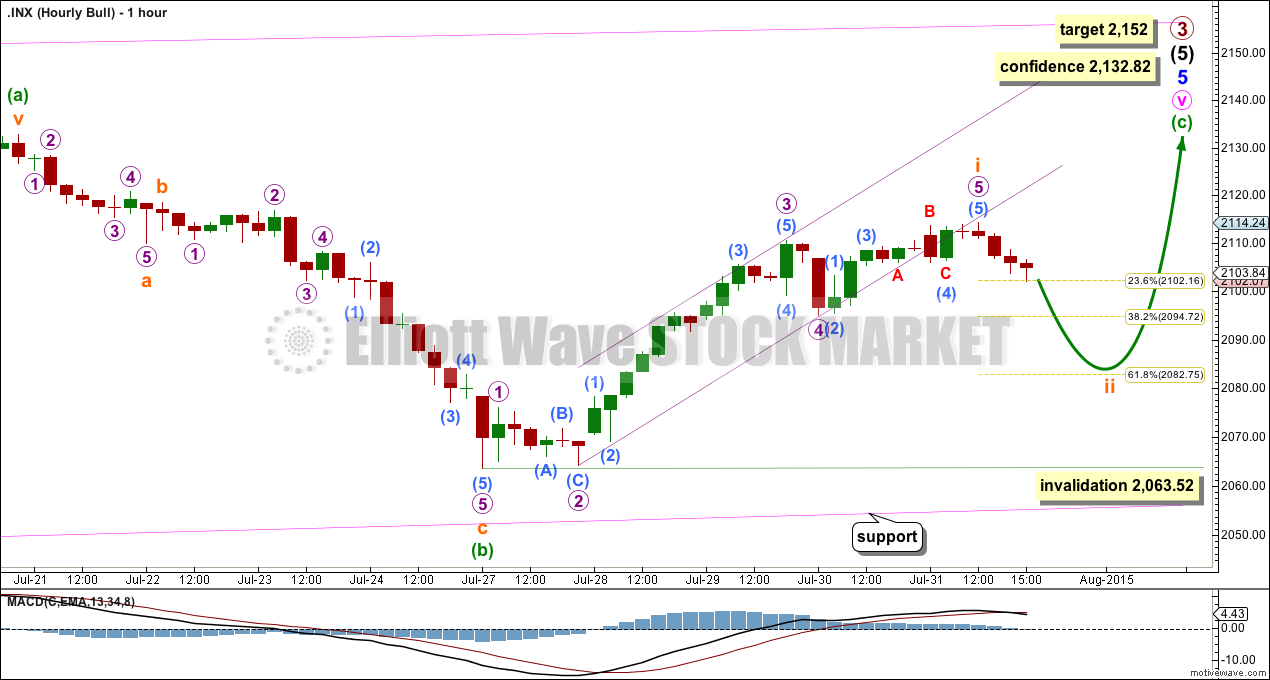
Minuette wave (ii) is now very likely to be over. The small channel containing subminuette wave c is clearly breached by downwards movement and the structure of minuette wave (ii) is complete at all wave degrees. It is again a typically deep second wave correction.
First confidence in this wave count would come with a new low below 2,063.52. As each confidence / confirmation point is passed the probability this is the correct wave count would increase.
At 2,002 minuette wave (iii) would reach 1.618 the length of minuette wave (i). Minuette wave (iii) may only subdivide as an impulse, and should show a strong increase in downwards momentum.
Draw a base channel about minuette waves (i) and (ii) as shown. Along the way down upwards corrections against the trend should find resistance at the upper edge of the channel. The middle of the third wave should have the power to break below the lower edge of the channel. Once price breaks that line it should then provide some resistance.
At 1,983 minute wave iii would reach 4.236 the length of minute wave i. Along the way down to this target there needs to be another correction for minuette wave (iv), counterpart to the correction of minuette wave (ii) just ended. Minuette wave (iv) should last a few days and should be shallow and not move back up into minuette wave (i) price territory.
If minuette wave (ii) continues any higher it may not move beyond the start of minuette wave (i) above 2,132.82.
SECOND ELLIOTT WAVE COUNT
Click chart to enlarge.
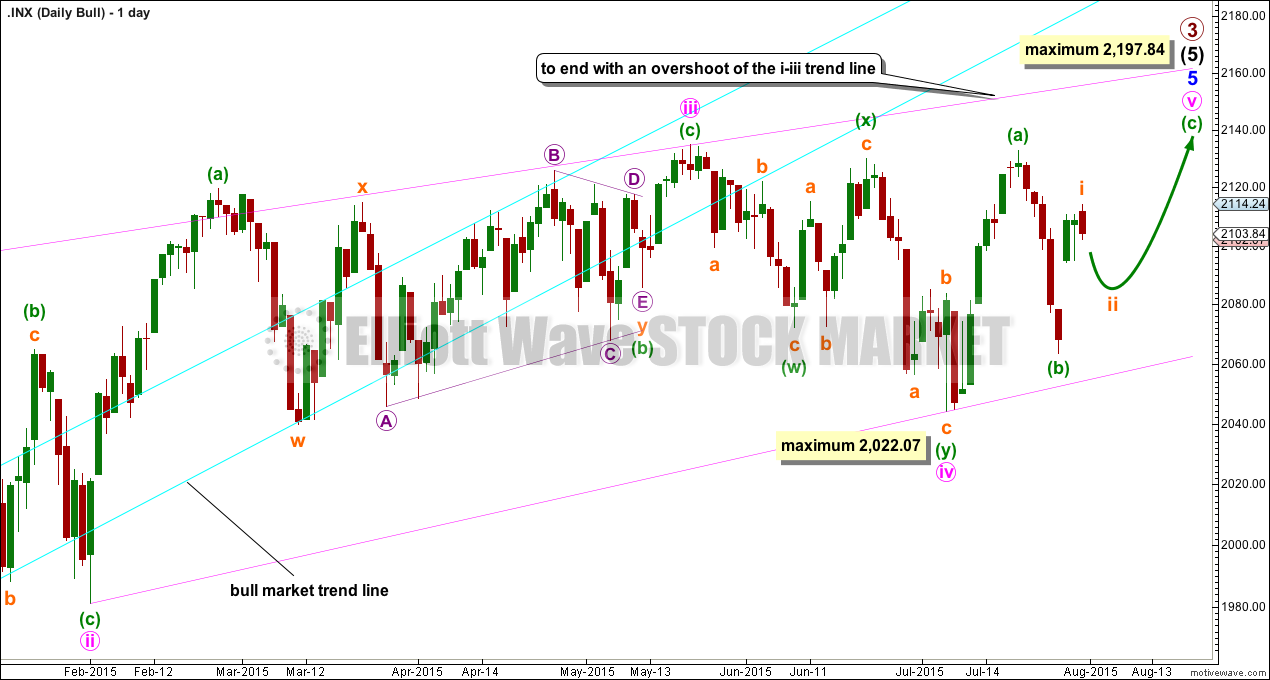
The ending contracting diagonal may still be incomplete. Ending diagonals require all sub waves to subdivide as zigzags, and the fourth wave should overlap first wave price territory. It is Elliott wave convention to always draw the diagonal trend lines to indicate a diagonal structure is expected.
My labelling here of minute wave iv within the diagonal as a double zigzag relies upon the interpretation of “double and triple zigzags take the place of zigzags” (“Elliott Wave Principle” by Frost and Prechter, 10th edition, page 91) to be true for zigzags within diagonals. This wave down may also be labelled as a single zigzag, but that does not have as neat a fit as a double zigzag.
The diagonal trend lines are no longer clearly converging. This reduces the probability of this wave count.
If it moves any lower, then minute wave iv may not be longer than equality in length with minute wave ii at 2,022.07. If it is over here, then minute wave v up also has a limit and may not be longer than equality with minute wave iii at 2,197.84.
The best way to see where and when upwards movement may end is the upper diagonal i-iii trend line. It is very likely to be overshot. Upwards movement may find resistance at the long held bull market trend line.
Click chart to enlarge.
Minuette wave (c) upwards may only subdivide as an ending diagonal or an impulse. It is highly unusual for an ending diagonal to complete an ending diagonal, so an impulse for minuette wave (c) is much more likely.
Subminuette wave i is now a complete five wave impulse. Subminuette wave ii must subdivide as a corrective structure, a three. It is most likely to be a deep correction so a reasonable target for it may be the 0.618 Fibonacci ratio of subminuette wave i at 2,083.
How the next wave down unfolds (its structure and momentum) should give us clues as to which wave count is most likely correct.
BEAR ELLIOTT WAVE COUNT
Click chart to enlarge.
The subdivisions within cycle waves a-b-c are seen in absolutely exactly the same way as primary waves 1-2-3 for the main wave count.
In line with recent Grand Super Cycle wave analysis, I have moved the degree of labelling for the bear wave count all up one degree.
This bear wave count expects a Super Cycle wave (c) to unfold downwards for a few years, and if it is a C wave it may be devastating. It may end well below 666.79.
However, if this wave down is a Super Cycle wave (y), then it may be a time consuming repeat of the last big flat correction with two market crashes within it, equivalent to the DotCom crash and the recent Global Financial Crisis, and it may take another 8-9 years to unfold sideways.
Within the new bear market, no second wave correction may move beyond the start of its first wave above 2,134.72.
The second wave count above works in the same way for this bear wave count.
TECHNICAL ANALYSIS
Click chart to enlarge.
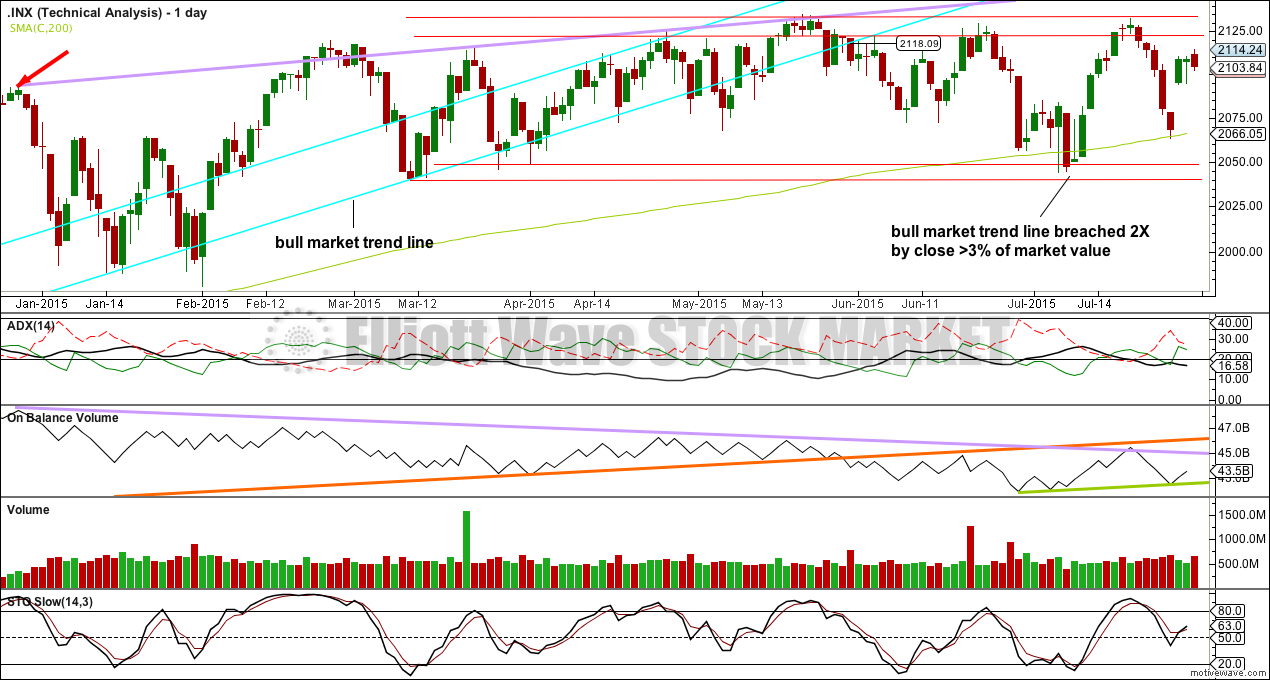
ADX is again no longer clearly turning up, but instead turning slightly down. Again ADX indicates there is no clear trend and the market is consolidating. Recently rises in price are accompanied by ADX indicating no trend, and the last two falls in price were accompanied by ADX indicating the early stages of a trend (which was down) at least at the end. Overall it does look like a downwards trend may be developing, and there is at least no indication from ADX that an upwards trend may be still in place.
A range bound trading system may be better used again than a trend following system. This would still expect some more downwards movement, to not end until price finds support at the lower two red horizontal trend lines and Stochastics is oversold at the same time.
As both Elliott wave counts are also expecting some downwards movement to unfold next week, this regular technical analysis is in agreement.
As price turns down to reach support, if On Balance Volume breaks below its short held green trend line, that would be another reasonably bearish indicator.
Along the way down, price may again find support about the 200 day SMA (green). If price breaks clearly below that line, then it would be a very bearish indicator; a bounce at least or an end to downwards movement should initially be expected there. If Stochastics reaches oversold while price finds support at the 200 day SMA, then it may be where downwards movement ends, but only as long as ADX continues to indicate no clear trend.
Friday’s red candlestick completes with increased volume over the last two prior green candlesticks. This fall in price for Friday was again supported by volume. This has happened recently and was followed by new all time highs (red arrow) so it may not be reliable. It is also possible that the unusual volume profiles seen recently for the S&P 500 are a warning of something very big to the downside to come, a canary in the mine indicating the very bearish Elliott wave count could be correct.
A note on Dow Theory: for the bear wave count I would wait for Dow Theory to confirm a huge market crash. For that to be confirmed the following new lows are needed:
S&P500: 1,820.66
Nasdaq: 4,116.60
DJT: 7,700.49
DJIA: 15,855.12
At this time DJT is closest, but none of these indices have made new major swing lows yet.
This analysis is published about 04:22 a.m. EST.