
Yesterday’s hourly wave count expected overall sideways movement: some upwards movement to complete a triangle to be followed by downwards movement as a fifth wave began.
This is exactly what happened.
Summary: The fourth wave may now be complete. The target for tomorrow’s downwards movement is 2,039.
To see a weekly chart and how to draw trend lines go here.
Changes to last analysis are bold.
MAIN ELLIOTT WAVE COUNT
Click chart to enlarge.
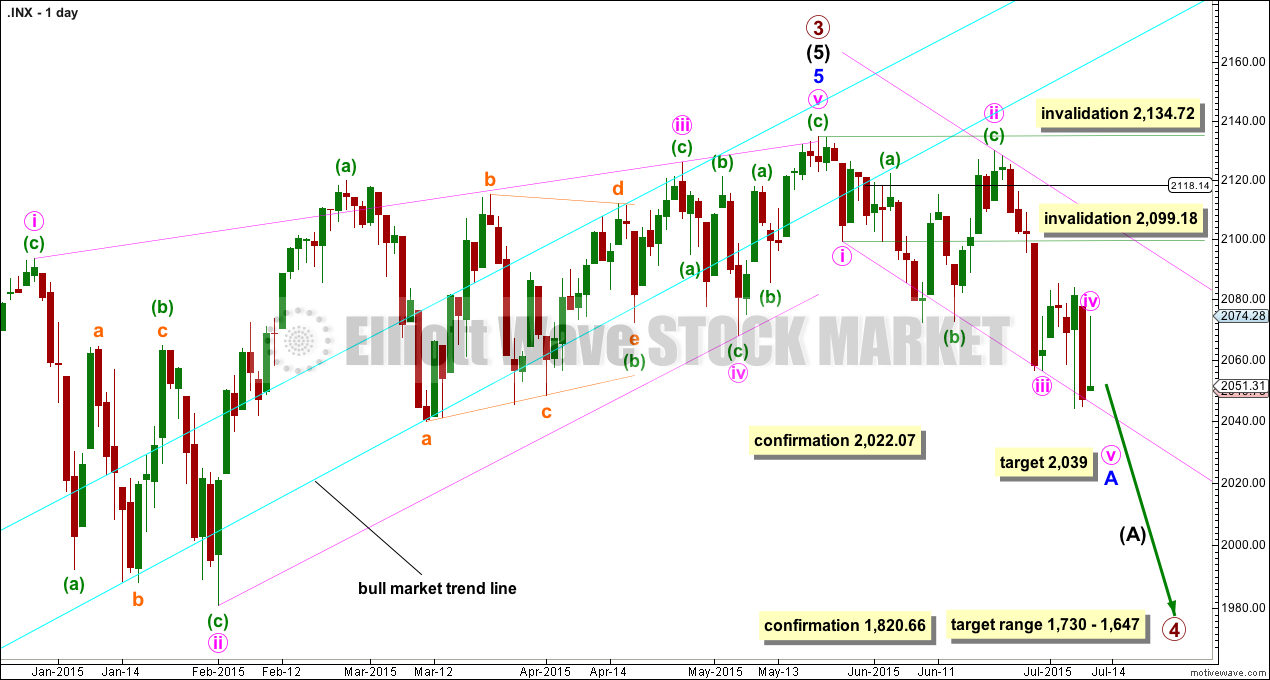
It is possible that the S&P has seen a primary degree (or for the bear count below a Super Cycle degree) trend change.
This wave count now has some confirmation at the daily chart level with a close more than 3% of market value below the long held bull market trend line.
Further confirmation would come with:
1. A new low below 2,022.07 to invalidate the alternate wave count.
2. A clear five down on the hourly chart.
3. A clear five down on the daily chart.
4. A new low below 1,820.66.
As each condition is met the probability of a substantial trend change would increase.
Primary wave 4 would most likely be a time consuming flat, triangle or combination in order to exhibit structural alternation with the zigzag of primary wave 2. Primary wave 2 lasted 12 weeks. Primary wave 4 is likely to be longer in duration because combinations and triangles particularly are more time consuming than zigzags which tend to be quick corrections. Primary wave 4 may be expected to last more than 12 weeks, and may end with a total Fibonacci 21 weeks.
At this stage, a trend change is looking somewhat likely so I’ll list points in its favour:
1. ADX is above 20 and rising, and the -DX line is above the +DX line indicating a new downwards trend.
2. The long held bull market trend line, the strongest piece of technical analysis on ALL charts, has been breached now by a close more than 3% of market value.
3. There is quadruple negative divergence between price and MACD on the weekly chart.
4. There is double negative divergence between price and MACD on the daily chart.
5. There is persistent and strong negative divergence between price and RSI on the monthly chart. The last time this happened was October 2007 and we all know what happened after that…
6. A long held bull trend line on On Balance Volume going back to October 2014 has been breached and is no longer providing support (orange line added to OBV on the TA chart below).
7. DJT has recently failed to confirm the continuation of a bull market. This does not indicate a bear market, but does indicate caution.
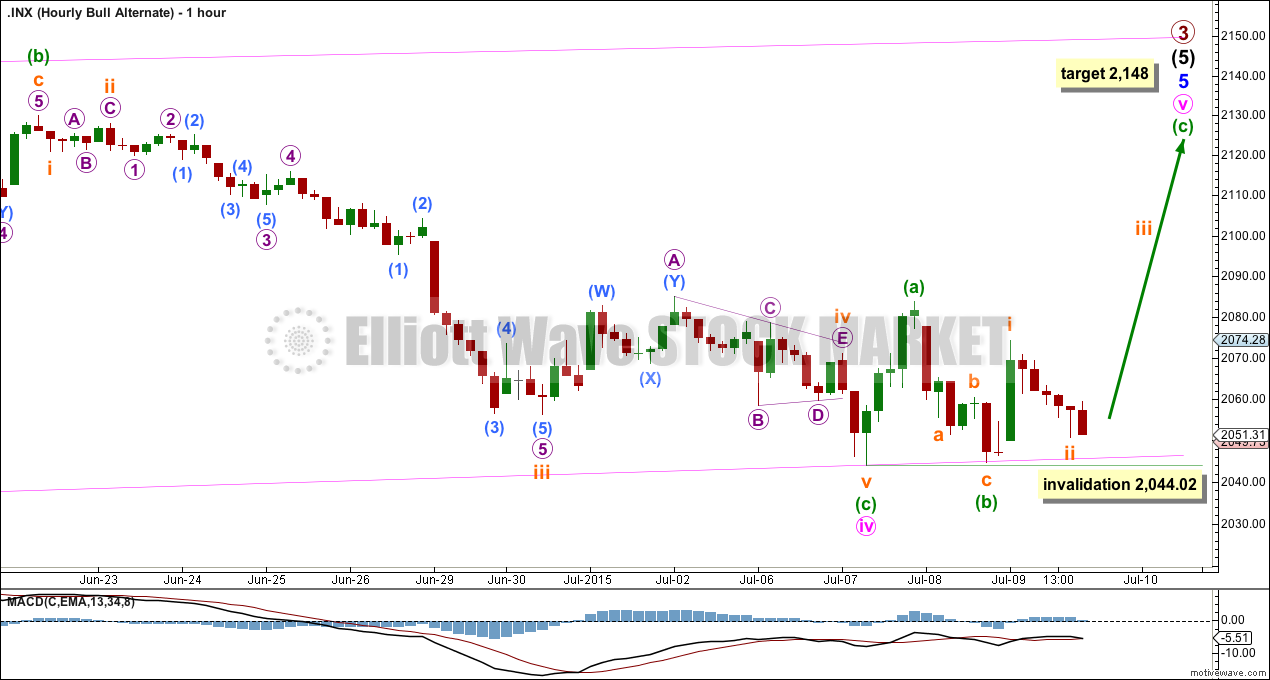
MAIN HOURLY WAVE COUNT
Click chart to enlarge.
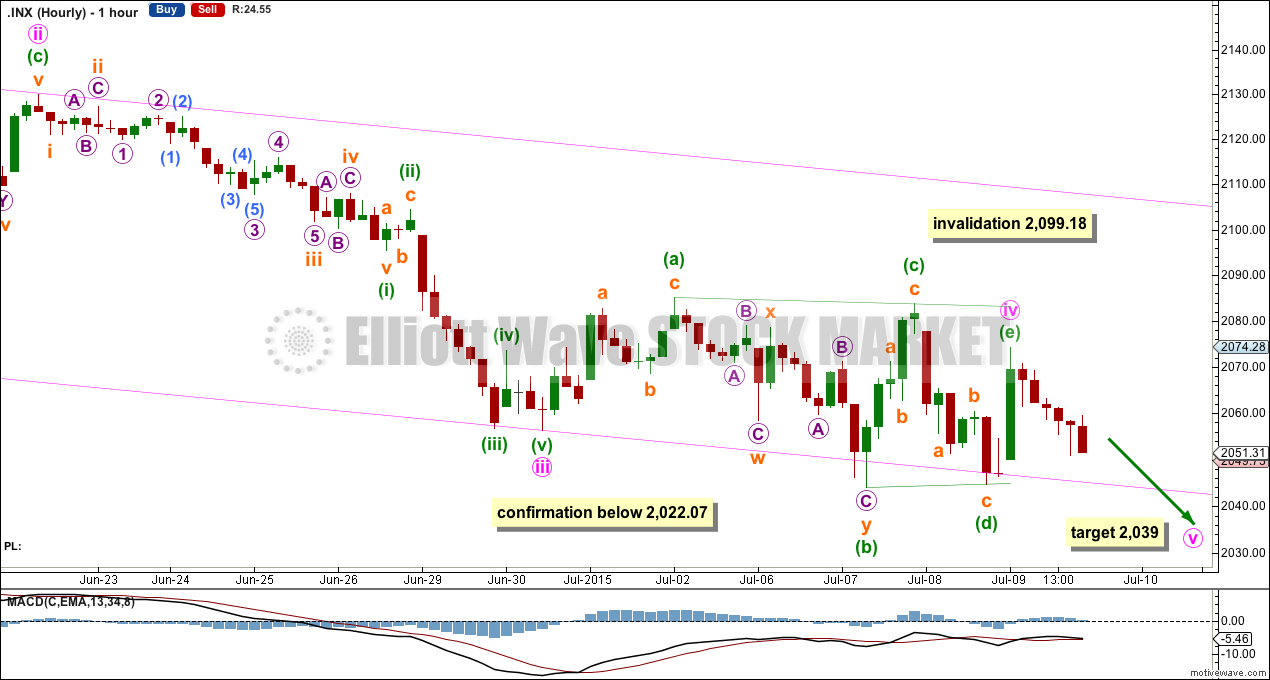
The fourth wave triangle may be complete. All sub waves are complete and all of them subdivide as single or double zigzags.
At 2,039 minute wave v would reach equality in length with minute wave i. If a fifth wave down unfolds tomorrow, then that shall give a clear five down at both the daily and hourly chart levels, providing more confidence in this wave count.
It is possible that minute wave iv is not a triangle and is an incomplete double combination. If it continues, then it should mostly be sideways and not move substantially higher. The purpose of triangles is to take up time and move price sideways, the same as that of combinations. They both should have a sideways trend and not a slope against the prior movement.
If minute wave iv continues further, then it may not move into minute wave i price territory above 2,099.18.
When minute wave v down completes, then a five wave impulse downwards would be over. A second or B wave up would then be expected, and it may not move above the start of the A or first wave at 2,134.72. The upcoming second or B wave may meet the expectations of a dead cat bounce.
The other possibility that the degree of labelling within minute wave iii could be moved down one degree is presented below, but it has a few problems which reduce its probability below this main wave count.
ALTERNATE HOURLY WAVE COUNT
Click chart to enlarge.
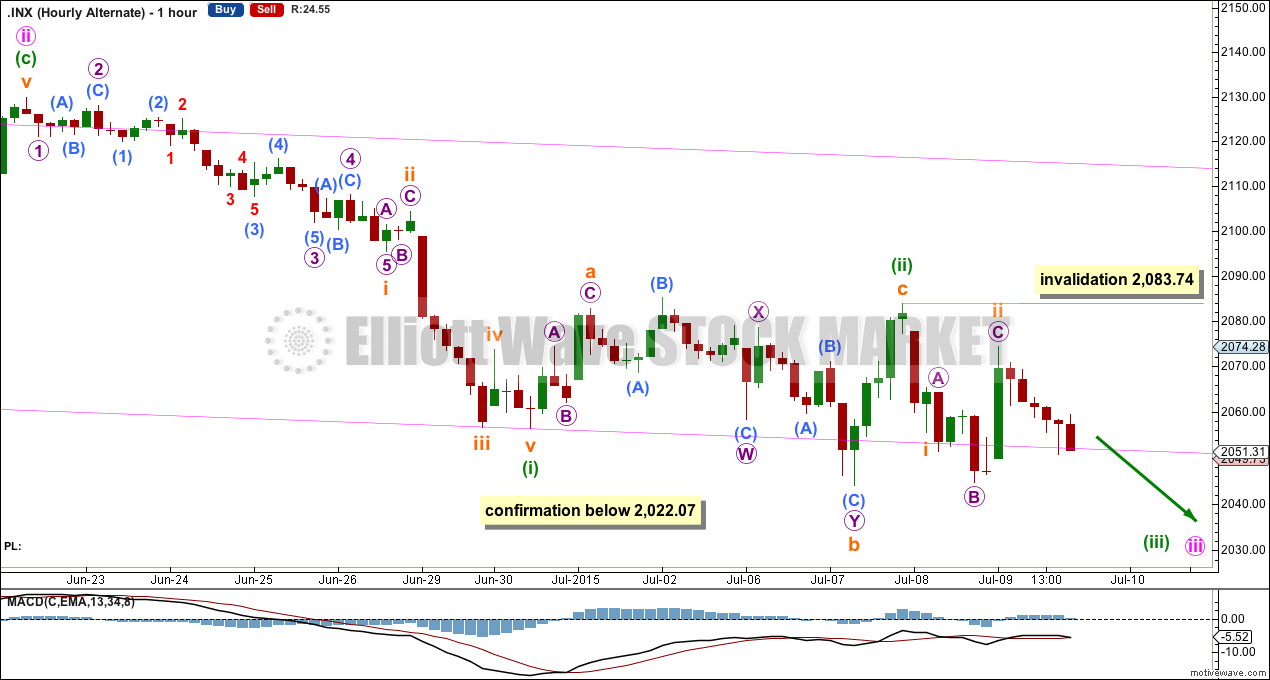
Although it would be possible that minute wave iii is not over, if recent sideways movement is a second wave correction, then it may not be a triangle.
Minuette wave (ii) may have been an expanded flat correction. However, the problem is within subminuette wave b. Technically this would be a combination: flat – X – zigzag, but it has a clear downwards slope where it should be sideways. Within micro wave W, submicro wave (C) looks like a three and subdivides as a three where it should be a five.
Subminuette wave ii would also be an expanded flat, but on the five minute chart micro wave C looks like a clear three where it should be a five.
These problems reduce the probability of this wave count, and so reduce the probability that minute wave iii is extending and moving towards the middle strongest part. A fifth wave down tomorrow rather than the middle of a strong third wave down looks more likely.
Subminuette wave ii may not move beyond the start of subminuette wave i above 2,083.74.
ALTERNATE ELLIOTT WAVE COUNT
Click chart to enlarge.
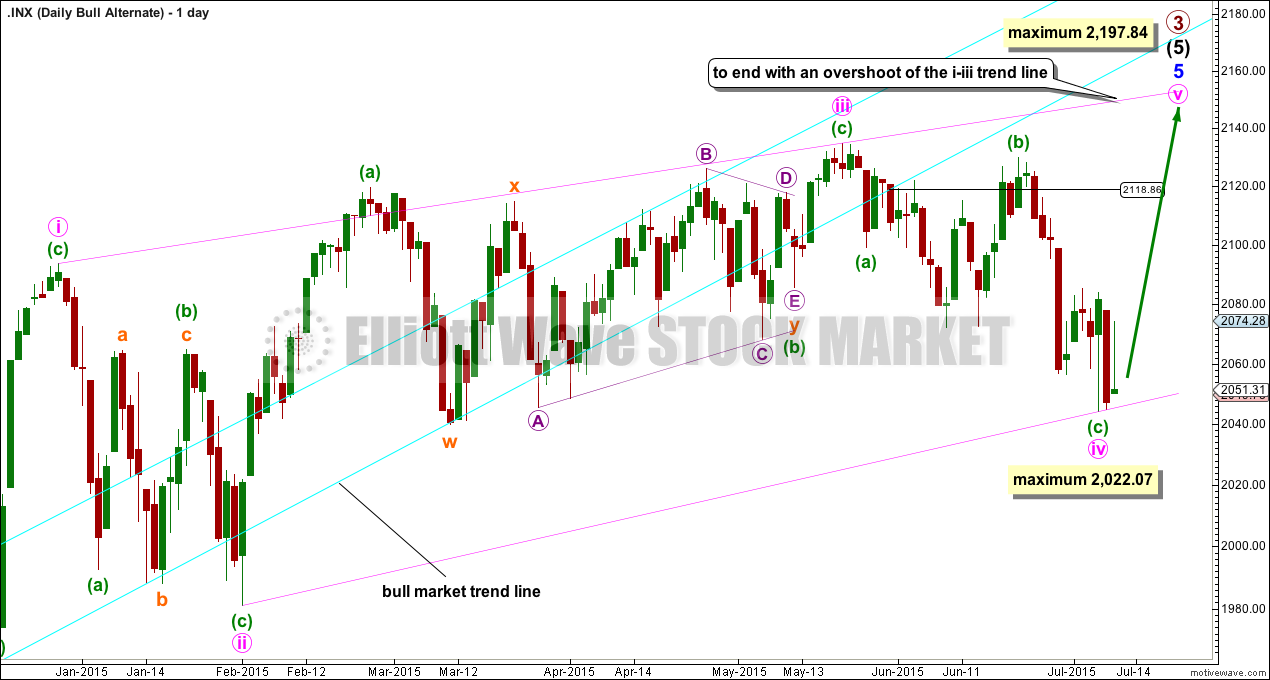
The ending contracting diagonal may still be incomplete. Ending diagonals require all sub waves to subdivide as zigzags, and the fourth wave should overlap first wave price territory. It is Elliott wave convention to always draw the diagonal trend lines to indicate a diagonal structure is expected.
The diagonal trend lines are no longer clearly contracting and minuette wave (c) within minute wave iv now looks like a three where it should be a five. This reduces the probability of this wave count.
If it moves any lower, then minute wave iv may not be longer than equality in length with minute wave ii at 2,022.07. If it is over here, then minute wave v up also has a limit and may not be longer than equality with minute wave iii at 2,197.84.
The best way to see where and when upwards movement may end is the upper diagonal i-iii trend line. It is very likely to be overshot. Upwards movement may find resistance at the long held bull market trend line.
Because the long held bull market trend line has now been breached by a close more than 3% of market value below it, this wave count is now an alternate and a bear market is indicated.
Click chart to enlarge.
Minute wave v may have begun with either minuette waves (a) and (b) complete, or only subminuette waves i and ii within minuette wave (a) complete. The degree of labelling within minute wave v may be correct here, or it could also be moved down one degree.
At this stage, if minuette waves (a) and (b) are complete, then at 2,148 minuette wave (c) would reach 2.618 the length of minuette wave (a).
I don’t have a lot of confidence in this target. When there is more structure upwards to analyse then the target may change, but it does not expect a reasonable overshoot of the i-iii diagonal trend line.
At this stage, I also don’t have confidence in this alternate wave count: the diagonal is not looking right at the daily chart level, ADX continues to indicate a downwards trend is in place, and volume continues to favour a bear market.
There is a further problem today with this wave count. The upwards wave labelled subminuette wave i for Thursday’s session subdivides strongly as a three on the five minute chart, but it should be a five.
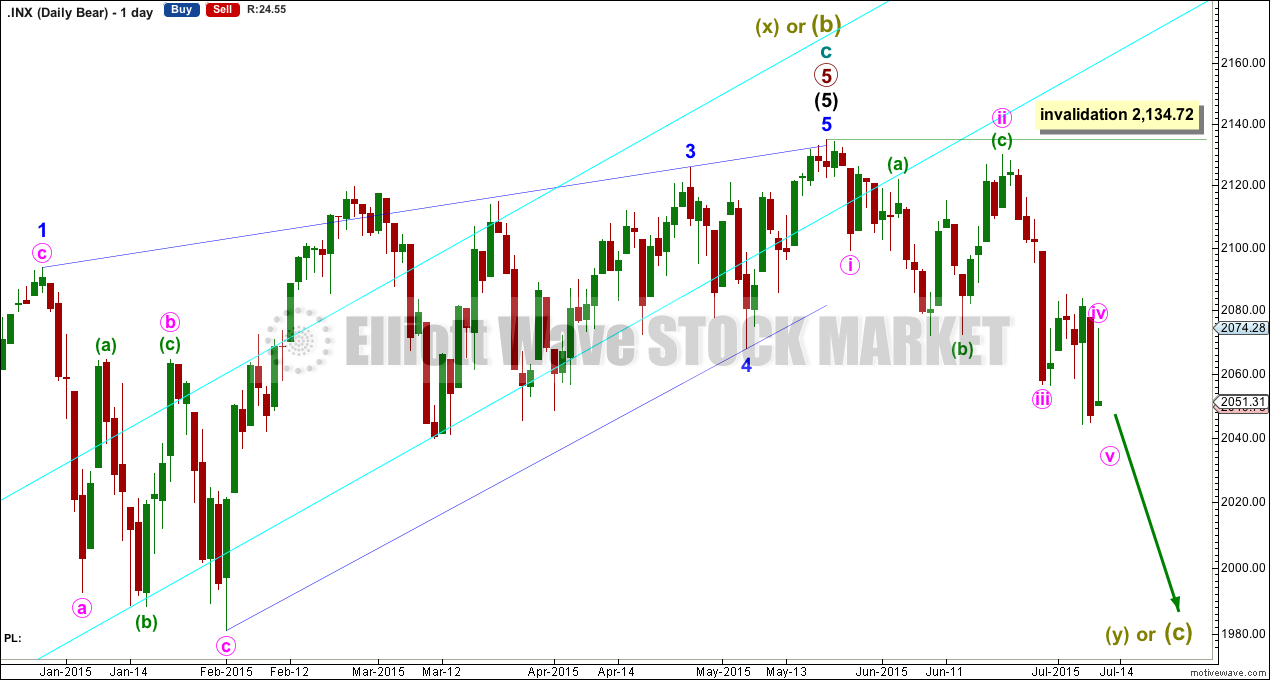
BEAR ELLIOTT WAVE COUNT
Click chart to enlarge.
The subdivisions within cycle waves a-b-c are seen in absolutely exactly the same way as primary waves 1-2-3 for the main wave count.
In line with recent Grand Super Cycle wave analysis, I have moved the degree of labelling for the bear wave count all up one degree.
This bear wave count expects a Super Cycle wave (c) to unfold downwards for a few years, and if it is a C wave it may be devastating. It may end well below 666.79.
However, if this wave down is a Super Cycle wave (y), then it may be a time consuming repeat of the last big flat correction with two market crashes within it, equivalent to the DotCom crash and the recent Global Financial Crisis, and it may take another 8-9 years to unfold sideways.
Within the new bear market, no second wave correction may move beyond the start of its first wave above 2,134.72.
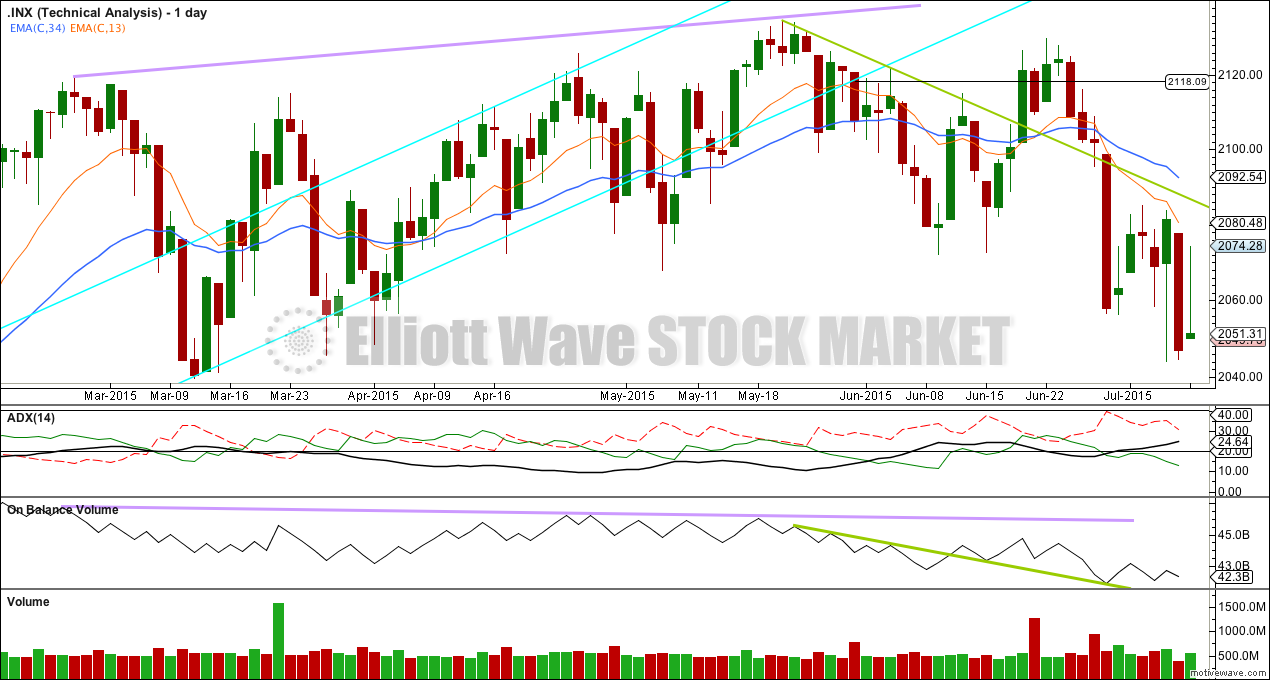
TECHNICAL ANALYSIS
Click chart to enlarge.
ADX is clearly indicating a downwards trend is in place. The shorter EMA has crossed below the longer EMA indicating a downwards trend. Of recent days (excluding dates of contract expiration), the strongest volume is seen for the down day of 25th June.
The long held orange trend line for On Balance Volume is added today to show the breach and how it is now providing resistance. This is another bearish volume indicator.
Although today’s candlestick completes as a gravestone doji, it comes within a sideways movement so as a turning signal it should be ignored. What it does do, however, is reinforce the area of resistance at today’s highs.
A note on Dow Theory: for the bear wave count I would wait for Dow Theory to confirm a huge market crash. For that to be confirmed the following new lows are needed:
S&P500: 1,820.66
Nasdaq: 4,116.60
DJT: 7,700.49
DJIA: 15,855.12
At this time DJT is closest, but none of these indices have made new major swing lows yet.
This analysis is published about 07:44 p.m. EST.
Perhaps minute four is not yet complete. VIX says we are seeing a bull trap. Hedging downside just to be safe as rally may continue into early next week.