
The Elliott wave count expected downwards movement, but this is not what happened.
Summary: Upwards movement should continue overall for several days yet. A new high above 2,099.18 would confirm the main wave count. A new low below 2,022.07 is required for initial confirmation of a bear market.
To see a weekly chart and how to draw trend lines go here.
Changes to last analysis are italicised.
Bull Wave Count
Click chart to enlarge.
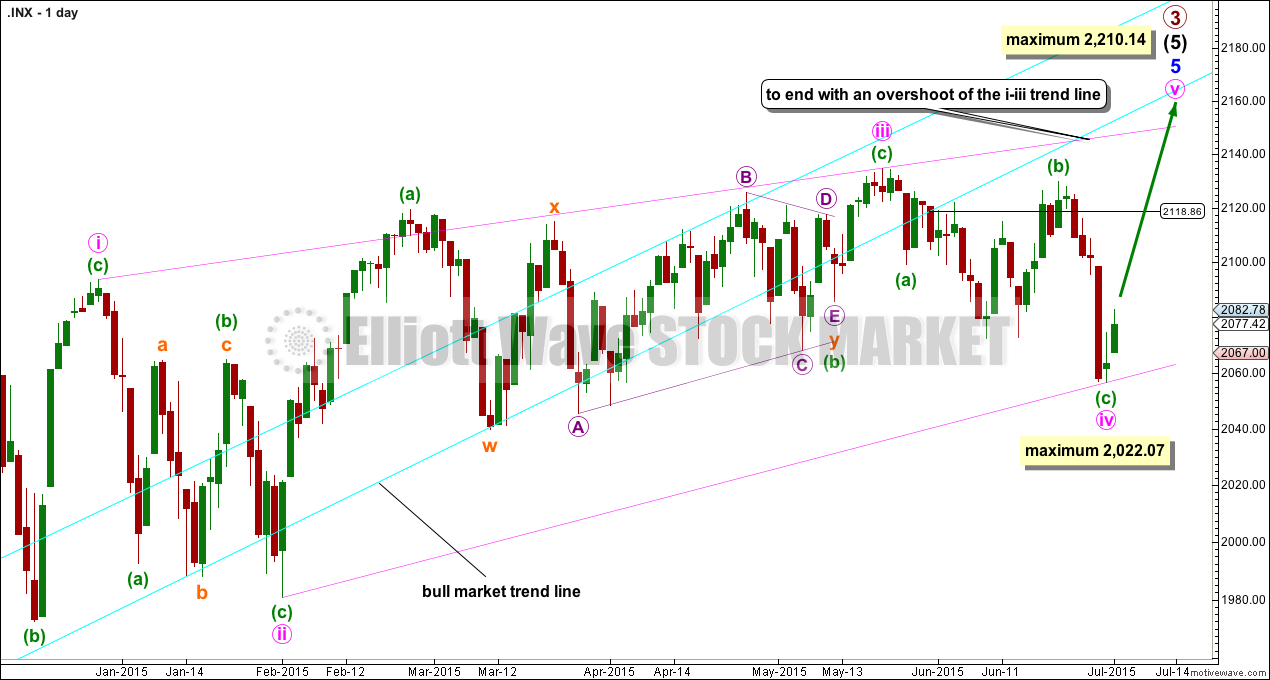
The ending contracting diagonal may still be incomplete. Minute wave iv is now very likely to be complete. Minute wave v upwards has most likely begun, and may not be longer than equality in length with minute wave iii because the diagonal is contracting and a third wave may not be the shortest. This gives a limit to upwards movement at 2,210.14.
If it moves any lower, then minute wave iv may not be longer than equality in length with minute wave ii at 2,022.07.
The bull market trend line still has not been breached by a close of 3% or more of market value since its inception in November 2011, but it is no longer exactly where price is finding support, and the strength of that line appears to be waning. If the trend line was breached at 2,188.86 (thereabouts) then a close of 3% would be needed at 2,055.
I have a preference for this bull wave count because we should always assume the trend remains the same until proven otherwise. While there is no confirmation of a bear market, I will assume the S&P remains in a bull market.
Click chart to enlarge.
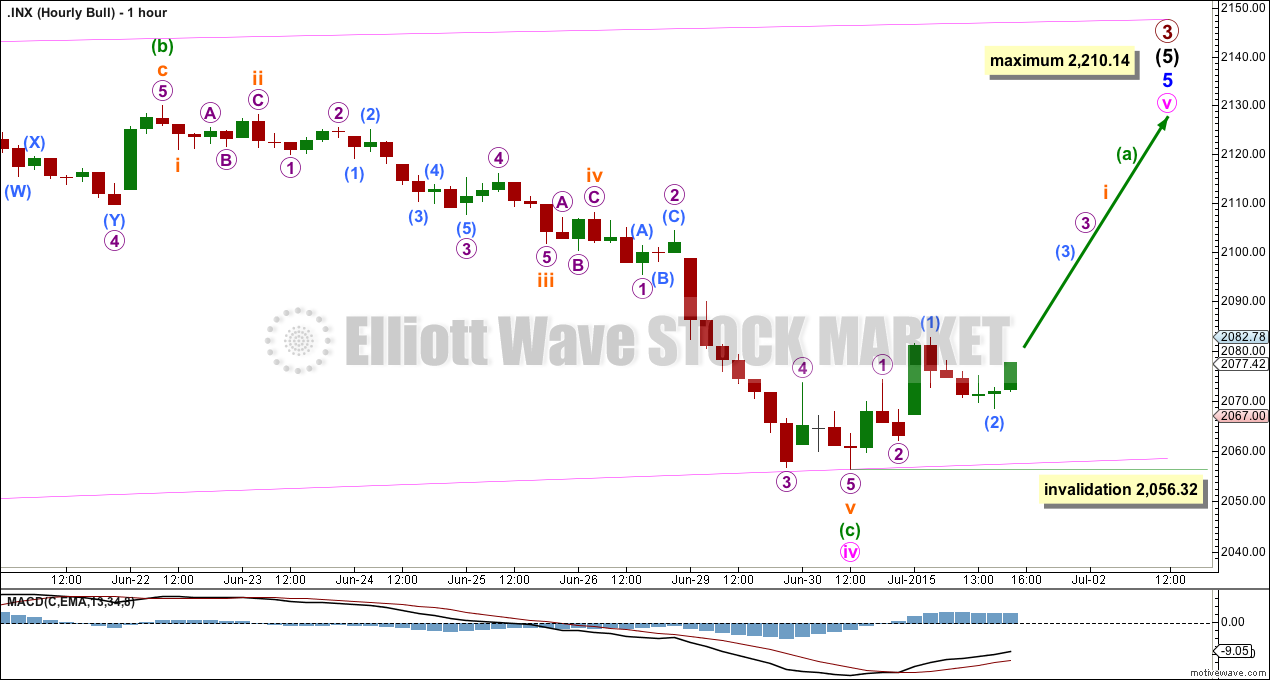
The size of upwards movement from the low looks like the start of a new wave because it appears too big now to be a fourth wave correction. A final fifth wave down must already be complete.
Minute wave v must subdivide as a zigzag. It is difficult to make a prediction about when it may end because so far within the diagonal structure none of the waves exhibit a Fibonacci duration. Minute wave i lasted 51 days, minute wave ii 23 days, minute wave iii 75 days and minute wave iv 28 days. Minute waves ii and iv are both close to 0.382 the duration of the prior actionary wave. But there is no Fibonacci ratio between the duration of minute waves i and iii, so it is impossible to say how long minute wave v will last. It may be about 21 days, but it may be longer.
The best way to see where and when minute wave v will end is probably the upper i-iii diagonal trend line. It may end when this line is overshot.
There is no Fibonacci ratio between the length of minute waves i at 272.89 points and minute wave iii at 153.82 points. Diagonal actionary waves don’t usually exhibit Fibonacci ratios. Using the length of minute wave iii to calculate a target for minute wave v would not result in an accurate target.
When minuette waves (a) and (b) are complete, then a ratio between minuette waves (a) and (c) may be used to calculate a price target for it to end. That cannot be done yet.
Alternate Bull Wave Count
Click chart to enlarge.
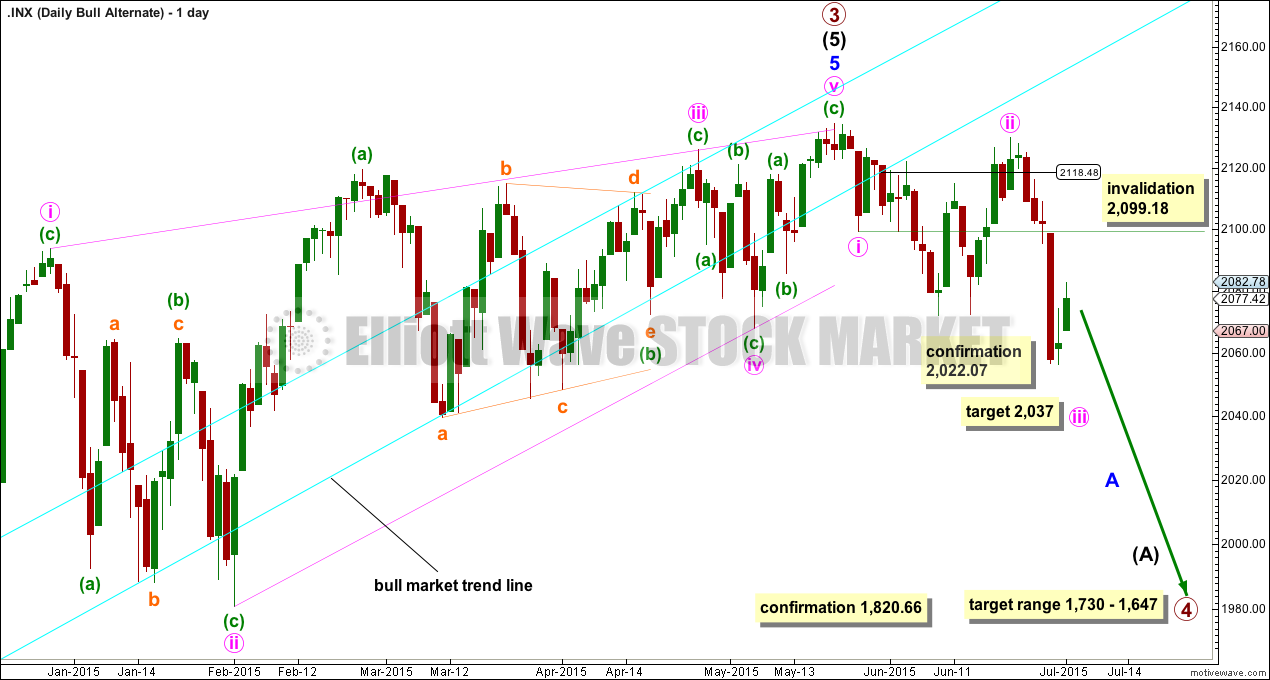
It is possible that the S&P has seen a primary degree (or for the bear count below a Super Cycle degree) trend change.
This wave count absolutely requires confirmation at the daily chart level before any confidence may be had in a primary (or Super Cycle) degree trend change. Confirmation would come with:
1. A new low below 2,022.07 to invalidate the new main wave count.
2. A clear five down on the hourly chart.
3. A close of 3% or more of market value below the lower aqua blue trend line. If the line is now breached at 2,118, then a close at 2,055 or below is required to confirm a bear market.
4. A clear five down on the daily chart.
5. A new low below 1,820.66.
As each condition is met the probability of a substantial trend change would increase.
Primary wave 4 would most likely be a time consuming flat, triangle or combination in order to exhibit structural alternation with the zigzag of primary wave 2. Primary wave 2 lasted 12 weeks. Primary wave 4 is likely to be longer in duration because combinations and triangles particularly are more time consuming than zigzags which tend to be quick corrections. Primary wave 4 may be expected to last more than 12 weeks, and may end with a total Fibonacci 13 or more likely 21 weeks.
For this more bearish wave count to be taken seriously it requires at least a clear five down on the hourly chart.
At this stage, a trend change is looking somewhat likely so I’ll list points in its favour. However, these points indicate a trend change to come and not exactly when it will happen and so they support both the main and this alternate bull wave count:
1. ADX is above 20 and rising, and the -DX line is above the +DX line indicating a new downwards trend.
2. The long held bull market trend line, the strongest piece of technical analysis on ALL charts, has been breached.
3. There is quadruple negative divergence between price and MACD on the weekly chart.
4. There is double negative divergence between price and MACD on the daily chart.
5. There is persistent and strong negative divergence between price and RSI on the monthly chart. The last time this happened was October 2007 and we all know what happened after that…
6. A long held bull trend line on On Balance Volume going back to October 2014 has been breached and is no longer providing support.
7. Nasdaq is making new all time highs. Only DJT now is required to make a new all time high to confirm continuation of a bull market. Failure of DJT to confirm the bull market does not mean a bear market exists and just indicates caution.
Bear Wave Count
Click chart to enlarge.
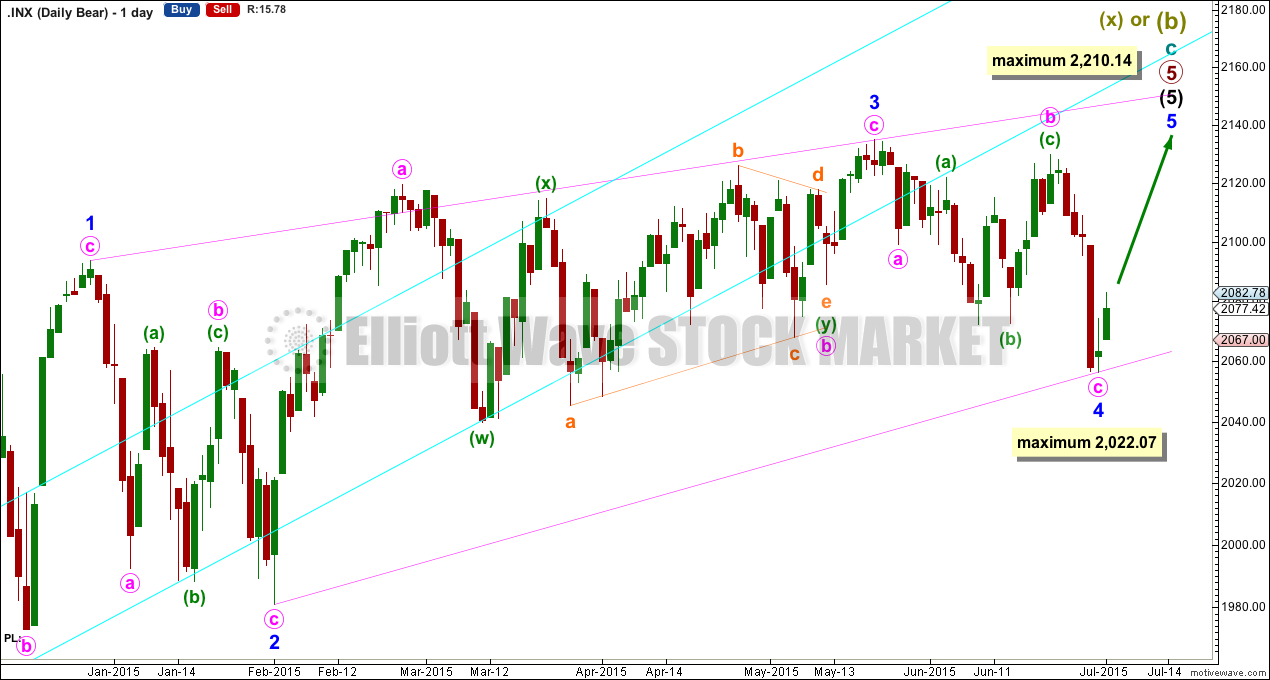
The subdivisions within cycle waves a-b-c are seen in absolutely exactly the same way as primary waves 1-2-3 for the bull wave count.
In line with recent Grand Super Cycle wave analysis, I have moved the degree of labelling for the bear wave count all up one degree. It is possible that the recent high was the end of a Super Cycle wave (b) or (x) and that Grand Super Cycle wave II is unfolding as an expanded flat, double flat or a double combination.
This bear wave count expects a Super Cycle wave (c) to unfold downwards for a few years, and if it is a C wave it may be devastating. It may end well below 666.79.
However, if this wave down is a Super Cycle wave (y), then it may be a time consuming repeat of the last big flat correction with two market crashes within it, equivalent to the DotCom crash and the recent Global Financial Crisis, and it may take another 8-9 years to unfold sideways.
At Super Cycle degree, wave (b) is over the maximum common length of 138% the length of cycle wave a, at 170% the length of cycle wave a. At 2,393 Super Cycle wave (b) would be twice the length of Super Cycle wave (a) and at that point this bear wave count should be discarded.
Technical Analysis
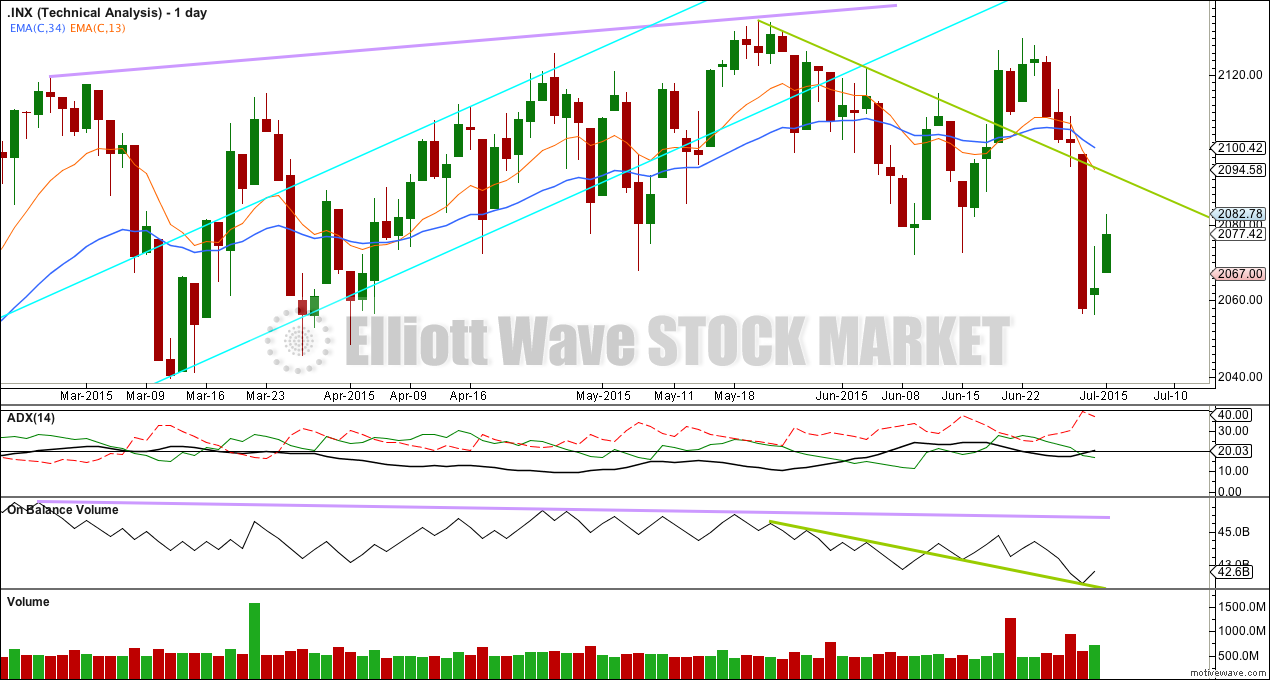
Click chart to enlarge.
ADX is now above 20 (again) and rising. This again may indicate the start of a new downwards trend.
On Balance Volume again found support at its green trend line, and from here a bounce was initiated. When price finds resistance at its green trend line, then a downwards correction may begin from there.
Tuesday’s rise in price came with increased volume. If Wednesday also shows increased volume, then this rise in price would be supported by volume and the main wave count would be favoured over the alternate.
This analysis is published about 09:18 p.m. EST.
Very cautious right now. One could make the case that S & P has broken from a H & S top with a clearly broken neckline. We are almost right back up to broken neckline for a re-test and if this is what is happening, we are never going to see that diagonal over-shoot we are expecting. The behavior of the VIX was also not very convincing as indicating an intermediate bottom. Everyone be careful out there….