
Second S&P 500 Grand SuperCycle Elliott wave analysis, from 1871.
Summary: This is my second attempt at a long term analysis for the S&P500; the two wave counts presented here are an improvement from the first attempt. The bull wave count ignores the 1840’s depression and for this reason the bear count which includes it may have a higher probability.
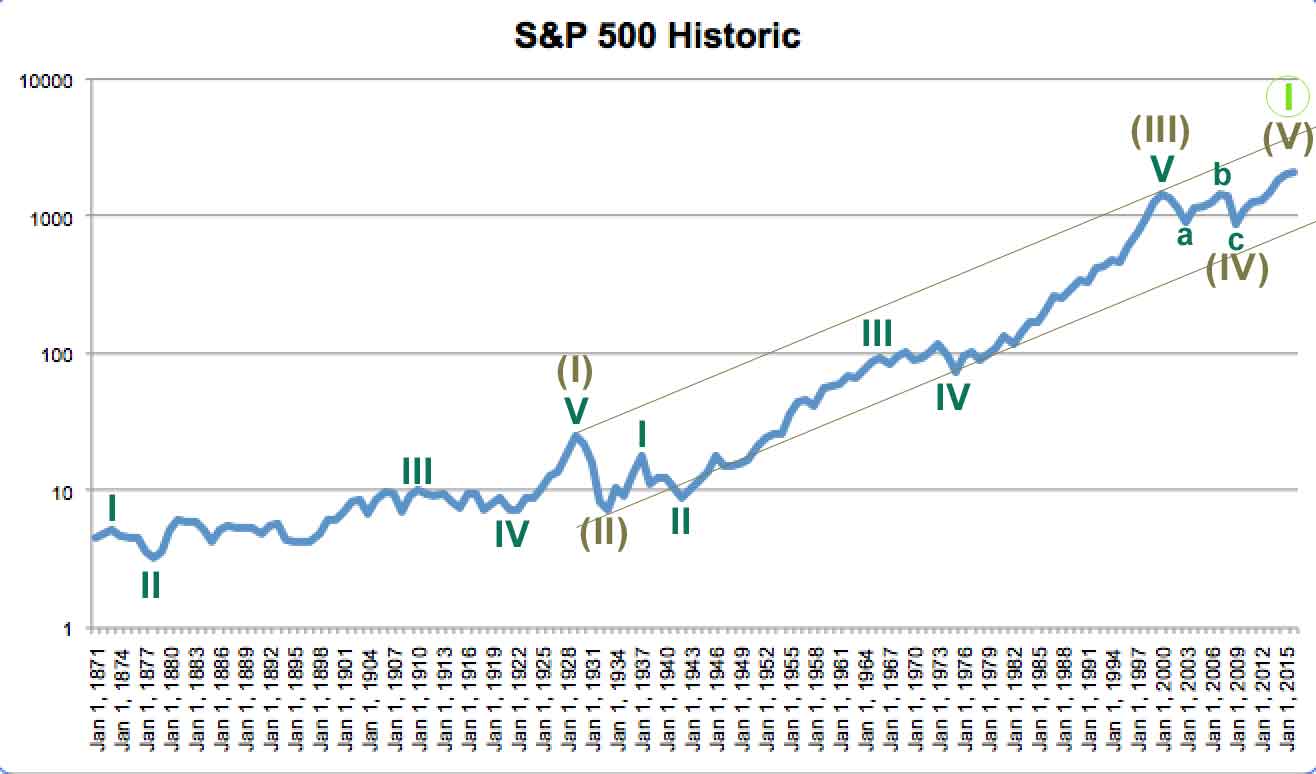
Bullish Wave Count
Click chart to enlarge.
The data prior to the inception of the S&P500 index is an amalgamation of the US stock market back to that date.
There are two approaches to the S&P500 long term analysis: either look only at data since the inception of the S&P500 in 1957, or to include an amalgamation of the entire US stock market before that date as part of the analysis. I have chosen to look at the entire market.
The data I have only goes back to 1871. This bull wave count assumes up to the market peak of 1929 a five wave impulse can be counted. This may have been a Super Cycle wave (I), and the Great Depression a Super Cycle wave (II) correction. If this assumption is wrong, then the bull wave count would not work.
If Super Cycle wave (III) began at the end of the Great Depression in 1933, then it may have ended recently in 2000. Super Cycle wave (III) would have lasted 67 years and moved price 1,523 points.
Within Super Cycle wave (III), there are no adequate Fibonacci ratios between cycle waves I, III and V. Cycle wave II is a deep 0.82 zigzag lasting 5 years, and cycle wave IV is a shallow 0.25 expanded flat lasting 9 years. There is perfect alternation between cycle waves II and IV.
Super Cycle wave (II) lasted only four years (a relatively deep quick zigzag). Super Cycle wave (IV) may be over as a more shallow flat correction, lasting 8.5 years. There is perfect alternation between Super Cycle waves (II) and (IV).
This wave count expects that Super Cycle wave (V) is underway to finally end Grand Super Cycle wave I.
It may be that a cycle degree third wave is about to complete, rather than a primary degree third wave, so the degree of labelling for the daily bull wave count may need to be moved up one degree.
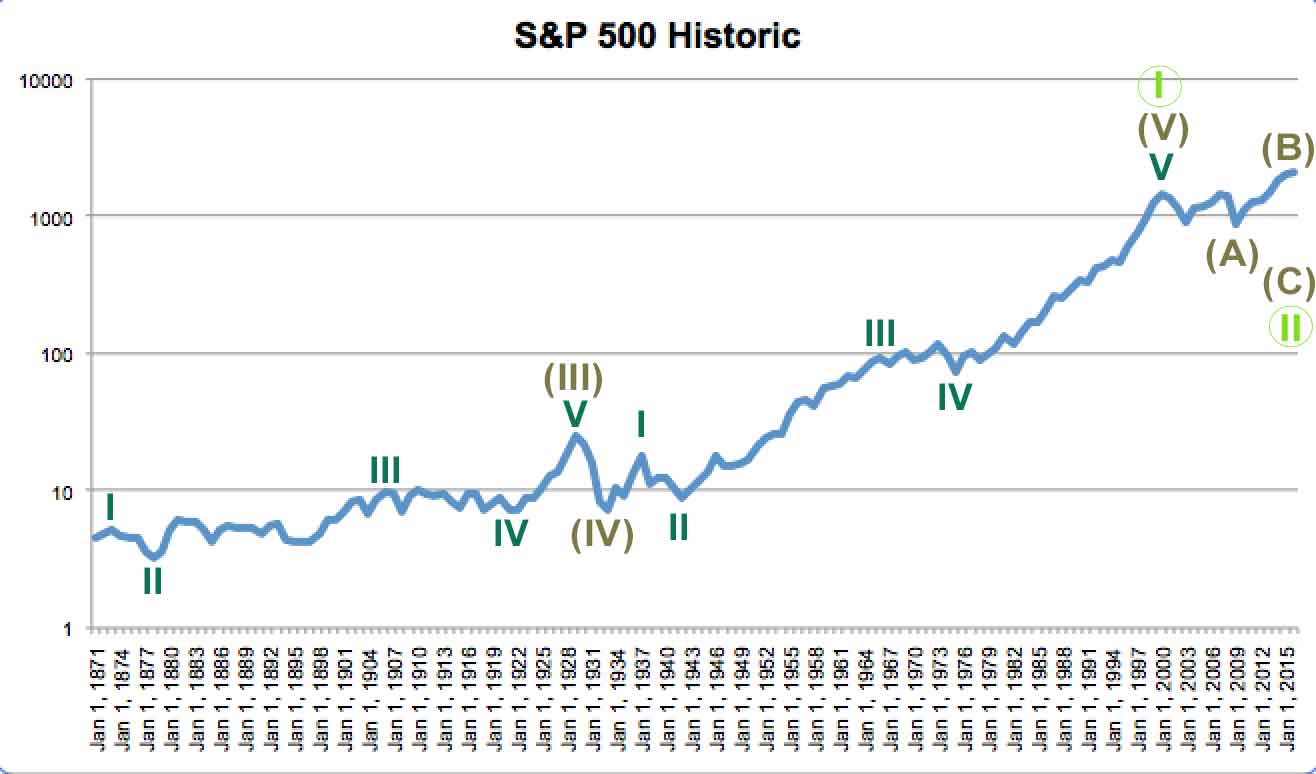
Bear Wave Count
Click chart to enlarge.
This bear wave count expects that the Depression of the 1840’s was a Super Cycle wave (II) and the Great Depression of the 1930’s was its counterpart Super Cycle wave (IV). From an historic perspective both depressions were significant, so this idea makes more sense.
The rise since the end of the Great Depression in 1933 would be a Super Cycle wave (V). Which means that a Grand Super Cycle wave I may have ended in 2000.
Within Super Cycle wave (V), the subdivisions are seen in the same way as for the bull wave count. There are no adequate Fibonacci ratios at cycle degree, but there is perfect alternation between cycle waves II and IV.
If Grand Super Cycle wave II began there, then it would most likely be incomplete. Grand Super Cycle waves should last generations, not just 8.5 years. The first flat correction would most likely be Super Cycle wave (A) of an expanded flat. But it may also be Super Cycle wave (W) of a double flat or combination.
This analysis means that the degree of labelling for the bear wave count at the daily chart level should also be moved up one degree.
This analysis is published about 04:50 a.m. EST.
I am starting to think the Bullish count is correct but that we are also seeing the completion of a Grand Super Cycle Wave. It may be that the upcoming GSC wave 2 correction will mirror the super-cycle correction of 1929 in its intensity and rapidity.
For bullish count, cycle three of super cycle five seems quite brief compared to that of super cycle three…assuming of course that it is close to completion.
I see…. yes. It would be more brief. However, a cycle degree wave should last one to several years. So far this one would have lasted 3.6 years.
And this is the problem right there with the bull wave count. It’s looking for the end to a fifth wave… at Super Cycle degree. Which is a notoriously difficult thing to do.
Bottoms are easier to pick than tops. I would be using trend lines to show when the fifth wave is over. I think trend lines are the best indicator although they can be quite lagging.
Thanks so much for the big perspective.
It’s also starting to look to me like institutions are unloading big blocks on central bank buying the last several weeks (based on comparative volume on up and down days). Shanghai had an intra-day swing of almost 7%!!
If this is indeed happening then we are very close to a top indeed if not there already. Buying the dips and selling the rips has been working well but only if you exit intra-day. A big key reversal day will I think tell the tale…this market is definitely touch and go…