
The main Elliott wave count expected overall more upwards movement with corrections to find support at the lower edge of the channel on the hourly chart.
A small green candlestick for Wednesday fits the main Elliott wave count, and the lower edge of the channel is close to where price is finding support.
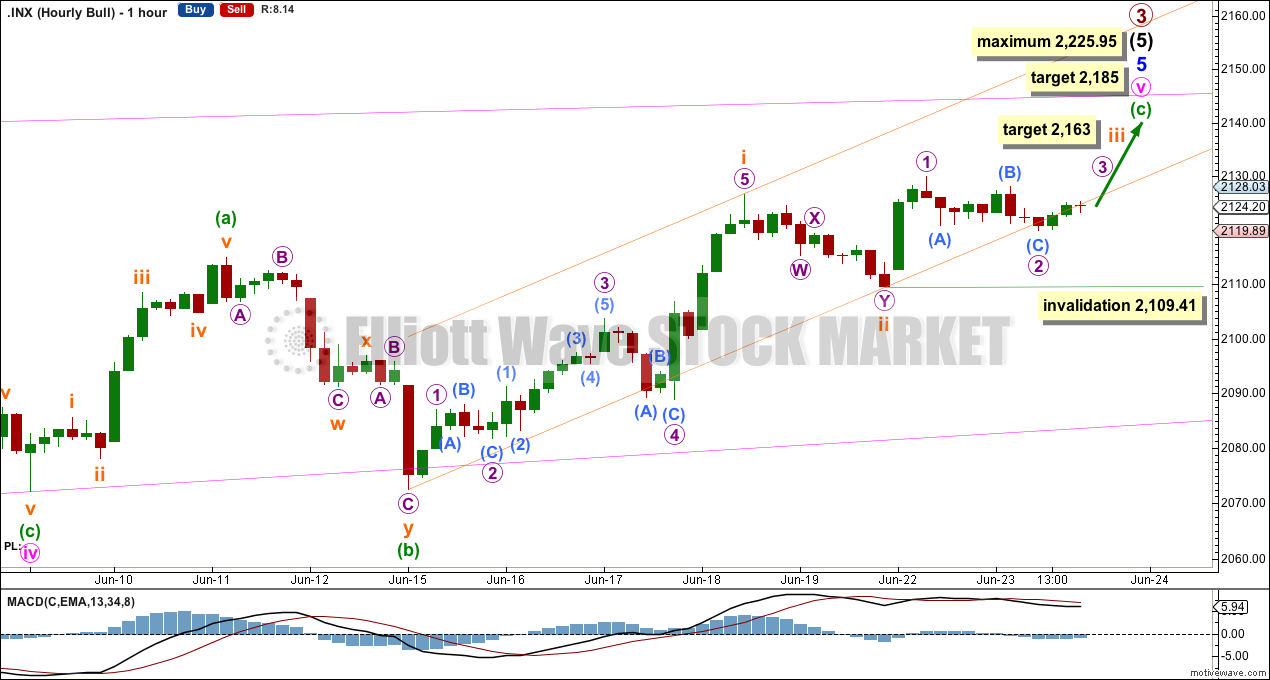
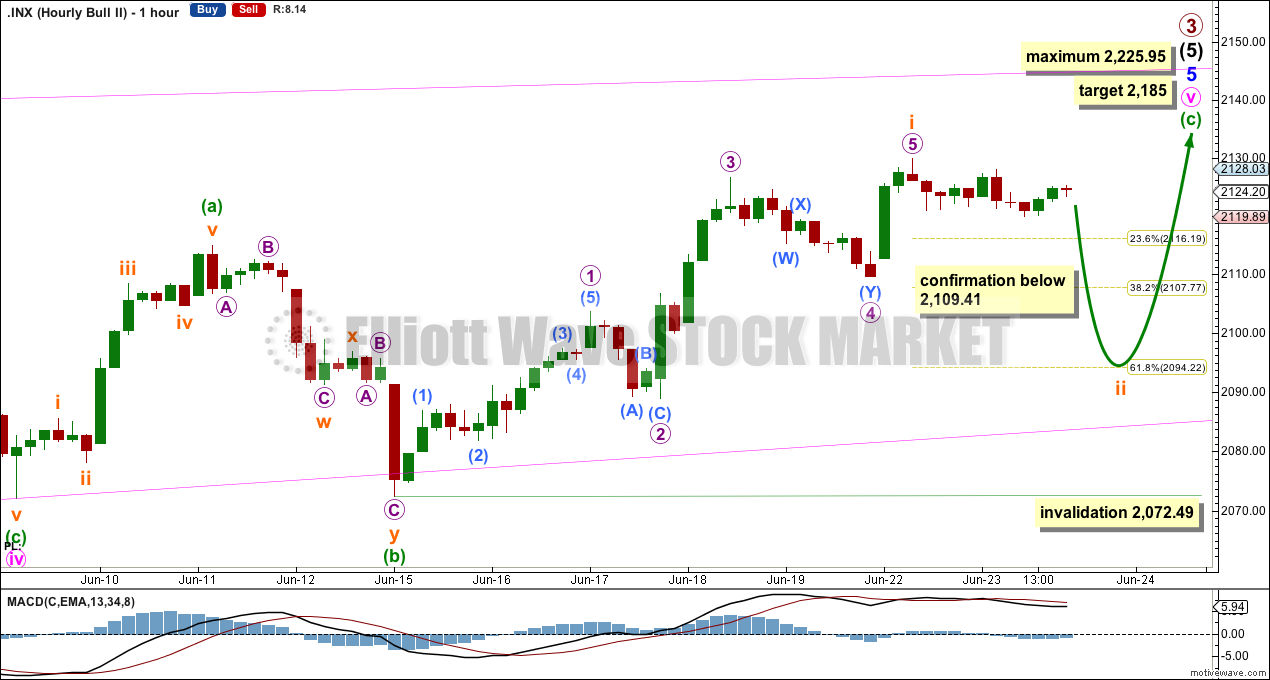
Summary: I have two hourly wave counts for you today. The first more likely count expects upwards movement to show a small increase in upwards momentum tomorrow and has a short term target at 2,163 which may be met in two to three days time. The final target remains the same at this stage, at 2,185, but this may change. If the channel on the first hourly chart is breached by downwards movement early tomorrow, then the second wave count may be correct and would be confirmed with a new low below 2,109.41. The second count expects a second wave correction to move lower and most likely end about 2,094.
To see a weekly chart and how to draw trend lines go here.
Changes to last analysis are italicised.
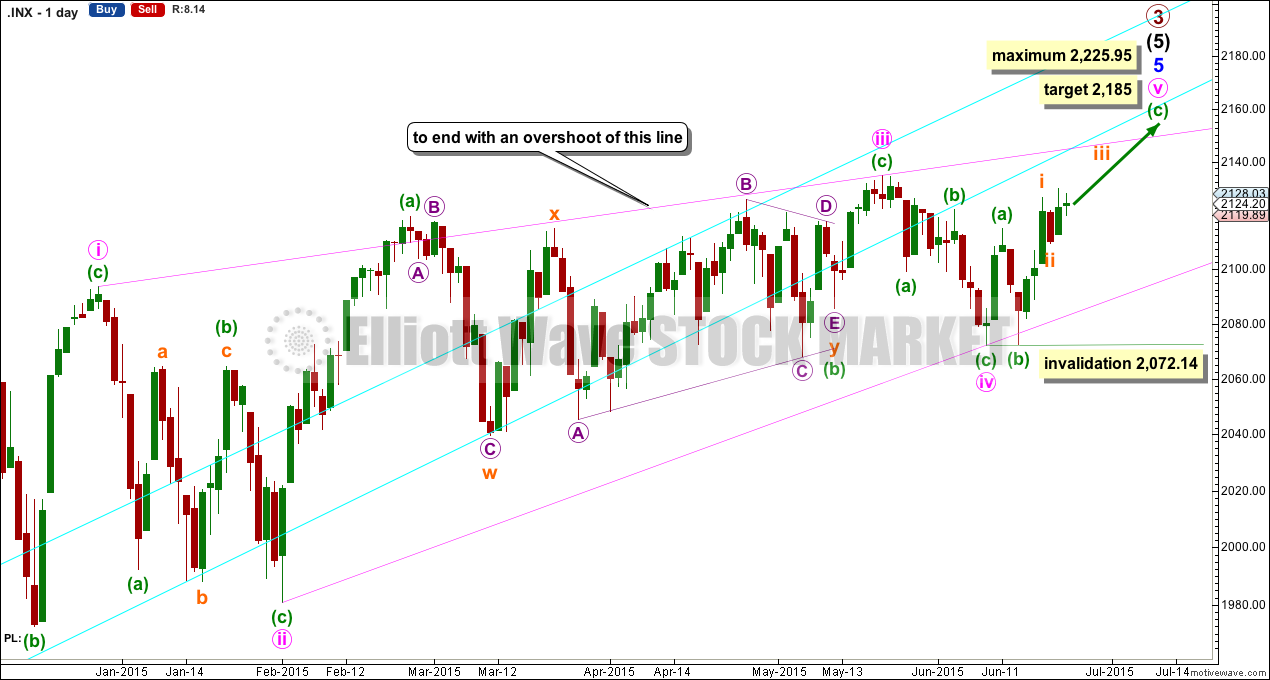
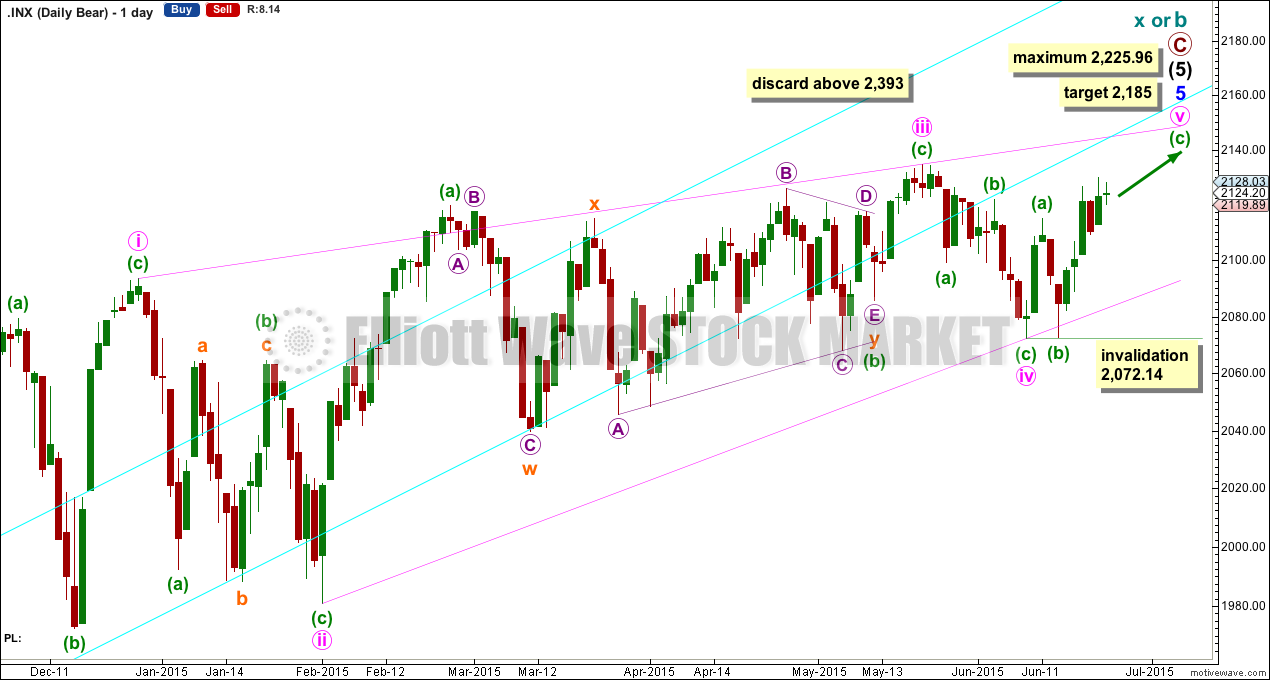
Bull Wave Count
Click chart to enlarge.
The ending contracting diagonal may still be incomplete.
The diagonal is contracting. Minute wave iii is shorter than minute wave i, and minute wave iv is shorter than minute wave ii. Minute wave iv overlaps into minute wave i price territory as it must for a diagonal. Within an ending diagonal, all the sub waves must subdivide as zigzags.
At 2,185, minuettte wave (c) would reach 2.618 the length of minuette wave (a); this target allows for a reasonable overshoot of the upper i-iii diagonal trend line.
The diagonal trend lines would cross over on 3rd November. The diagonal must end a reasonable amount of time before that date, because diagonals end before their trend lines cross. If upwards movement ends on 26th June, then minute wave v may end in a total Fibonacci 13 sessions. The next Fibonacci number would be 21 which would see upwards movement end on 8th July.
Minuette wave (b) may not move beyond the start of minuette wave (a) below 2,072.14.
Minute wave v may not be longer than equality with minute wave iii at 2,225.95, and the third wave may not be the shortest.
Overall this wave count has a good look. It sees minute wave iii as complete at the more recent high, and within it minuette wave b is a combination: zigzag – X – triangle.
The trend line still has not been breached by a close of 3% or more of market value since its inception in November 2011, but it is no longer exactly where price is finding support, and the strength of that line appears to be waning.
I have a preference for this bull wave count because we should always assume the trend remains the same until proven otherwise. While there is no confirmation of a bear market I will assume the S&P remains in a bull market.
If upwards movement continues past the limit of minute wave v at 2,255.95, then I will again publish the very bullish alternate.
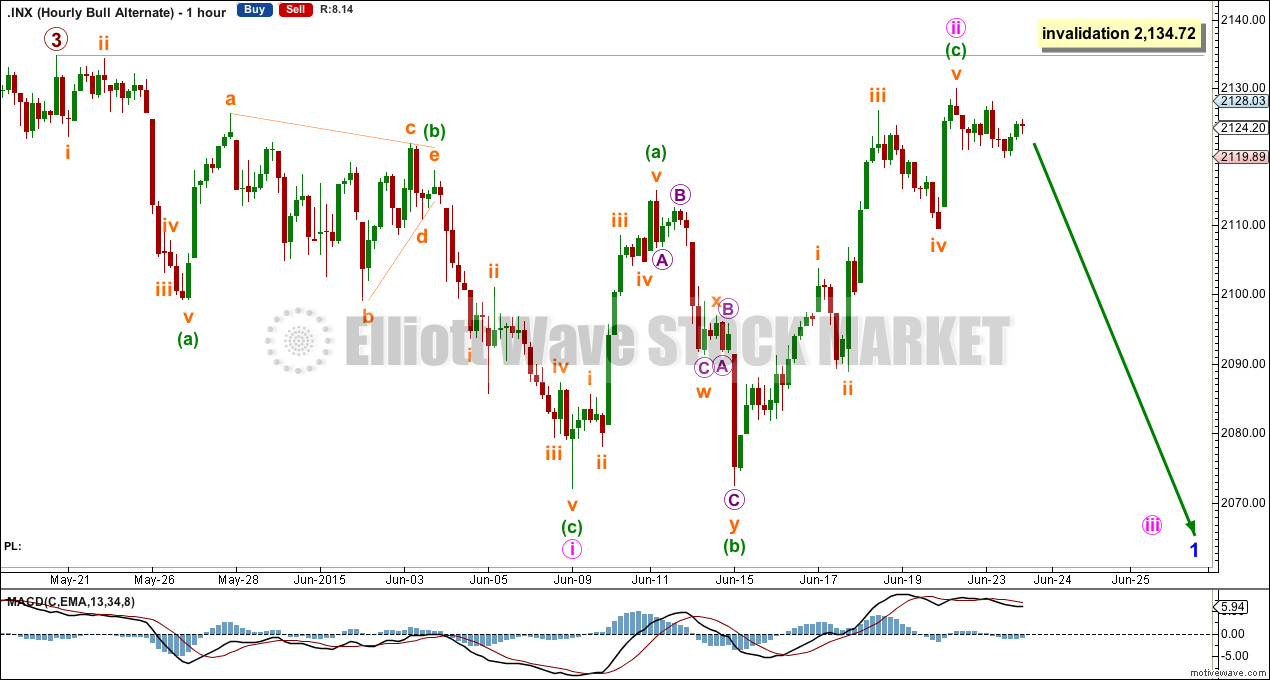
First Hourly Chart
Click chart to enlarge.
Within the impulse of minuette wave (c), it still looks likely that subminuette waves i and ii are complete, and subminuette wave iii is underway. At 2,163 subminuette wave iii would reach equality in length with subminuette wave i (this target is changed from yesterday, that target looks now to be too low).
Ratios within subminuette wave i are: micro wave 3 is 1.57 short of 1.618 the length of micro wave 1, and micro wave 5 is 2.45 longer than 1.618 the length of micro wave 3 and just 0.09 short of 2.618 the length of micro wave 1.
Because of the very good Fibonacci ratios and the red candlestick on the daily chart for subminuette wave ii, this first hourly wave count has a higher probability than the second count below.
Subminuette wave iii should show its subdivisions clearly on the hourly chart. So far micro waves 1 and now likely 2 are complete. Micro wave 3 within subminuette wave iii should show an increase in upwards momentum beyond that seen for subminuette wave i.
Along the way up corrections should find support at the lower edge of the base channel drawn here about subminuette waves i and ii.
If price begins to move lower when the market opens tomorrow and it breaches the lower edge of the base channel, then the second wave count below may be likely. A new low below 2,109.41 would invalidate this first wave count and confirm the second below.
Second Hourly Chart
Click chart to enlarge.
It is possible that only subminuette wave i ended on Tuesday and that subminuette wave ii is yet to unfold lower.
Ratios within subminuette wave i are: there is no adequate Fibonacci ratio between micro waves 3 and 1, and micro wave 5 is 1.19 longer than 0.618 the length of micro wave 1.
On the daily chart subminuette wave i has a three wave look to it because of the red candlestick for micro wave 4.
Subminuette wave ii may end about the 0.618 Fibonacci ratio at 2,094. If it reaches lower than that, then it should find strong support at the lower pink ii-iv diagonal trend line copied over here from the daily chart.
Subminuette wave ii may not move beyond the start of subminuette wave i below 2,072.49.
Alternate Bull Wave Count
Click chart to enlarge.
It is possible that the S&P has seen a primary degree (or for the bear count below a cycle degree) trend change.
This wave count absolutely requires confirmation at the daily chart level before any confidence may be had in a primary (or cycle) degree trend change. Confirmation would come with:
1. A new low below 2,072.14.
2. A clear five down on the hourly chart.
3. A close of 3% or more of market value below the lower aqua blue trend line. If the line is now breached at 2,118, then a close at 2,055 or below is required to confirm a bear market.
4. A clear five down on the daily chart.
5. A new low below 1,820.66.
As each condition is met the probability of a substantial trend change would increase.
Primary wave 4 would most likely be a time consuming flat, triangle or combination in order to exhibit structural alternation with the zigzag of primary wave 2. Primary wave 2 lasted 12 weeks. Primary wave 4 is likely to be longer in duration because combinations and triangles particularly are more time consuming than zigzags which tend to be quick corrections. Primary wave 4 may be expected to last more than 12 weeks, and may end with a total Fibonacci 13 or more likely 21 weeks.
For this more bearish wave count to be taken seriously it requires at least a clear five down on the hourly chart.
At this stage, a trend change is looking somewhat likely so I’ll list points in its favour. However, these points indicate a trend change to come and not exactly when it will happen and so they support both the main and this alternate bull wave count:
1. ADX is above 20, and the -DX line is above the +DX line indicating a new downwards trend.
2. The long held bull market trend line, the strongest piece of technical analysis on ALL charts, has again been recently breached. But the breach was small and did not close 3% or more of market value below the line, so a bear market is not indicated.
3. There is quadruple negative divergence between price and MACD on the weekly chart.
4. There is double negative divergence between price and MACD on the daily chart.
5. There is persistent and strong negative divergence between price and RSI on the monthly chart. The last time this happened was October 2007 and we all know what happened after that…
6. A long held bull trend line on On Balance Volume going back to October 2014 has been breached and is no longer providing support.
7. Nasdaq is making new all time highs. Only DJT now is required to make a new all time high to confirm continuation of a bull market. Failure of DJT to confirm the bull market does not mean a bear market exists and just indicates caution.
Click chart to enlarge.
The only possibility for a first wave down now is a leading diagonal. This has a lower probability than an impulse, so the probability of a trend change at primary degree (or cycle degree for the bear count below) having occurred at the last all time high is low.
Leading diagonals require sub waves 2 and 4 to be zigzags, and sub waves 1, 3 and 5 are also most commonly zigzags but may sometimes be impulses.
Second and fourth waves within diagonals are normally deep, between 0.66 to 0.81 of the prior wave, but here minute wave ii is much deeper at 0.93 and the structure is now complete. The probability of this alternate is reduced.
Minute wave ii may not move beyond the start of minute wave i above 2,134.72.
Bear Wave Count
Click chart to enlarge.
The subdivisions within primary waves A-B-C are seen in absolutely exactly the same way as primary waves 1-2-3 for the alternate bull wave count.
To see the difference at the monthly chart level between the bull and bear ideas look at the last historical analysis here.
At cycle degree, wave b is over the maximum common length of 138% the length of cycle wave a, at 170% the length of cycle wave a. At 2,393 cycle wave b would be twice the length of cycle wave a and at that point this bear wave count should be discarded.
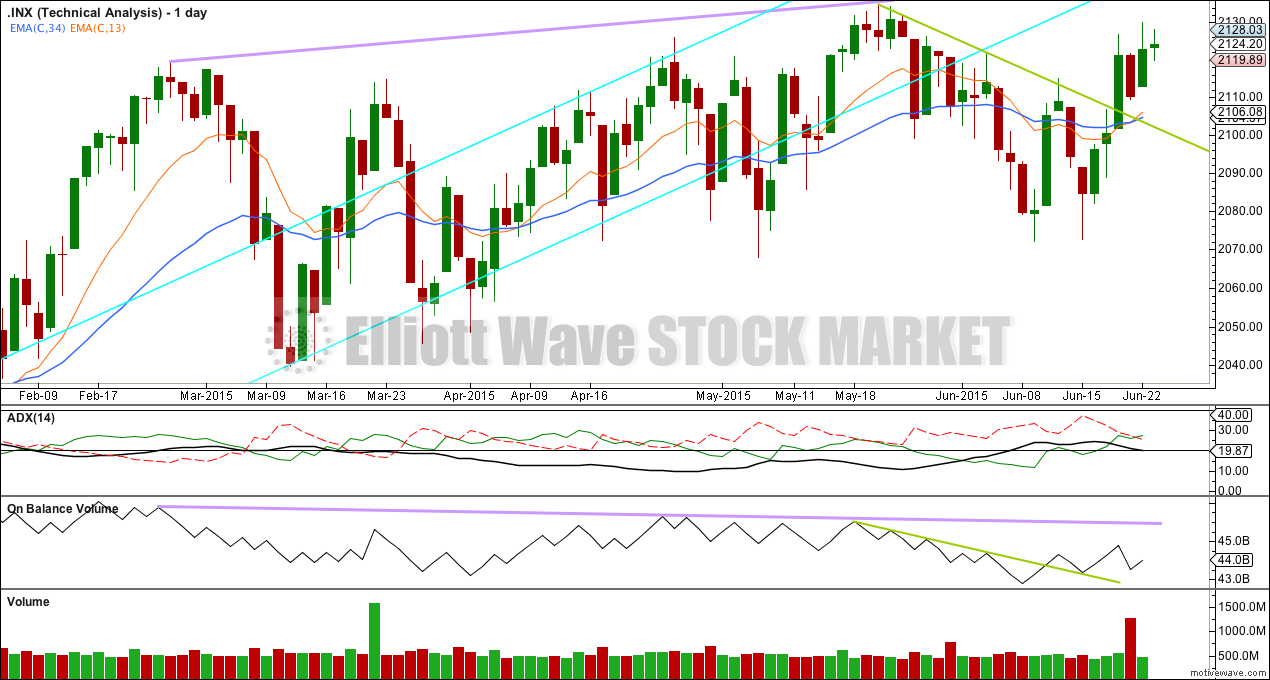
Technical Analysis
Click chart to enlarge.
ADX is now below 20 and declining, there is no clear trend, and the S&P 500 is range bound.
On Balance Volume indicates more upwards movement; this rise in price for the last seven days is supported by OBV moving higher.
The longer lilac trend line on OBV may provide resistance; when OBV touches that trend line it may be where upwards movement ends. There is negative divergence so far since February between price moving higher and OBV moving lower, indicating that when the next trend change comes it may be longer and deeper than recent corrections.
This analysis is published about 07:16 p.m. EST.
It is quite interesting that we can now get an overshoot of the diagonal 1-3 trend-line without overtaking the lower aqua-blue trend-line formerly providing support. Perhaps the latter will provide resistance to upward movement and tell us when we can expect a trend reversal?