
S&P 500 Grand SuperCycle Elliott wave analysis, from 1871.
Summary: The bear wave count has a better overall look.
Bullish Wave Count
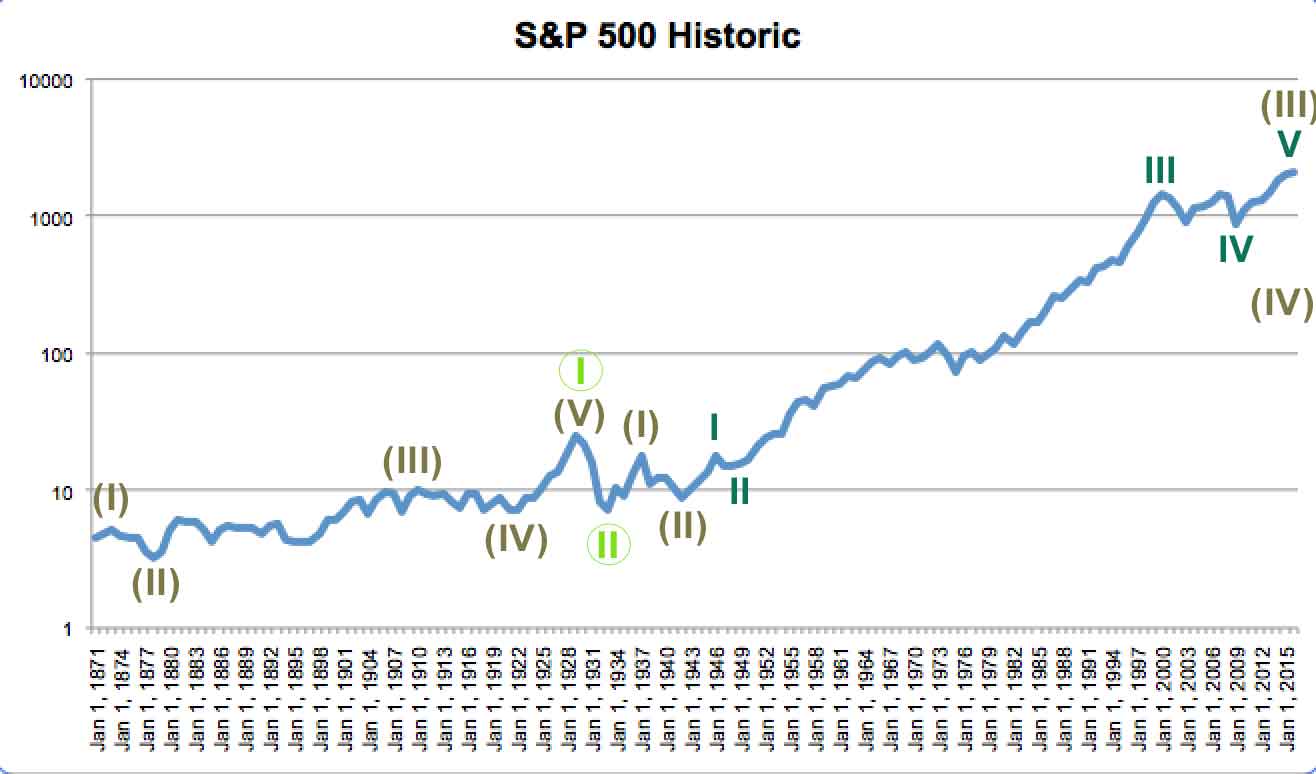
Click chart to enlarge.
The data prior to the inception of the S&P500 index is an amalgamation of the US stock market back to that date.
There are two approaches to the S&P500 long term analysis: either look only at data since the inception of the S&P500 in 1957, or to include an amalgamation of the entire US stock market before that date as part of the analysis. I have chosen to look at the entire market.
The bull count looks more forced than the bear.
I have a Grand Super Cycle wave ending at the market peak of 24.86 in 1929. This is the same for both wave counts in this analysis. This assumes lower lows for the start of Grand Super Cycle wave I which are not on this chart. The length of Super Cycle wave (I) cannot be known so the ratios within Grand Super Cycle I cannot be calculated.
The Great Depression is seen for both bull and bear counts as a Grand Super Cycle wave II correction.
Thereafter, the wave counts look at the following upwards movement differently.
The bull count sees Grand Super Cycle wave III as incomplete.
Within Grand Super Cycle wave III, Super Cycle waves (I) and (II) are complete and Super Cycle wave (III) is within its fifth wave.
Grand Super Cycle wave III begins at 7.09 in 1933. Super Cycle wave (I) ends at 17.59 in 1937, and Super Cycle wave (II) ends and Super Cycle wave (III) begins at 8.93 in 1942.
Within Super Cycle wave (III), cycle wave I ends at 18.02 in 1946, and was 9.09 in length. Cycle wave II was a quick shallow 0.35 zigzag.
Cycle wave III ends at 1,530.09 in 2000, and was 1,515.26 in length.
Cycle wave IV ends at 666.79 in March 2009, a 0.57 correction of cycle wave III, and subdivides as a flat providing perfect alternation with cycle wave II.
Cycle wave V is subdividing as a simple impulse. Within it, primary wave 3 is nearing its end and primary wave 4 has not yet unfolded.
The biggest problem I can see with this wave count is that it must see the huge correction which unfolded during the 1970’s as a primary degree correction within cycle wave III.
Bear Wave Count
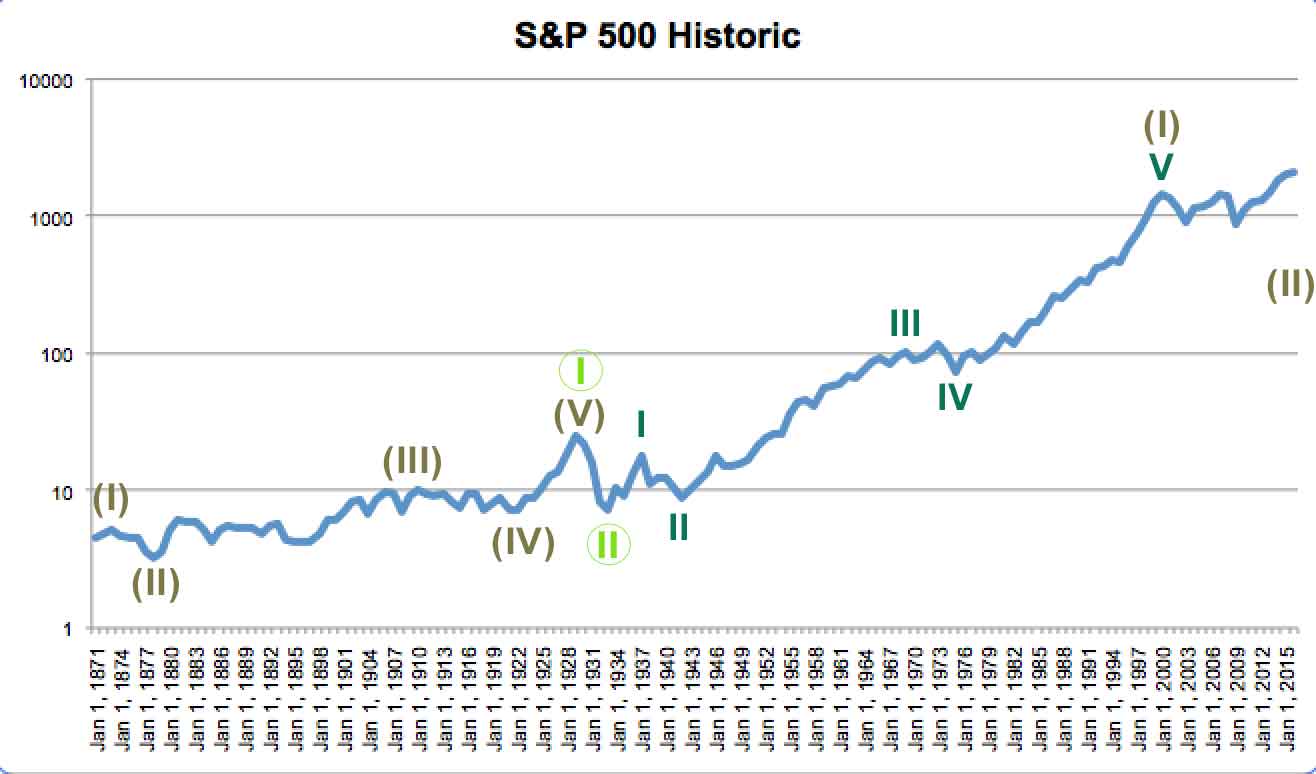
Click chart to enlarge.
The bear wave count is identical to the bull wave count up to the start of Grand Super Cycle wave III.
Within Super Cycle wave (I) of Grand Super Cycle wave III, cycle wave I ends at 17.59 in 1937, and was 10.50 in length. Cycle wave II is a 0.49 correction subdividing as a zigzag. Cycle wave III begins at 8.93 in 1942, ends at 93.32 in 1966, and was 84.39 in length. There is no Fibonacci ratio between cycle waves I and III.
Cycle wave IV looks like a flat correction which was a 0.24 depth of cycle wave III. There is perfect alternation between the deeper zigzag of cycle wave II and the shallow flat of cycle wave IV.
Cycle wave V ends at 1,530.01 in September 2000. For the bear wave count this ends Super Cycle wave (I) and so currently Super Cycle wave (II) would be unfolding as either a flat, double flat or combination.
Super Cycle wave (I) is 1,522.92 in length. A possible target for Super Cycle wave (II) to end would be the 0.618 Fibonacci ratio at 581.76.
This analysis is published about 05:24 a.m. EST.
On a first reading it’s as clear as mud, any chance of a video enplanation and an explanation of the noationsfor the dummies amongst us.
Yes, there’s a pretty reasonable chance that will happen this week.
Hi Lara, thanks for this Grand Supercycle perspective. In your “Bear Wave Count”, is there a possible alternate count, where Super Cycle wave (II) already ended at 666.79 in 2009?
I too am interested in that question by hoart Lara.
I’ve wondered this for a while now.
Yes. That is entirely possible.
I’m not actually very happy with either of these counts so far. I have a new idea today, when I’m finished with it I’ll publish it. Then I’ll do a video.