
The main Elliott wave count expected upwards movement, but this is not what happened.
Downwards movement remains above the invalidation point on the hourly Elliott wave chart.
Summary: There is zero confirmation of a trend change from bull to bear. The main wave count will therefore expect to see a continuation of the upwards trend; the target remains the same at 2,185, and it may be reached on 26th June or 8th July. A new low below 2,072.14 would invalidate this idea; at that stage, it would be possible that upwards movement may be over.
To see a weekly chart and how to draw trend lines go here.
Changes to last analysis are italicised.
Bull Wave Count
Click chart to enlarge.
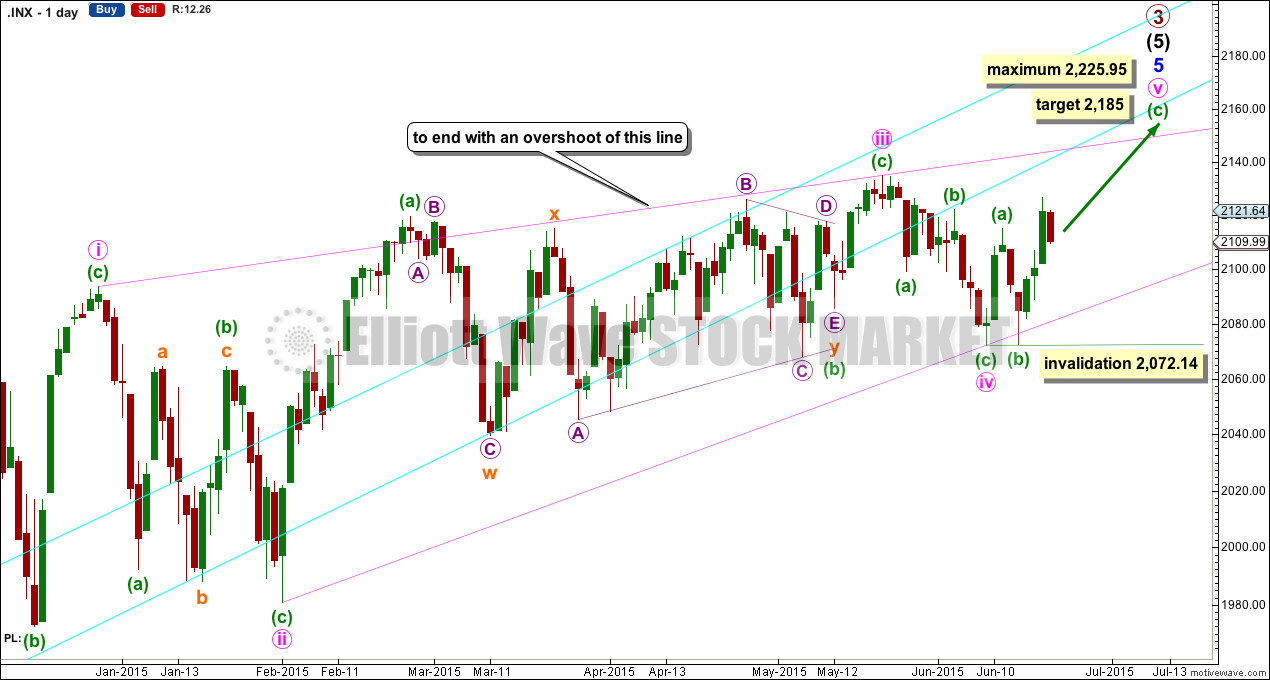
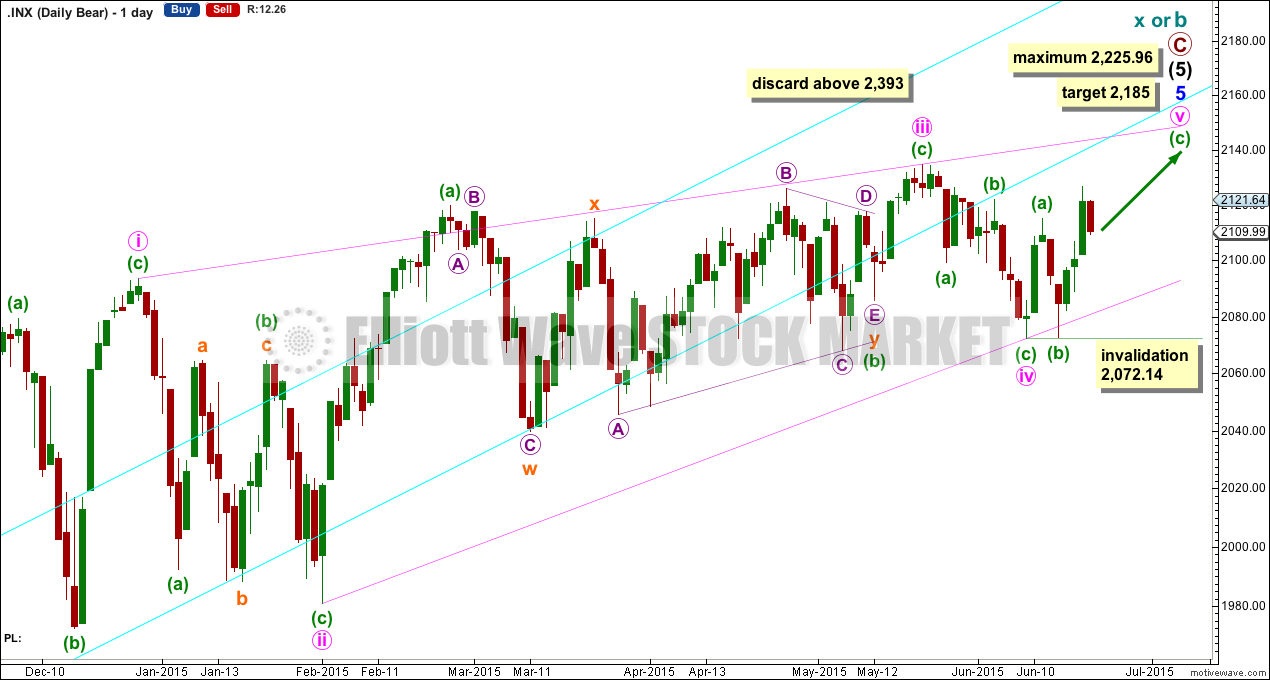
The ending contracting diagonal may still be incomplete.
The diagonal is contracting. Minute wave iii is shorter than minute wave i, and minute wave iv is shorter than minute wave ii. Minute wave iv overlaps into minute wave i price territory as it must for a diagonal. Within an ending diagonal, all the sub waves must subdivide as zigzags.
At 2,185, minuettte wave (c) would reach 2.618 the length of minuette wave (a); this target allows for a reasonable overshoot of the upper i-iii diagonal trend line.
The diagonal trend lines would cross over on 3rd November. The diagonal must end a reasonable amount of time before that date, because diagonals end before their trend lines cross. If upwards movement ends on 26th June, then minute wave v may end in a total Fibonacci 13 sessions. The next Fibonacci number would be 21 which would see upwards movement end on 8th July.
Minuette wave (b) may not move beyond the start of minuette wave (a) below 2,072.14.
Minute wave v may not be longer than equality with minute wave iii at 2,225.95, and the third wave may not be the shortest.
Overall this wave count has a good look. It sees minute wave iii as complete at the more recent high, and within it minuette wave b is a combination: zigzag – X – triangle.
The trend line still has not been breached by a close of 3% or more of market value since its inception in November 2011, but it is no longer exactly where price is finding support, and the strength of that line appears to be waning.
I have a preference for this bull wave count because we should always assume the trend remains the same until proven otherwise. While there is no confirmation of a bear market I will assume the S&P remains in a bull market.
If upwards movement continues past the limit of minute wave v at 2,255.95, then I will again publish the very bullish alternate.
Click chart to enlarge.
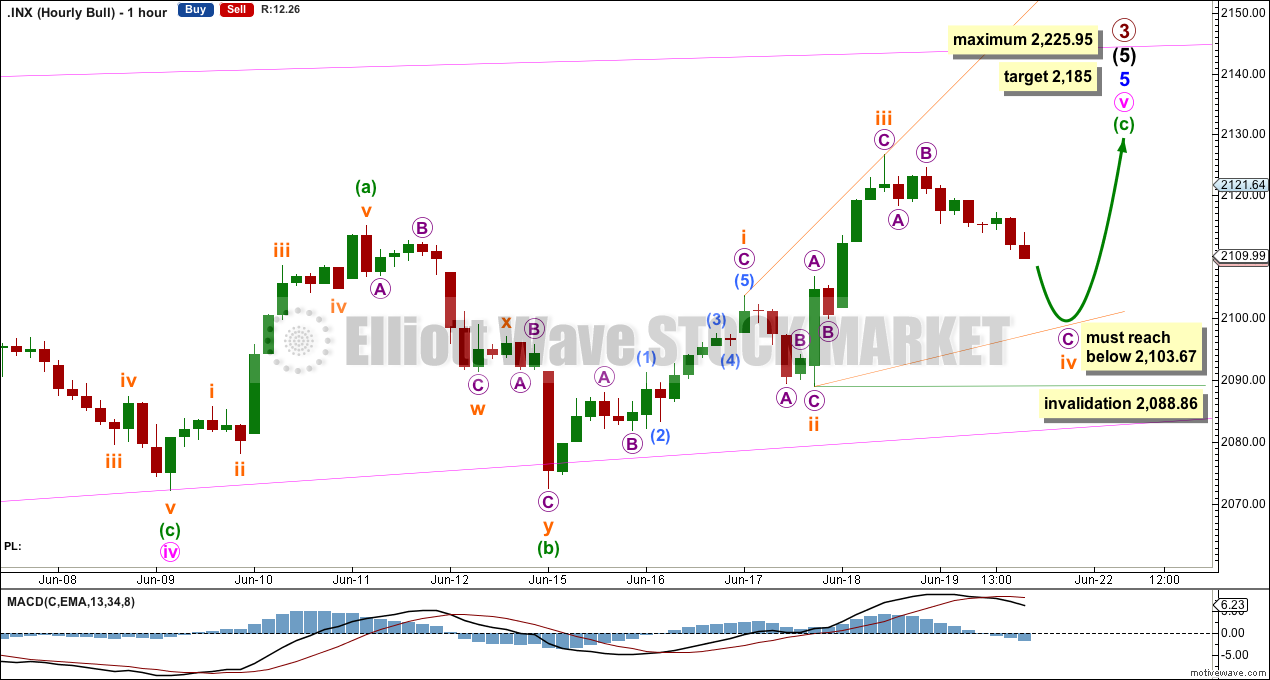
Upwards movement within minuette wave (c) is not subdividing as a series of clear five wave structures upwards, but instead the movement looks more like three wave structures upwards. Minuette wave (c) may be unfolding as an ending expanding diagonal.
Subminuette wave iii is longer than subminuette wave i so the diagonal would be expanding.
Subminuette wave iv must overlap back into subminuette wave i price territory below 2,103.67. The most common depth for a fourth wave of a diagonal is between 0.66 to 0.81 of the third wave giving a range for subminuette wave iv of 2,102 to 2,096.
Subminuette wave iv may not move beyond the end of subminuette wave ii below 2,088.86.
Alternate Bull Wave Count
Click chart to enlarge.
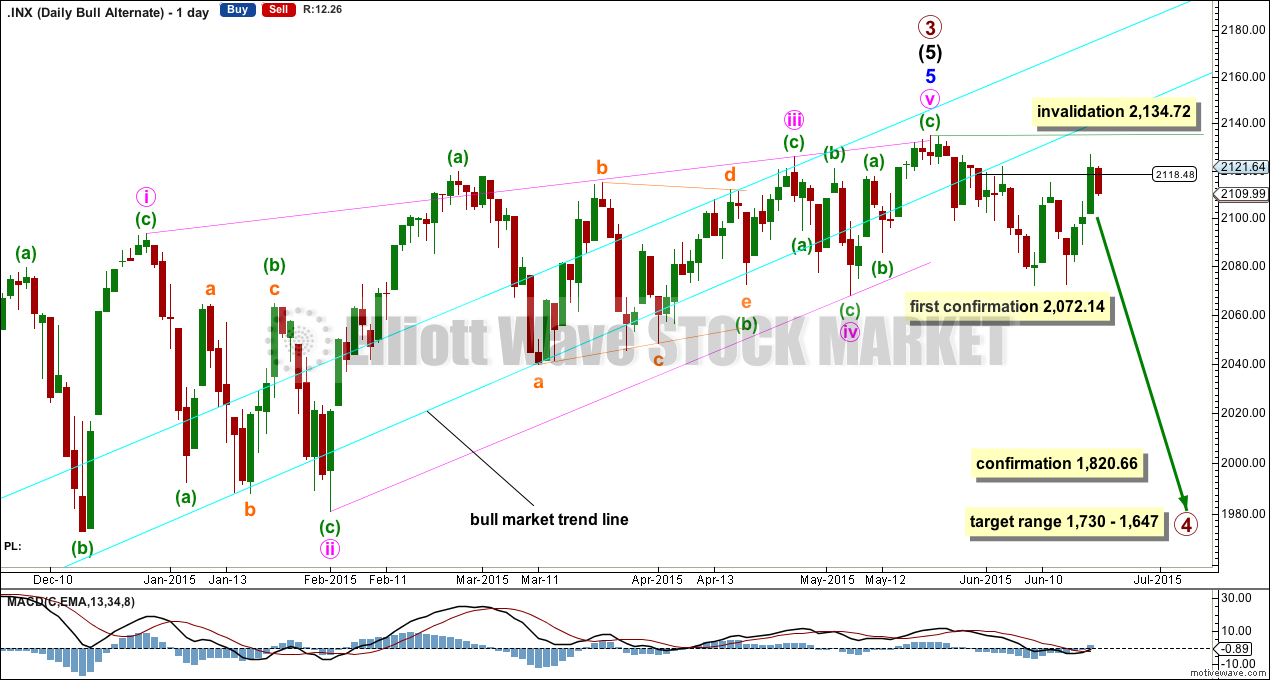
It is possible that the S&P has seen a primary degree (or for the bear count below a cycle degree) trend change twenty one days ago.
This wave count absolutely requires confirmation at the daily chart level before any confidence may be had in a primary (or cycle) degree trend change. Confirmation would come with:
1. A new low below 2,072.14.
2. A clear five down on the hourly chart.
3. A close of 3% or more of market value below the lower aqua blue trend line. If the line is now breached at 2,118, then a close at 2,055 or below is required to confirm a bear market.
4. A clear five down on the daily chart.
5. A new low below 1,820.66.
As each condition is met the probability of a substantial trend change would increase.
Primary wave 4 would most likely be a time consuming flat, triangle or combination in order to exhibit structural alternation with the zigzag of primary wave 2. Primary wave 2 lasted 12 weeks. Primary wave 4 is likely to be longer in duration because combinations and triangles particularly are more time consuming than zigzags which tend to be quick corrections. Primary wave 4 may be expected to last more than 12 weeks, and may end with a total Fibonacci 13 or more likely 21 weeks.
For this more bearish wave count to be taken seriously it requires at least a clear five down on the hourly chart.
At this stage, a trend change is looking somewhat likely so I’ll list points in its favour. However, these points indicate a trend change to come and not exactly when it will happen and so they support both the main and this alternate bull wave count:
1. ADX is above 20, and the -DX line is above the +DX line indicating a new downwards trend.
2. The long held bull market trend line, the strongest piece of technical analysis on ALL charts, has again been recently breached. But the breach was small and did not close 3% or more of market value below the line, so a bear market is not indicated.
3. There is quadruple negative divergence between price and MACD on the weekly chart.
4. There is double negative divergence between price and MACD on the daily chart.
5. There is persistent and strong negative divergence between price and RSI on the monthly chart. The last time this happened was October 2007 and we all know what happened after that…
6. A long held bull trend line on On Balance Volume going back to October 2014 has been breached and is no longer providing support.
7. Nasdaq today made a new all time high. Only DJT now is required to make a new all time high to confirm continuation of a bull market. Failure of DJT to confirm the bull market does not mean a bear market exists and just indicates caution.
Click chart to enlarge.
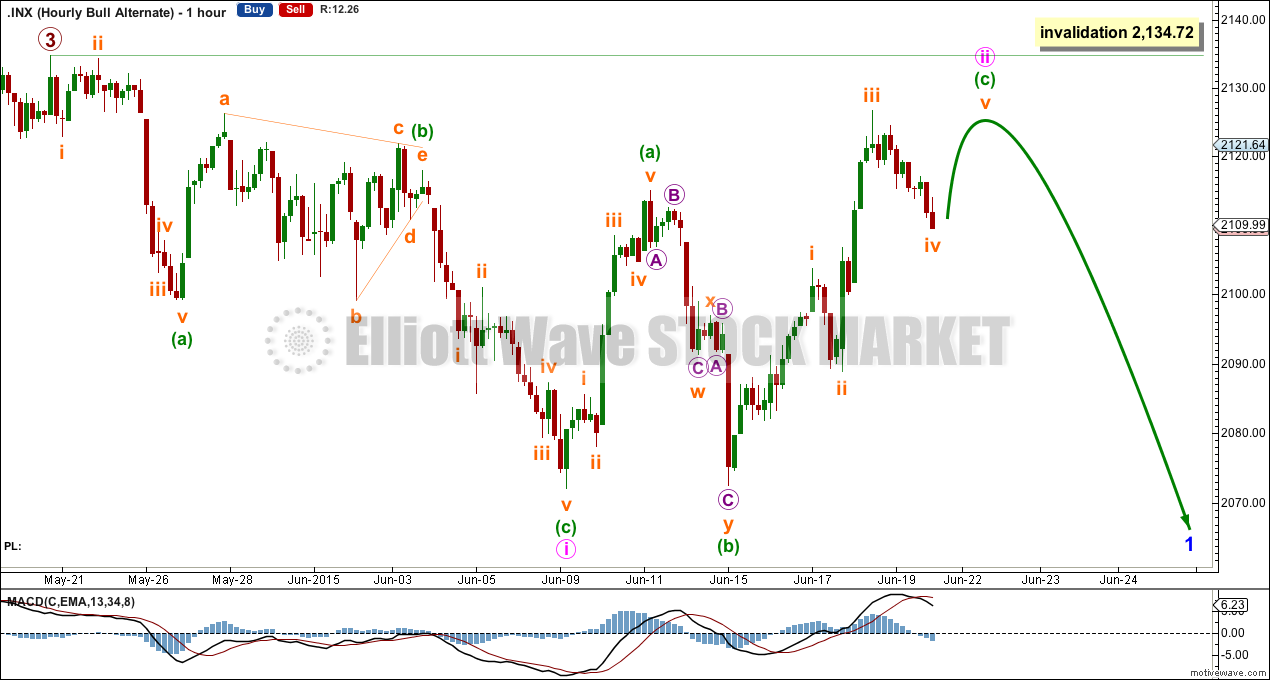
The only possibility for a first wave down now is a leading diagonal. This has a lower probability than an impulse, so the probability of a trend change at primary degree (or cycle degree for the bear count below) having occurred at the last all time high has further reduced.
Leading diagonals require sub waves 2 and 4 to be zigzags, and sub waves 1, 3 and 5 are also most commonly zigzags but may sometimes be impulses.
Second and fourth waves within diagonals are normally deep, between 0.66 to 0.81 of the prior wave, but here minute wave ii is much deeper at 0.87 and the structure is incomplete. The probability of this alternate is further reduced.
Minute wave ii may not move beyond the start of minute wave i above 2,134.72.
Bear Wave Count
Click chart to enlarge.
The subdivisions within primary waves A-B-C are seen in absolutely exactly the same way as primary waves 1-2-3 for the alternate bull wave count.
To see the difference at the monthly chart level between the bull and bear ideas look at the last historical analysis here.
At cycle degree, wave b is over the maximum common length of 138% the length of cycle wave a, at 170% the length of cycle wave a. At 2,393 cycle wave b would be twice the length of cycle wave a and at that point this bear wave count should be discarded.
Technical Analysis
Click chart to enlarge.
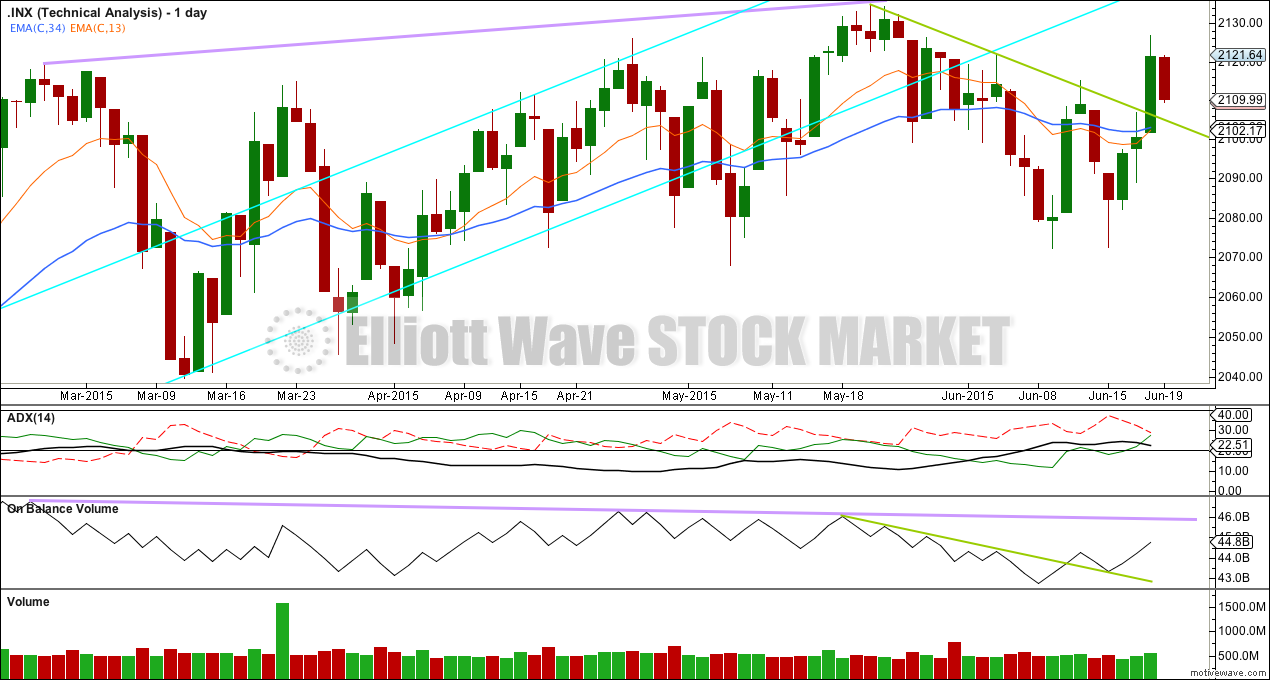
ADX is no longer so clearly indicating the start of a new downwards trend. The ADX line is flat to declining, but still above 20. The -DX line is now almost touching the +DX line. There is no longer a clear downwards trend.
On Balance Volume remains a leading indicator. The breach by OBV of its green trend line and the negative divergence there was the earliest warning of upwards movement.
The last three up days have seen increasing volume; this rise in price is supported by volume.
This current rise in price may end when OBV comes to touch its lilac trend line which began back in February. This may be the first leading indicator of the next trend change.
Along the way up, the green trend line on price may provide support to corrections.
This analysis is published about 05:54 p.m. EST.
Monday’s action looks like a buy the rumor scenario. This run-up in the absence of an actual agreement with Greece is quite interesting, especially on such weak volume. I am watching from the sidelines.