
Upwards movement again favours the bull Elliott wave count.
Summary: There is zero confirmation of a trend change from bull to bear. The main wave count will therefore expect to see a continuation of the upwards trend; the target remains the same at 2,185, and it may be reached on 8th July. A new low below 2,072.14 would invalidate this idea; at that stage, it would be possible that upwards movement may be over.
To see a weekly chart and how to draw trend lines go here.
Changes to last analysis are italicised.
Bull Wave Count
Click chart to enlarge.
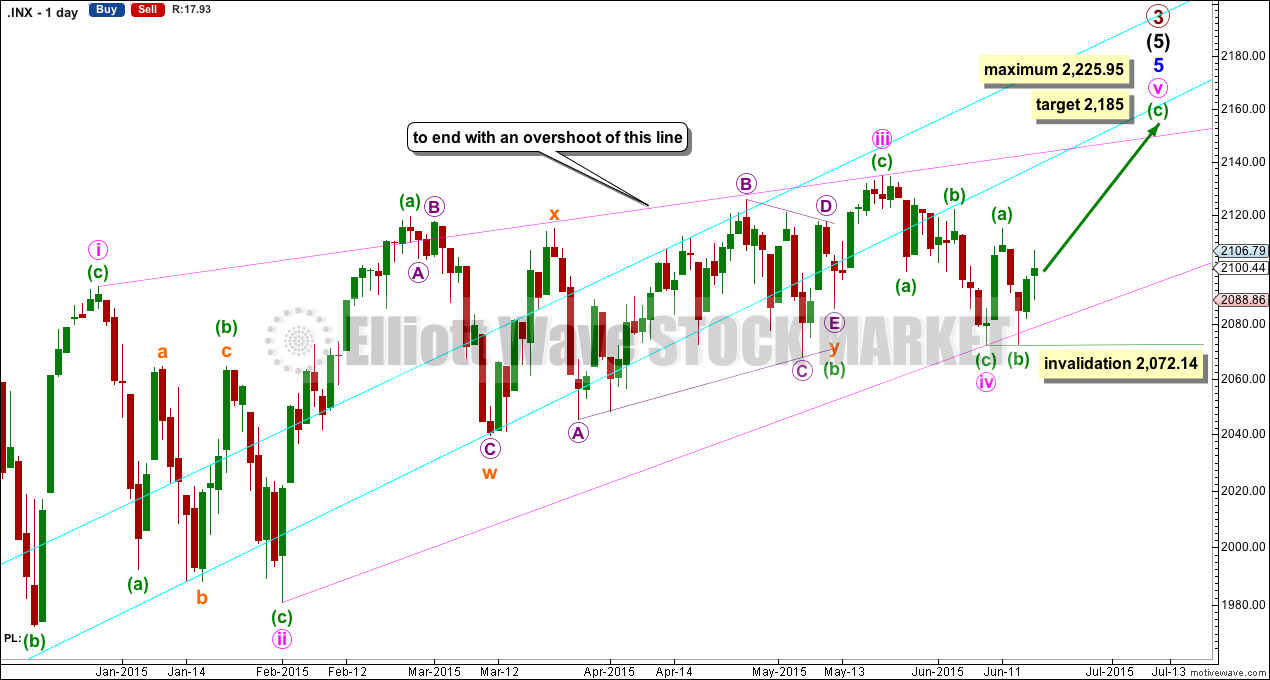
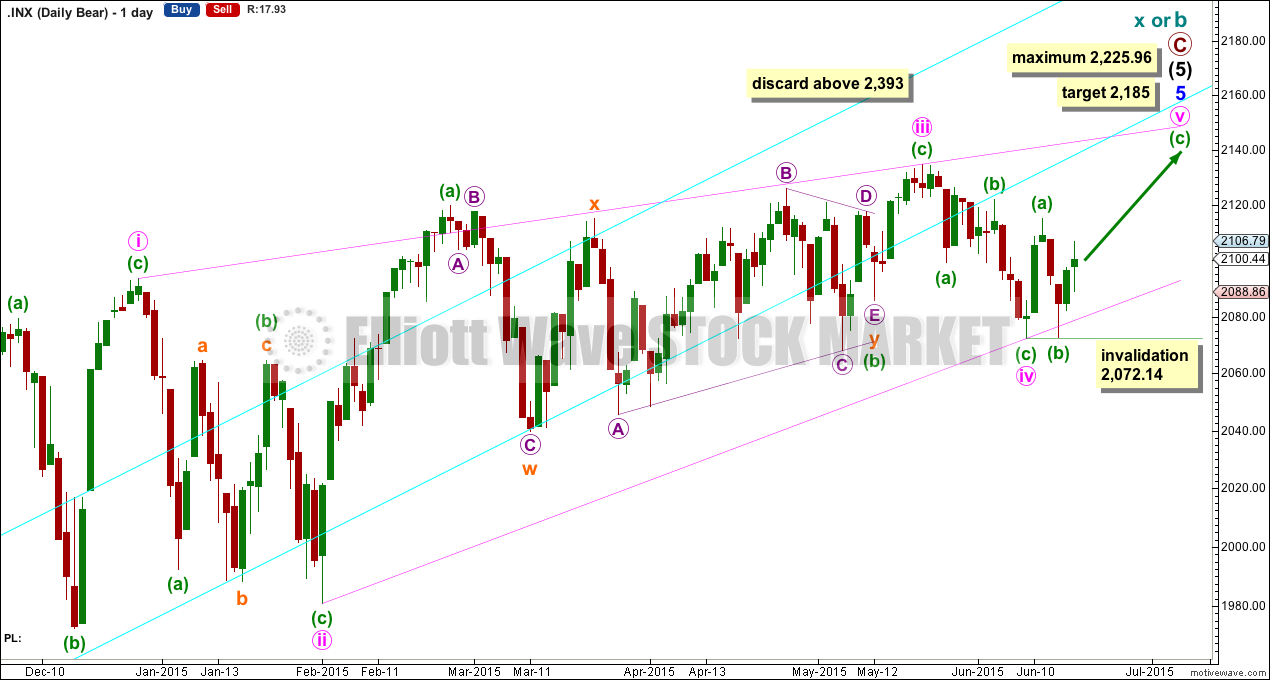
The ending contracting diagonal may still be incomplete.
The diagonal is contracting. Minute wave iii is shorter than minute wave i, and minute wave iv is shorter than minute wave ii. Minute wave iv overlaps into minute wave i price territory as it must for a diagonal.
At 2,185, minuettte wave (c) would reach 2.618 the length of minuette wave (a); this target allows for a reasonable overshoot of the upper i-iii diagonal trend line.
The diagonal trend lines would cross over on 3rd November. The diagonal must end a reasonable amount of time before that date, because diagonals end before their trend lines cross. If the upwards movement ends on 8th July, then minute wave v would last a total Fibonacci 21 days.
Minuette wave (b) may not move beyond the start of minuette wave (a) below 2,072.14.
Minute wave v may not be longer than equality with minute wave iii at 2,225.95, and the third wave may not be the shortest.
Overall this wave count has a good look. It sees minute wave iii as complete at the more recent high, and within it minuette wave b is a combination: zigzag – X – triangle.
The trend line still has not been breached by a close of 3% or more of market value since its inception in November 2011, but it is no longer exactly where price is finding support, and the strength of that line appears to be waning.
I have a preference for this bull wave count because we should always assume the trend remains the same until proven otherwise. While there is no confirmation of a bear market I will assume the S&P remains in a bull market.
If upwards movement continues past the limit of minute wave v at 2,255.95, then I will again publish the very bullish alternate.
Click chart to enlarge.
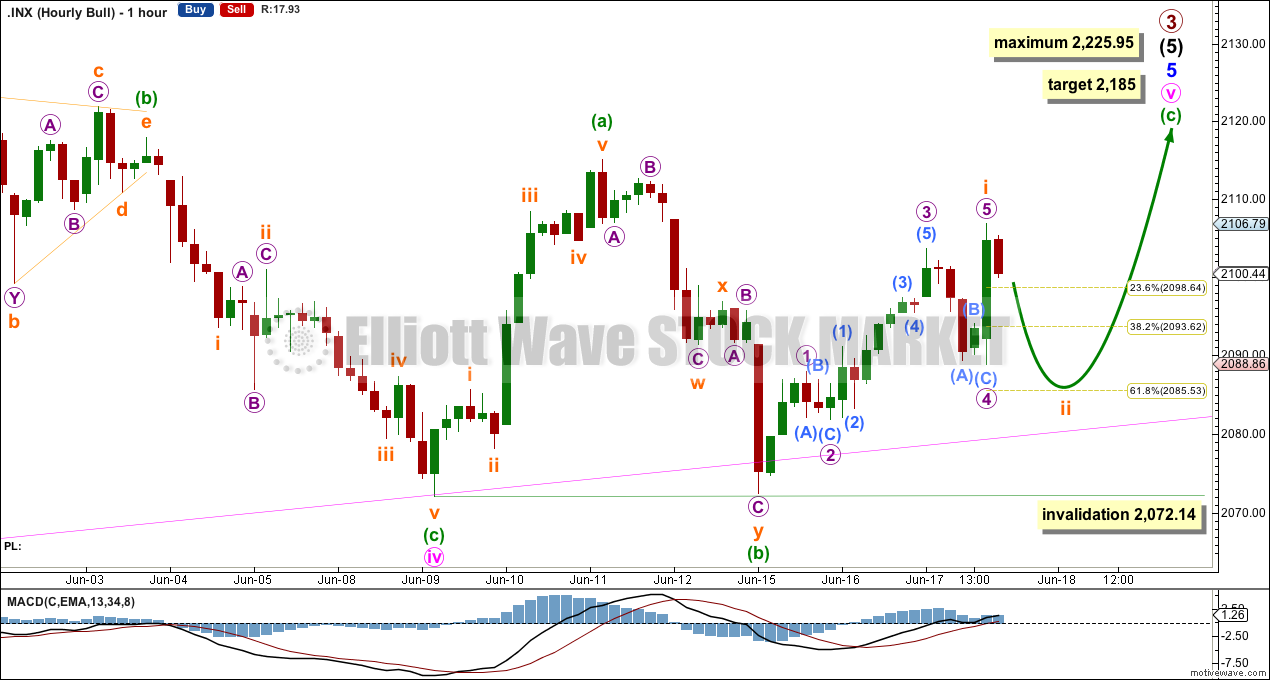
The hourly chart shows all of minute wave v so far.
Within minute wave v, minuette wave (a) is most likely to be complete and subdivides perfectly as an impulse.
Minuette wave (b) may be a complete double zigzag, or this may be only subminuette wave a of a regular contracting triangle for minuette wave (b). Minuette wave (b) may continue sideways in an ever decreasing range, taking up time, to complete a triangle. If that happens, then the target for minuette wave (c) would be recalculated when the triangle ends.
If minuette wave (b) is over as a double zigzag, then at 2,185 minuette wave (c) would reach 2.618 the length of minuette wave (a).
Minuette wave (c) must subdivide as a five wave structure. Within minuette wave (c), with subminuette wave i now a complete five wave impulse, a second wave correction may move price lower tomorrow
Subminuette wave ii may end about the 0.618 Fibonacci ratio of subminuette wave i at 2,086.
Thereafter, subminuette wave iii must move price above the end of subminuette wave i at 2,106.79. If that happens next, then a triangle continuing sideways for minuette wave (b) would be eliminated.
If minuette wave (b) does continue, then it may not move beyond the start of minuette wave (a) below 2,072.14.
Alternate Bull Wave Count
Click chart to enlarge.
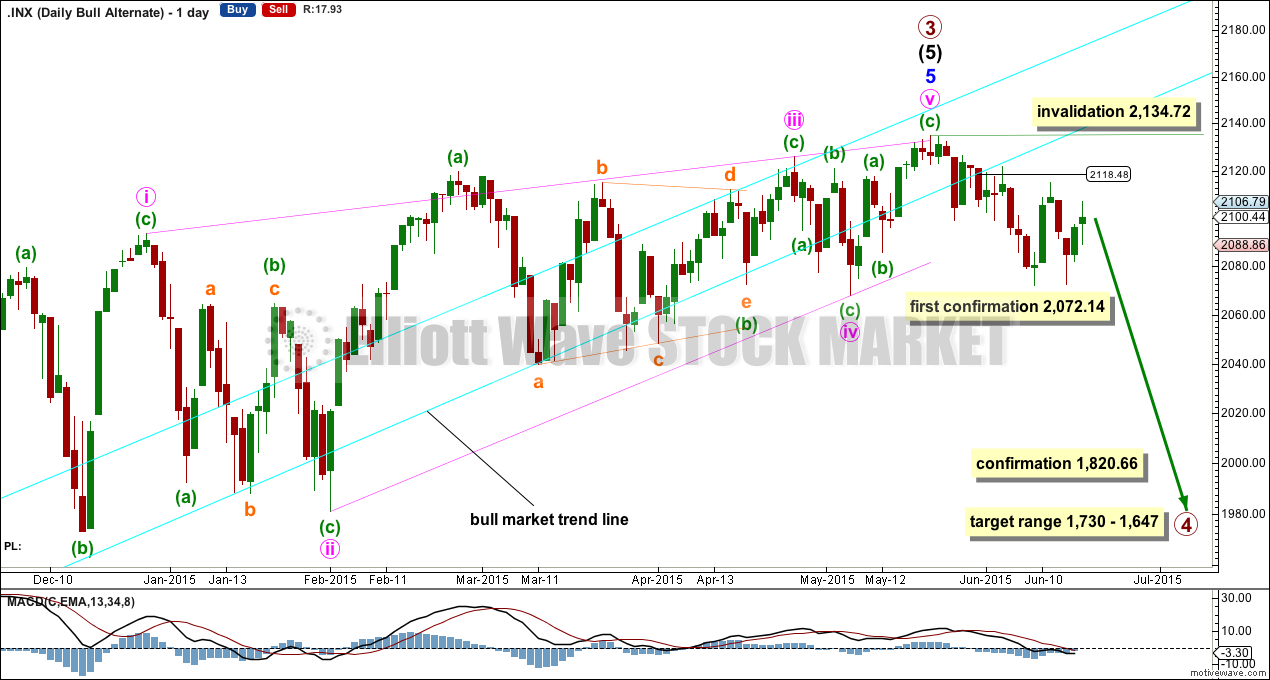
It is possible that the S&P has seen a primary degree (or for the bear count below a cycle degree) trend change nineteen days ago.
This wave count absolutely requires confirmation at the daily chart level before any confidence may be had in a primary (or cycle) degree trend change. Confirmation would come with:
1. A new low below 2,072.14.
2. A clear five down on the hourly chart.
3. A close of 3% or more of market value below the lower aqua blue trend line. If the line is now breached at 2,118, then a close at 2,055 or below is required to confirm a bear market.
4. A clear five down on the daily chart.
5. A new low below 1,820.66.
As each condition is met the probability of a substantial trend change would increase.
Primary wave 4 would most likely be a time consuming flat, triangle or combination in order to exhibit structural alternation with the zigzag of primary wave 2. Primary wave 2 lasted 12 weeks. Primary wave 4 is likely to be longer in duration because combinations and triangles particularly are more time consuming than zigzags which tend to be quick corrections. Primary wave 4 may be expected to last more than 12 weeks, and may end with a total Fibonacci 13 or more likely 21 weeks.
For this more bearish wave count to be taken seriously it requires at least a clear five down on the hourly chart.
At this stage, a trend change is looking somewhat likely so I’ll list points in its favour. However, these points indicate a trend change to come and not exactly when it will happen and so they support both the main and this alternate bull wave count:
1. ADX is rising and above 20, and the -DX line is above the +DX line indicating a new downwards trend.
2. The long held bull market trend line, the strongest piece of technical analysis on ALL charts, has again been recently breached. But the breach was small and did not close 3% or more of market value below the line, so a bear market is not indicated.
3. There is quadruple negative divergence between price and MACD on the weekly chart.
4. There is double negative divergence between price and MACD on the daily chart.
5. There is persistent and strong negative divergence between price and RSI on the monthly chart. The last time this happened was October 2007 and we all know what happened after that…
6. A long held bull trend line on On Balance Volume going back to October 2014 has been breached and is no longer providing support.
7. Using Dow Theory, DJT and Nasdaq are still failing to confirm a continuation of the bull market. This does not indicate a bear market and just indicates caution.
Click chart to enlarge.
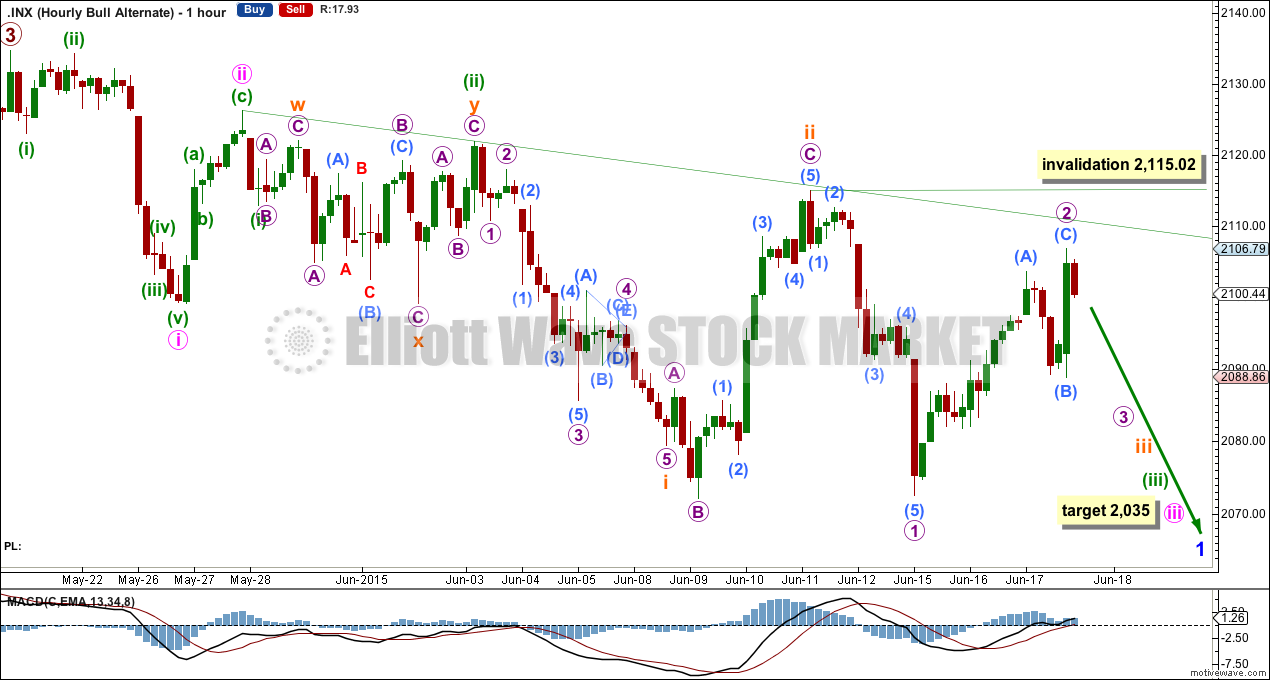
There is now a series of four overlapping first and second waves, indicating very strong downwards movement to come this week. But the fact that it continues to not turn up and a very low degree second wave correction is showing up on the daily chart is a great cause for concern for this more bearish wave count.
Micro wave 2 is incomplete, and it is neither brief nor shallow as it should be expected to be.
Micro wave 2 may not move beyond the start of micro wave 1 above 2,115.02.
At 2,035 minute wave iii would reach 2.618 the length of minute wave i.
There is still not a clear five down on the hourly chart, the absolute minimum requirement for any confidence in a trend change of this magnitude.
Bear Wave Count
Click chart to enlarge.
The subdivisions within primary waves A-B-C are seen in absolutely exactly the same way as primary waves 1-2-3 for the alternate bull wave count.
To see the difference at the monthly chart level between the bull and bear ideas look at the last historical analysis here.
At cycle degree, wave b is over the maximum common length of 138% the length of cycle wave a, at 170% the length of cycle wave a. At 2,393 cycle wave b would be twice the length of cycle wave a and at that point this bear wave count should be discarded.
Technical Analysis
Click chart to enlarge.
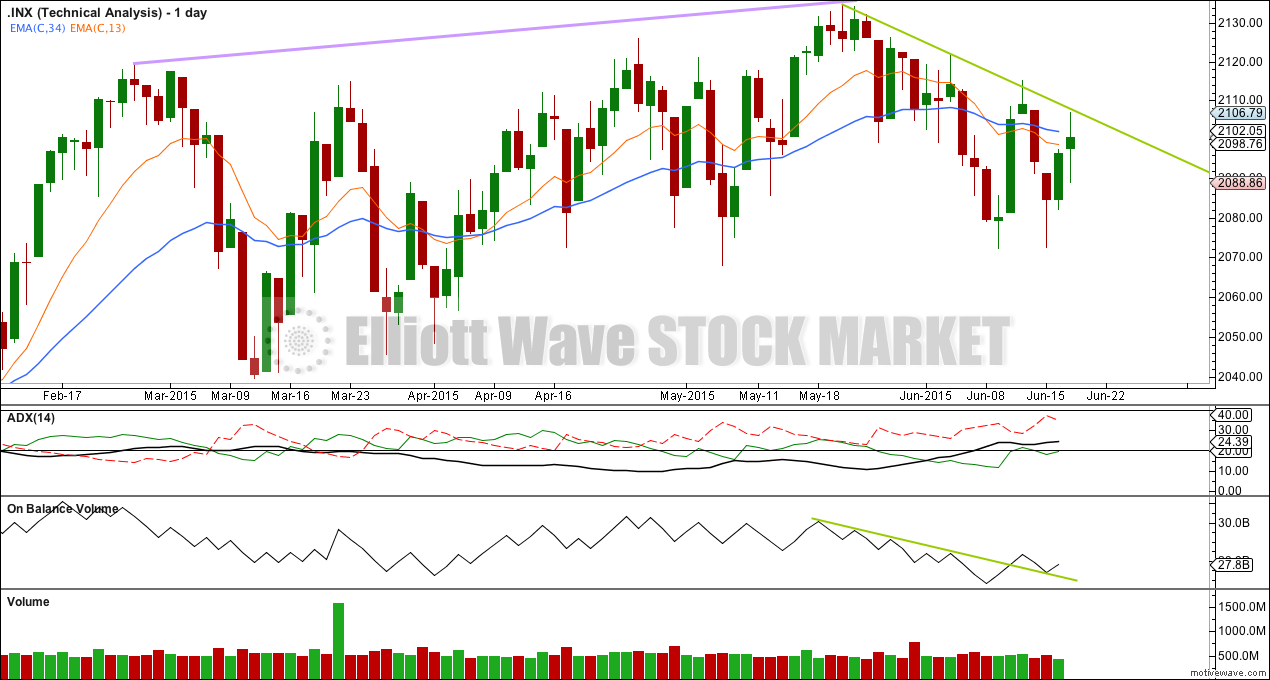
ADX still indicates the start of a downwards trend: the ADX line is rising and above 20, and the -DX line (red dashed) is above the +DX line (green solid) indicating the trend is down.
Upwards movement is again finding resistance at the downwards sloping green trend line. While price remains below that line and ADX indicates the trend is down, the alternate wave count should continue to be considered. The regular TA picture agrees with that wave count.
However, On Balance Volume disagrees: the breach of the green trend line on OBV indicates a potential change back to the upside. OBV expects price to rise with the green trend line now providing support.
On balance, it would be my judgement that it should be assumed that the trend is the same, up, until proven otherwise. In the short term, some sideways movement may resolve the disagreement between ADX and OBV. If that happens, then a rise to new all time highs may look more likely.
This analysis is published about 07:11 p.m. EST.
🙂
Looks like a Harmonic Butterfly pattern to me.. if so it takes out 2072 and will give everyone the signal they are waiting for..
Lara, today’s action feels like a third of a third of wave a. May have to modify labeling slightly.
Yes. I will, and yes, it does.
Looks like series of 1/2 waves with extended third wave.