
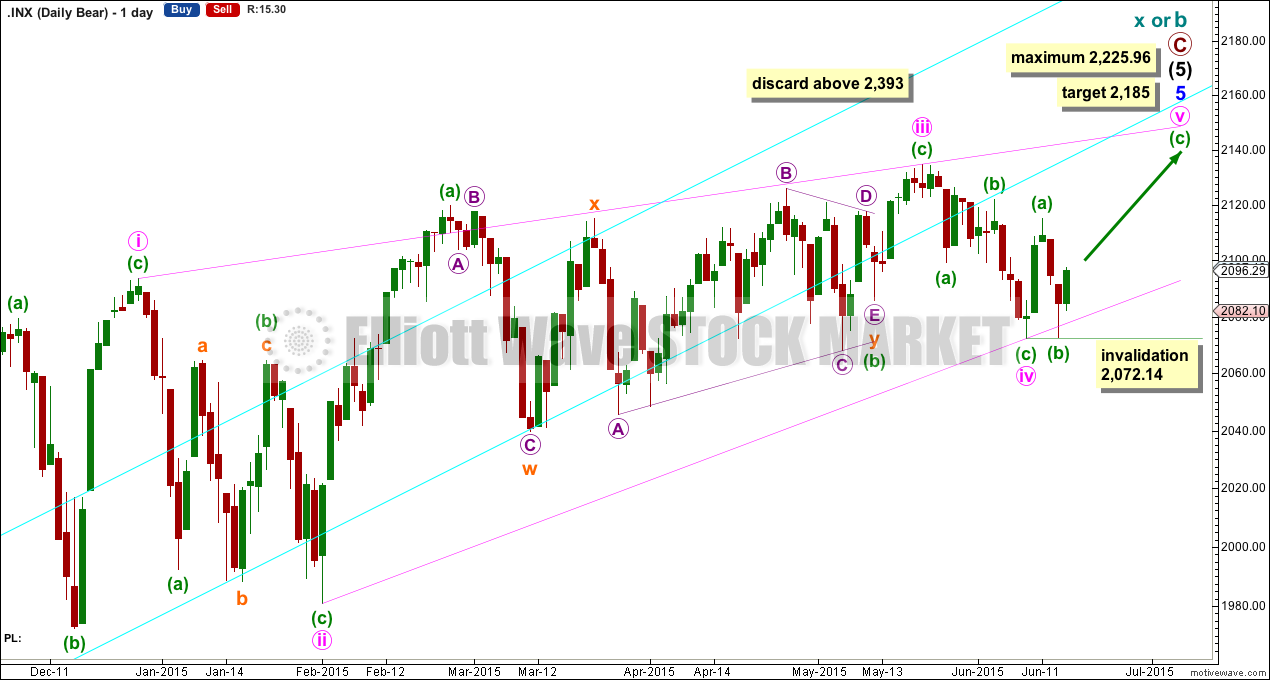
Upwards movement favours the bull Elliott wave count.
Summary: There is zero confirmation of a trend change from bull to bear. The main wave count will therefore expect to see a continuation of the upwards trend; the target remains the same at 2,185, but the expectation of when it may be reached is extended out now to another 16 trading days which would see upwards movement end on 8th July. A new low below 2,072.14 would invalidate this idea; at that stage, it would be possible that upwards movement may be over.
To see a weekly chart and how to draw trend lines go here.
Changes to last analysis are italicised.
Bull Wave Count
Click chart to enlarge.
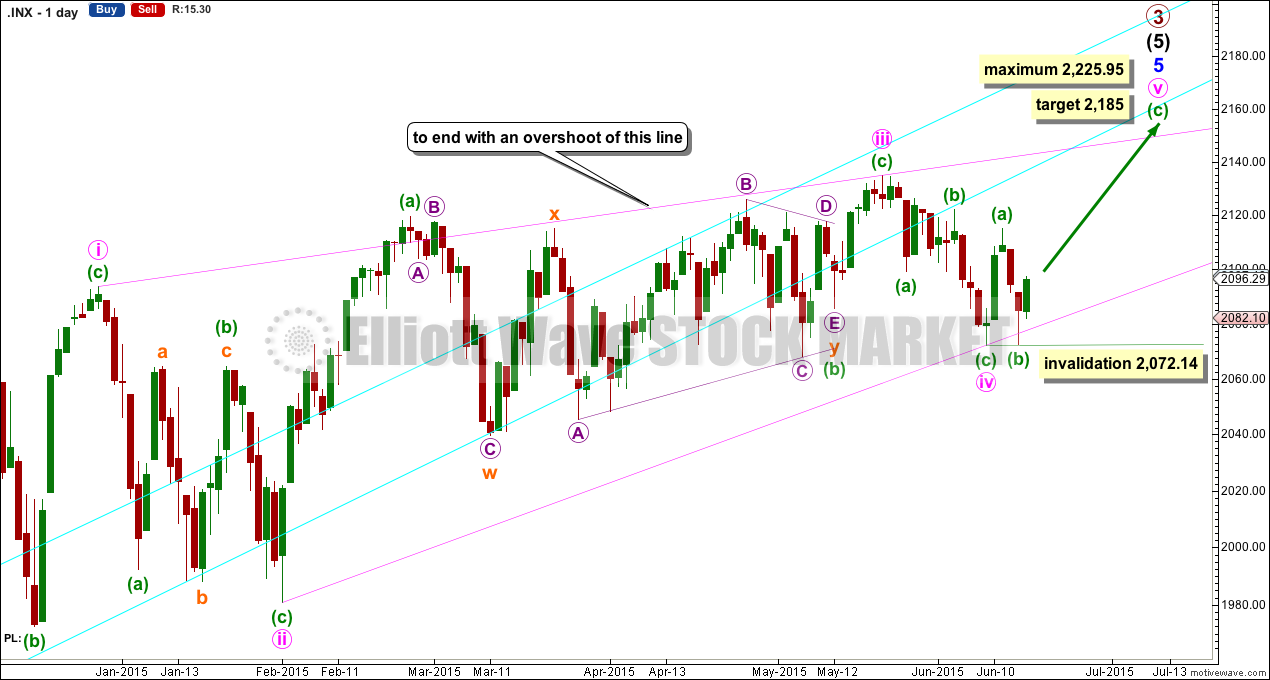
The ending contracting diagonal may still be incomplete.
The diagonal is contracting. Minute wave iii is shorter than minute wave i, and minute wave iv is shorter than minute wave ii. Minute wave iv overlaps into minute wave i price territory as it must for a diagonal.
At 2,185, minuettte wave (c) would reach 2.618 the length of minuette wave (a); this target allows for a reasonable overshoot of the upper i-iii diagonal trend line.
The diagonal trend lines would cross over on 3rd November. The diagonal must end a reasonable amount of time before that date, because diagonals end before their trend lines cross. If the upwards movement ends on 8th July, then minute wave v would last a total Fibonacci 21 days.
Minuette wave (b) may not move beyond the start of minuette wave (a) below 2,072.14.
Minute wave v may not be longer than equality with minute wave iii at 2,225.95, and the third wave may not be the shortest.
Overall this wave count has a good look. It sees minute wave iii as complete at the more recent high, and within it minuette wave b is a combination: zigzag – X – triangle.
The trend line still has not been breached by a close of 3% or more of market value since its inception in November 2011, but it is no longer exactly where price is finding support, and the strength of that line appears to be waning.
I have a preference for this bull wave count because we should always assume the trend remains the same until proven otherwise. While there is no confirmation of a bear market I will assume the S&P remains in a bull market.
If upwards movement continues past the limit of minute wave v at 2,255.95, then I will again publish the very bullish alternate.
Click chart to enlarge.
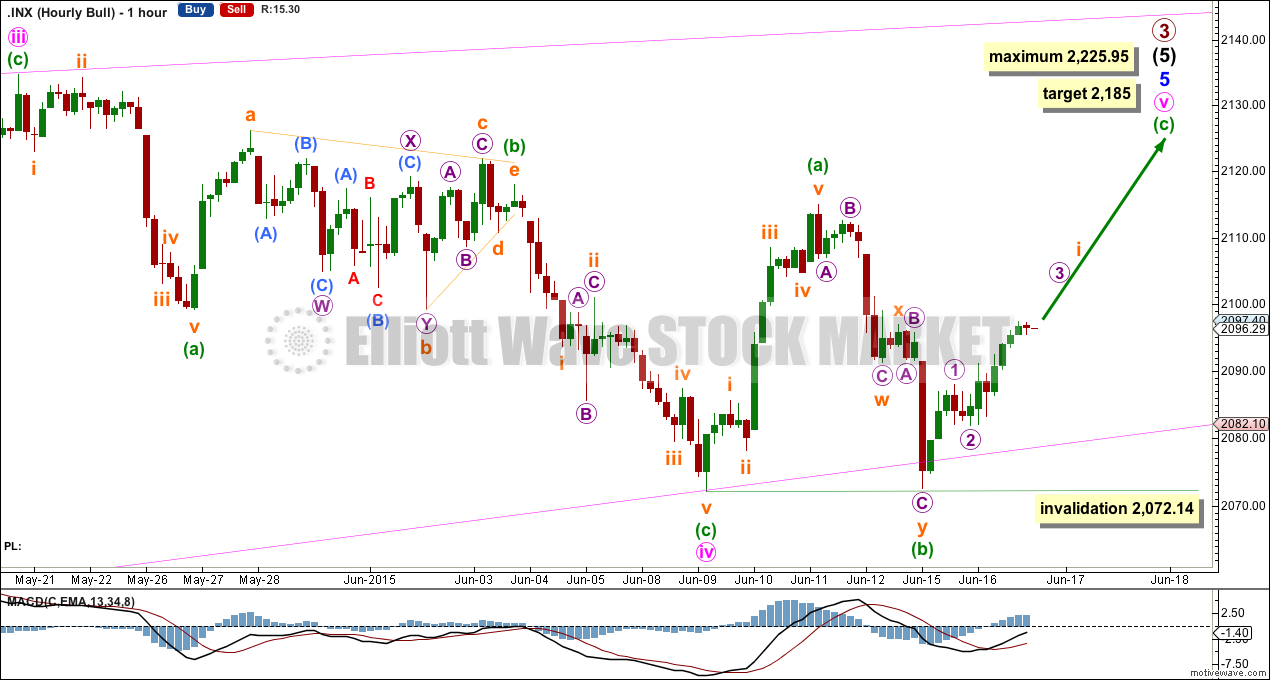
The hourly chart shows all of minute wave iv and the start of minute wave v.
If the target is wrong, then it may be too high and may see too strong an overshoot of the upper diagonal trend line. When there is more structure within minuette wave (c) to analyse, I will add to the target calculation at a second wave degree so at that stage it may change.
Minute wave v must subdivide as a zigzag. So far minuette wave (a) may be complete, but it is also possible to move the degree of labelling within minute wave v down one degree with subminuette wave i within minuette wave (a) as incomplete. However, that makes no difference to the expected direction for this wave count.
If minuette wave (b) is continuing sideways as a double combination or triangle, then it may not move beyond the start of minuette wave (a) below 2,072.14.
Alternate Bull Wave Count
Click chart to enlarge.
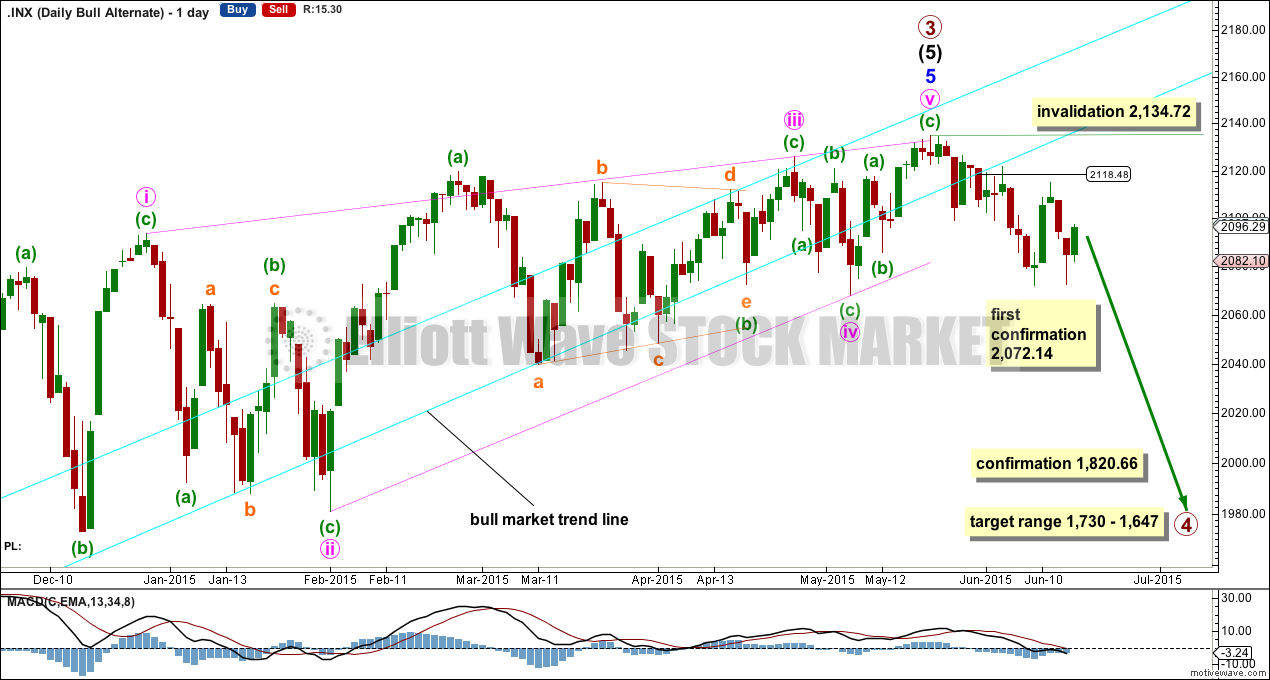
It is possible that the S&P has seen a primary degree (or for the bear count below a cycle degree) trend change eighteen days ago.
This wave count absolutely requires confirmation at the daily chart level before any confidence may be had in a primary (or cycle) degree trend change. Confirmation would come with:
1. A new low below 2,072.14.
2. A clear five down on the hourly chart.
3. A close of 3% or more of market value below the lower aqua blue trend line. If the line is now breached at 2,118, then a close at 2,055 or below is required to confirm a bear market.
4. A clear five down on the daily chart.
5. A new low below 1,820.66.
As each condition is met the probability of a substantial trend change would increase.
Primary wave 4 would most likely be a time consuming flat, triangle or combination in order to exhibit structural alternation with the zigzag of primary wave 2. Primary wave 2 lasted 12 weeks. Primary wave 4 is likely to be longer in duration because combinations and triangles particularly are more time consuming than zigzags which tend to be quick corrections. Primary wave 4 may be expected to last more than 12 weeks, and may end with a total Fibonacci 13 or more likely 21 weeks.
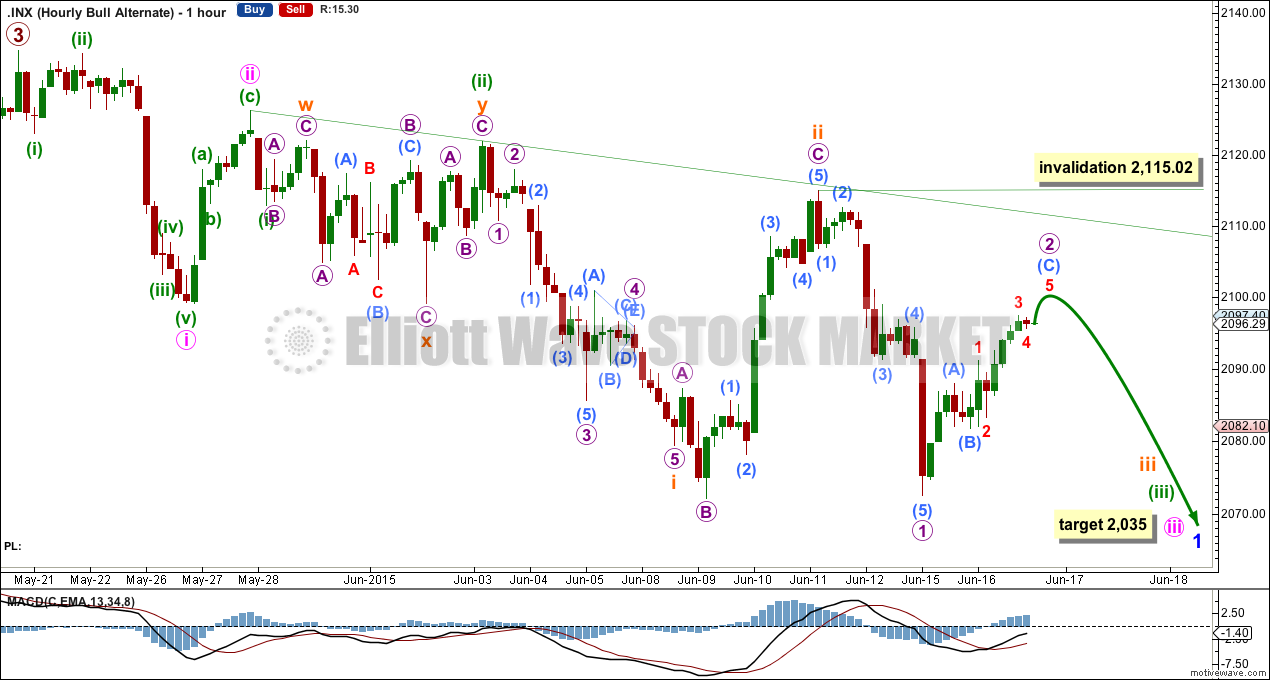
For this more bearish wave count to be taken seriously it requires at least a clear five down on the hourly chart.
At this stage, a trend change is looking somewhat likely so I’ll list points in its favour:
1. ADX is rising and above 20, and the -DX line is above the +DX line indicating a new downwards trend.
2. The long held bull market trend line, the strongest piece of technical analysis on ALL charts, has again been recently breached. But the breach was small and did not close 3% or more of market value below the line, so a bear market is not indicated.
3. There is quadruple negative divergence between price and MACD on the weekly chart.
4. There is double negative divergence between price and MACD on the daily chart.
5. There is persistent and strong negative divergence between price and RSI on the monthly chart. The last time this happened was October 2007 and we all know what happened after that…
6. A long held bull trend line on On Balance Volume going back to October 2014 has been breached and is no longer providing support.
7. Using Dow Theory, DJT and Nasdaq are still failing to confirm a continuation of the bull market. This does not indicate a bear market and just indicates caution.
Click chart to enlarge.
There is now a series of four overlapping first and second waves, indicating very strong downwards movement to come this week. But the fact that it did not turn up today and a very low degree second wave correction is showing up on the daily chart is a great cause for concern for this more bearish wave count today.
Micro wave 2 is incomplete, and it is neither brief nor shallow as it should be expected to be.
Micro wave 2 may not move beyond the start of micro wave 1 above 2,115.02.
At 2,035 minute wave iii would reach 2.618 the length of minute wave i.
There is still not a clear five down on the hourly chart, the absolute minimum requirement for any confidence in a trend change of this magnitude.
Bear Wave Count
Click chart to enlarge.
The subdivisions within primary waves A-B-C are seen in absolutely exactly the same way as primary waves 1-2-3 for the alternate bull wave count.
To see the difference at the monthly chart level between the bull and bear ideas look at the last historical analysis here.
At cycle degree, wave b is over the maximum common length of 138% the length of cycle wave a, at 170% the length of cycle wave a. At 2,393 cycle wave b would be twice the length of cycle wave a and at that point this bear wave count should be discarded.
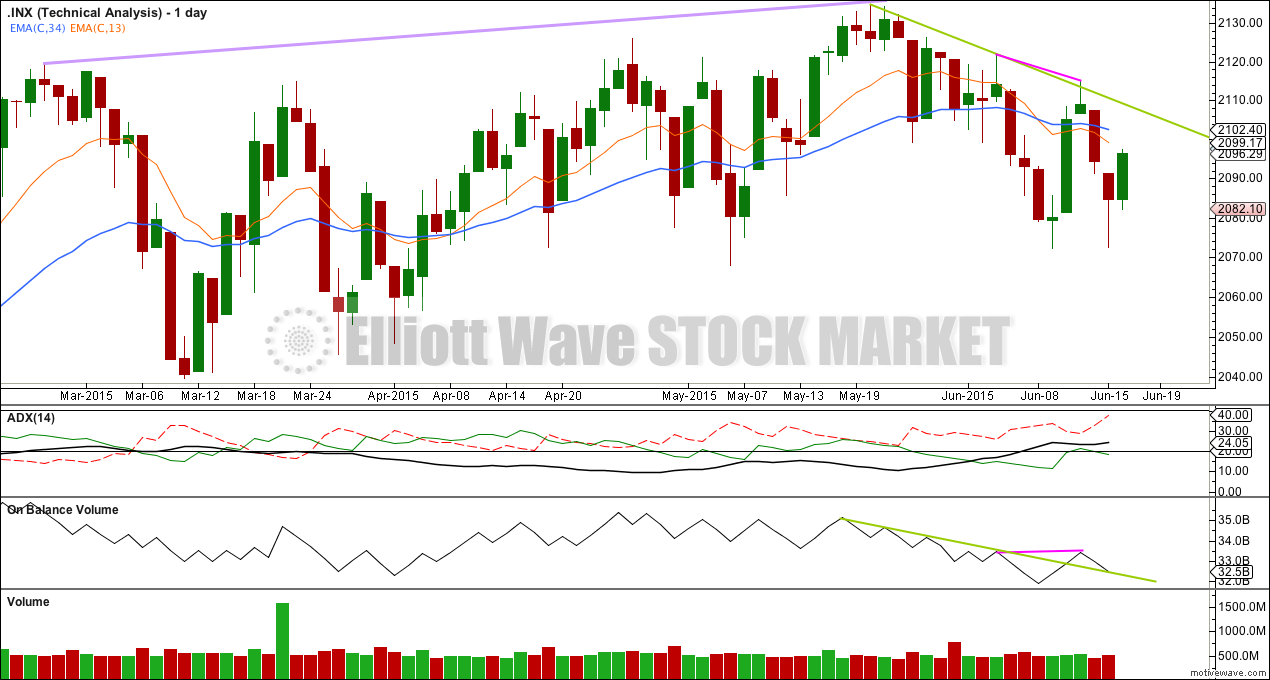
Technical Analysis
Click chart to enlarge.
ADX turned back up slightly yesterday. It is above 20 and so a trend is indicated. The -DX line is above the +DX line so a downwards trend is indicated.
While price remains below the downwards sloping green trend line and ADX indicates there is a downwards trend beginning, I would not have confidence in expecting an upwards swing from here.
From the last two highs price moved lower while On Balance Volume moved slightly higher providing some positive divergence (pink lines).
OBV also declined while price has declined from the last all time high. OBV has now breached that green trend line indicating a possible trend change to the upside (green lines).
OBV does not agree with ADX. With the Elliott wave count providing zero confirmation that more downwards movement should unfold, on balance it is my judgement that some more upwards movement from here looks most likely.
This analysis is published about 05:38 p.m. EST.
Spinning tops Wednesday in DOW and SPY but VIX says we are going higher. Maybe triple witching Friday will give us a break-out…or a break-down. Either one would sure be welcome. This has to be an all-time record for range-bound trading!
Hello Lara, I’ve been reviewing your content for several months, impressed with your insight with clear and concise and well explained information. Started my membership last week. I normally trade PM and Pairs, don’t normally trade the S&P but have been learning, took this trade this morning and thus far its working out. With a confirmed break above the downward trend line, then I will let this one go and see if we get to the 2185 level. I have placed 1st and 2nd target points where we may come across some resistance, i’ll keep an eye on those levels. But here’s looking bullish to the upside. Look forward to your next video take on this trade. Thanks, Stephen