
Downwards movement was expected by both the new Elliott wave count (presented in yesterday’s update) and the alternate.
Summary: The new main wave count has a target at 2,161 which may be met in another five or ten days. The alternate requires a new low at least below 2,072.14 before it can be taken seriously. If that happens it may be that primary wave 3 has ended, or for the bear wave count the market may be in the earliest stages of a crash.
To see a weekly chart and how to draw trend lines go here.
Changes to last analysis are italicised.
Bull Wave Count
Click chart to enlarge.
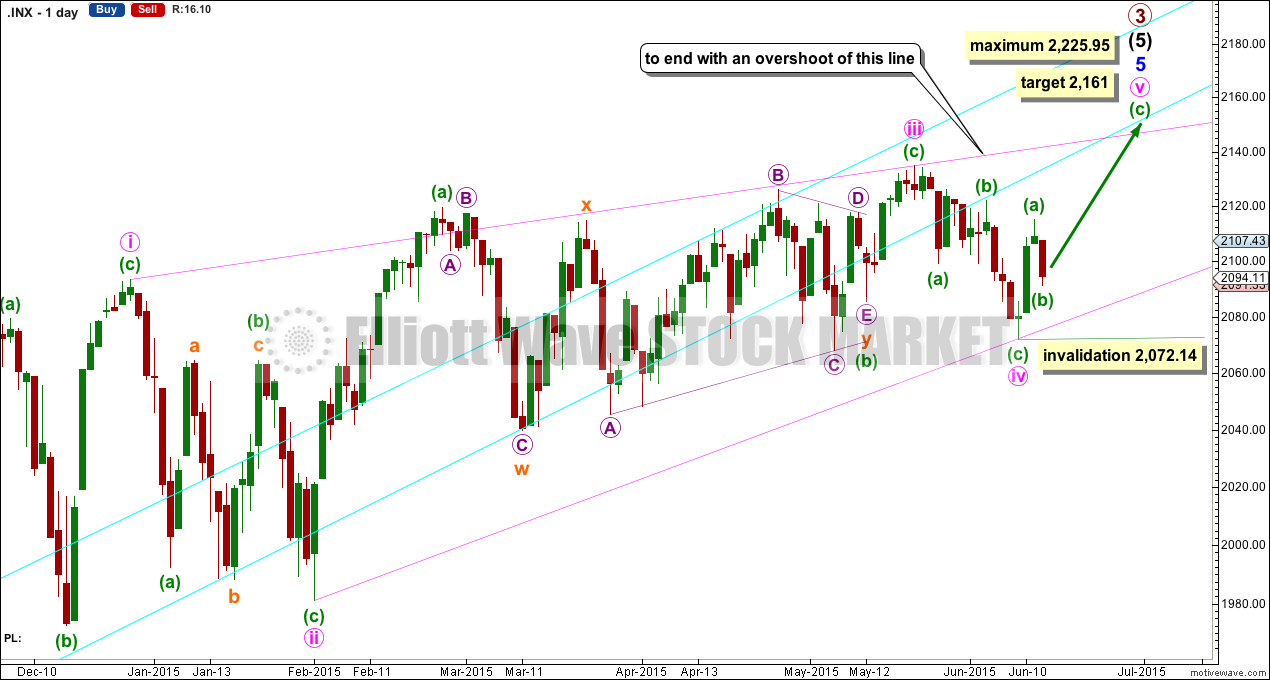
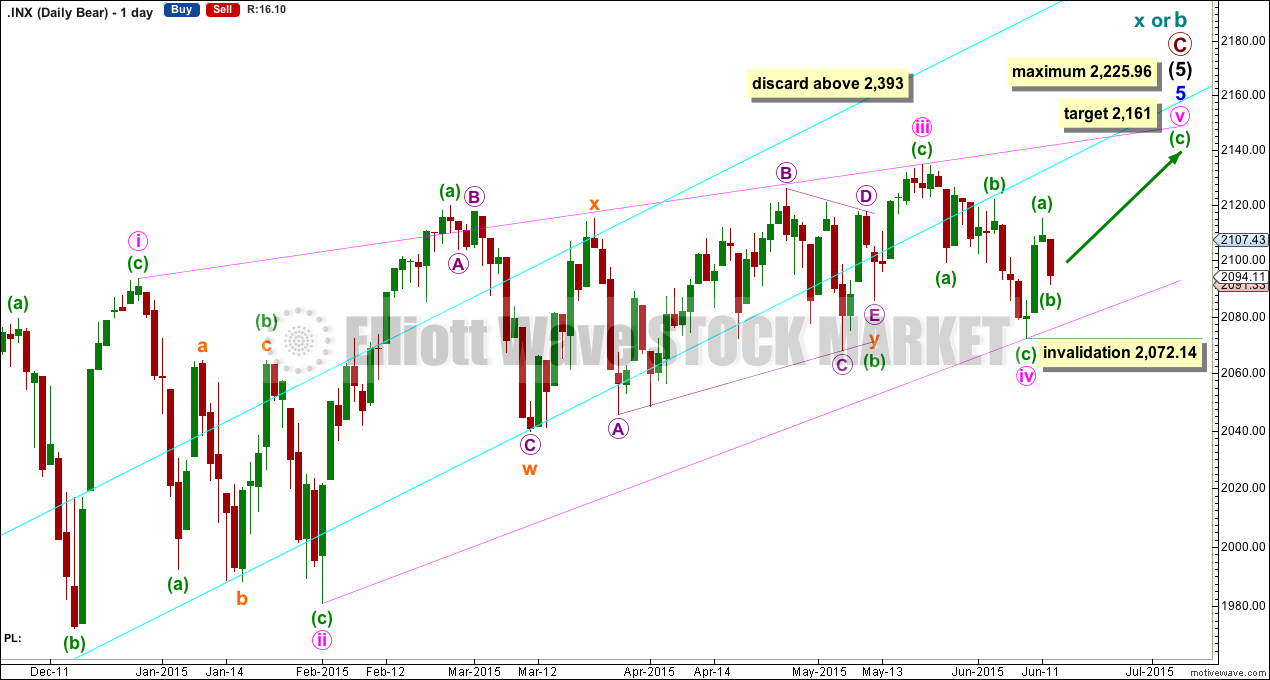
The ending contracting diagonal may be incomplete.
The diagonal is still contracting. Minute wave iii is shorter than minute wave i, and minute wave iv is shorter than minute wave ii. Minute wave iv overlaps into minute wave i price territory as it must for a diagonal.
Within the final zigzag, minuette wave (b) may now be complete. At 2,161 minuette wave (c) would reach 1.618 the length of minuette wave (a) and minute wave v would overshoot the i-iii trend line of the contracting diagonal, a common place for a fifth wave of a contracting diagonal to end. If minuette wave (b) moves lower, the target must also move correspondingly lower. Any further downwards movement should find strong support at the lower diagonal trend line while the diagonal is incomplete.
Minute wave v may not be longer than equality with minute wave iii at 2,225.95, and the third wave may not be the shortest.
Overall this wave count has a good look. It sees minute wave iii as complete at the more recent high, and within it minuette wave b is a combination: zigzag – X – triangle.
The lower aqua blue line is higher up. This illustrates the problem I had with Motive Wave and this trend line. When drawn from EXACTLY the same price points (which requires I contract the charts) on two different daily charts, the trend line crosses the candlesticks differently when I expand the charts back out. I concluded that I needed to remove all study boxes below (showing indicators like volume and MACD) for the trend line to sit correctly on both charts. The trend line on this chart is how it sits and now I can replicate that over multiple charts. I will leave the trend line as shown here. I will show how to draw and fit this trend line carefully in today’s end of week video.
The trend line still has not been breached by a close of 3% or more of market value since its inception in November 2011. But it is no longer exactly where price is finding resistance.
I will again have a preference for this bull wave count because we should always assume the trend remains the same until proven otherwise. While there is no confirmation of a bear market I will assume the S&P remains in a bull market.
If upwards movement continues past the limit of minute wave v at 2,255.95, then I will again publish the very bullish alternate.
Click chart to enlarge.
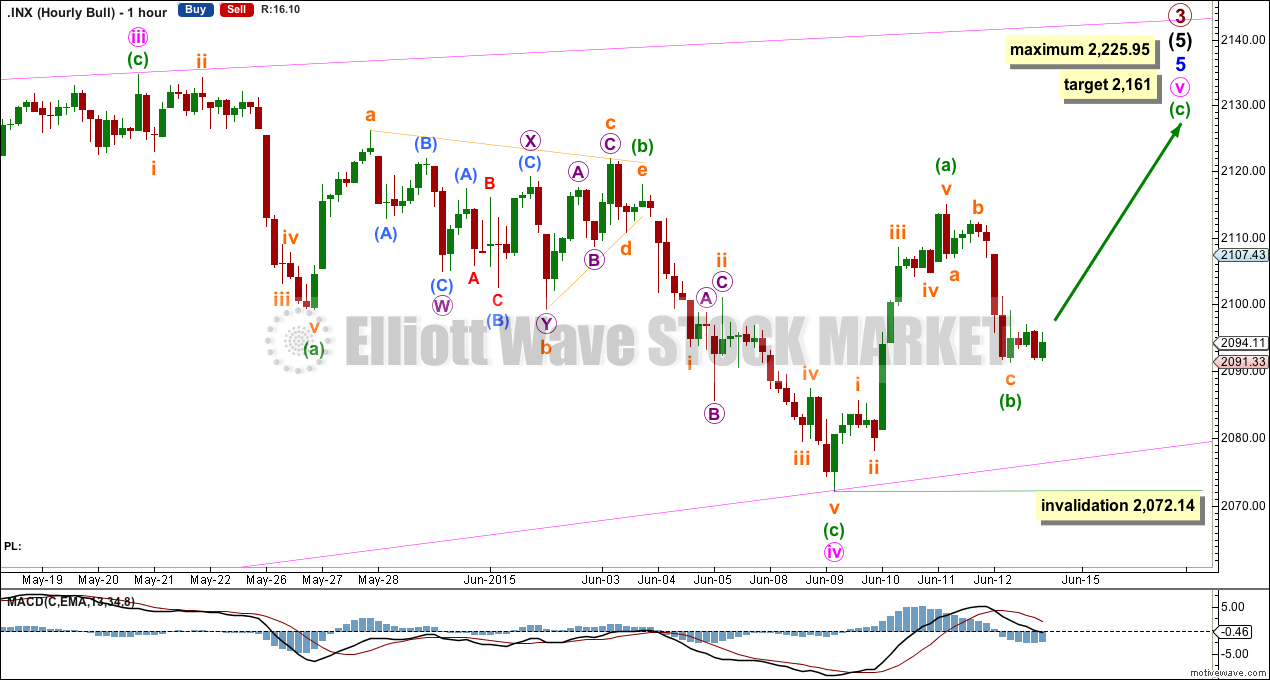
The hourly chart shows all of minute wave iv and the start of minute wave v.
Minute wave v has so far lasted three days. If it ends in another five, it may total a Fibonacci eight. This would be reasonably likely. Or it may take another ten days to total a Fibonacci thirteen, which seems less likely.
So far within minute wave v, minuette wave (a) subdivides as a five and minuette wave (b) as a three. It is possible that minuette wave (b) may not be over though. If it continues, it may not move beyond the start of minuette wave (a) below 2,072.14, but it should find strong support and not break below the lower diagonal trend line first.
Alternate Bull Wave Count
Click chart to enlarge.
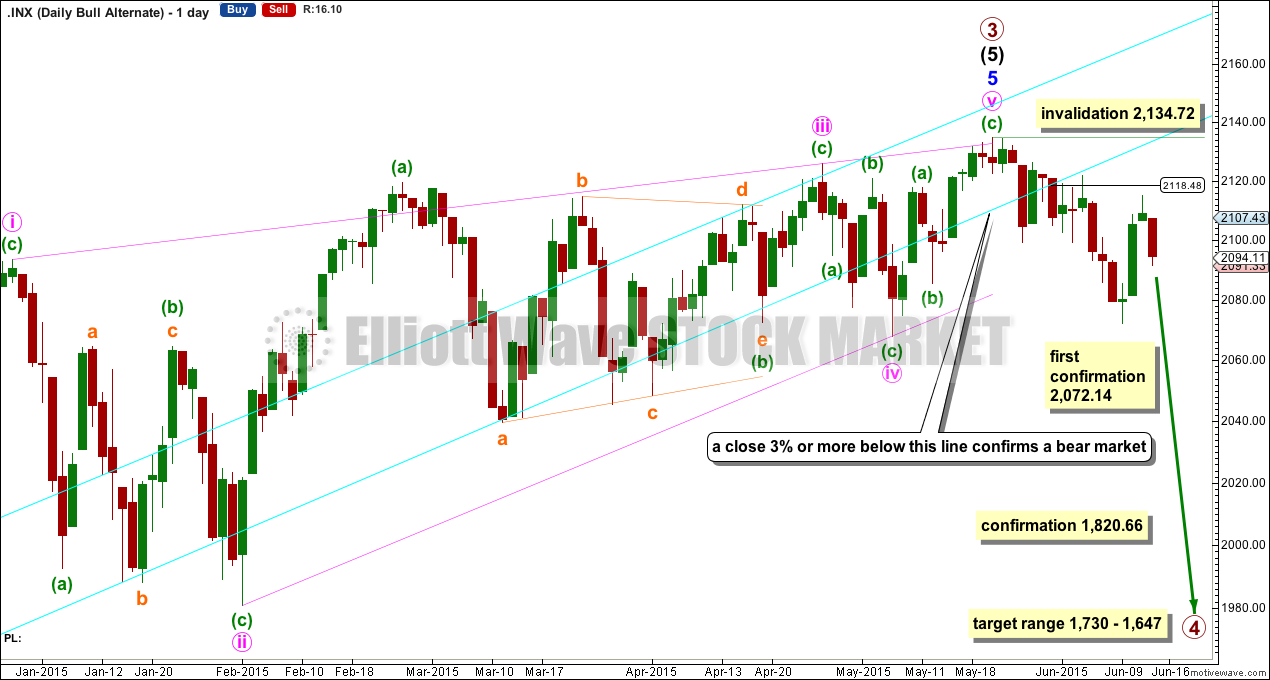
It is possible that the S&P has seen a primary degree (or for the bear count below a cycle degree) trend change sixteen days ago.
This wave count absolutely requires confirmation at the daily chart level before any confidence may be had in a primary (or cycle) degree trend change. Confirmation would come with:
1. A new low below 2,072.14.
2. A clear five down on the hourly chart.
3. A close of 3% or more of market value below the lower aqua blue trend line. If the line is now breached at 2,118, then a close at 2,055 or below is required to confirm a bear market.
4. A clear five down on the daily chart.
5. A new low below 1,820.66.
As each condition is met the probability of a substantial trend change would increase.
Primary wave 4 would most likely be a time consuming flat, triangle or combination in order to exhibit structural alternation with the zigzag of primary wave 2. Primary wave 2 lasted 12 weeks. Primary wave 4 is likely to be longer in duration because combinations and triangles particularly are more time consuming than zigzags which tend to be quick corrections. Primary wave 4 may be expected to last more than 12 weeks, and may end with a total Fibonacci 13 or more likely 21 weeks.
For this more bearish wave count to be taken seriously it requires at least a clear five down on the hourly chart.
At this stage, a trend change is looking somewhat likely so I’ll list points in its favour:
1. ADX is rising and above 20, and the -DX line is above the +DX line indicating a new downwards trend.
2. The long held bull market trend line, the strongest piece of technical analysis on ALL charts, has again been recently breached. But the breach was small and did not close 3% or more of market value below the line, so a bear market is not indicated.
3. There is quadruple negative divergence between price and MACD on the weekly chart.
4. There is double negative divergence between price and MACD on the daily chart.
5. There is persistent and strong negative divergence between price and RSI on the monthly chart. The last time this happened was October 2007 and we all know what happened after that…
6. A long held bull trend line on On Balance Volume going back to October 2014 has been breached and is no longer providing support.
7. Using Dow Theory, DJT and Nasdaq are still failing to confirm a continuation of the bull market. This does not indicate a bear market and just indicates caution.
Click chart to enlarge.
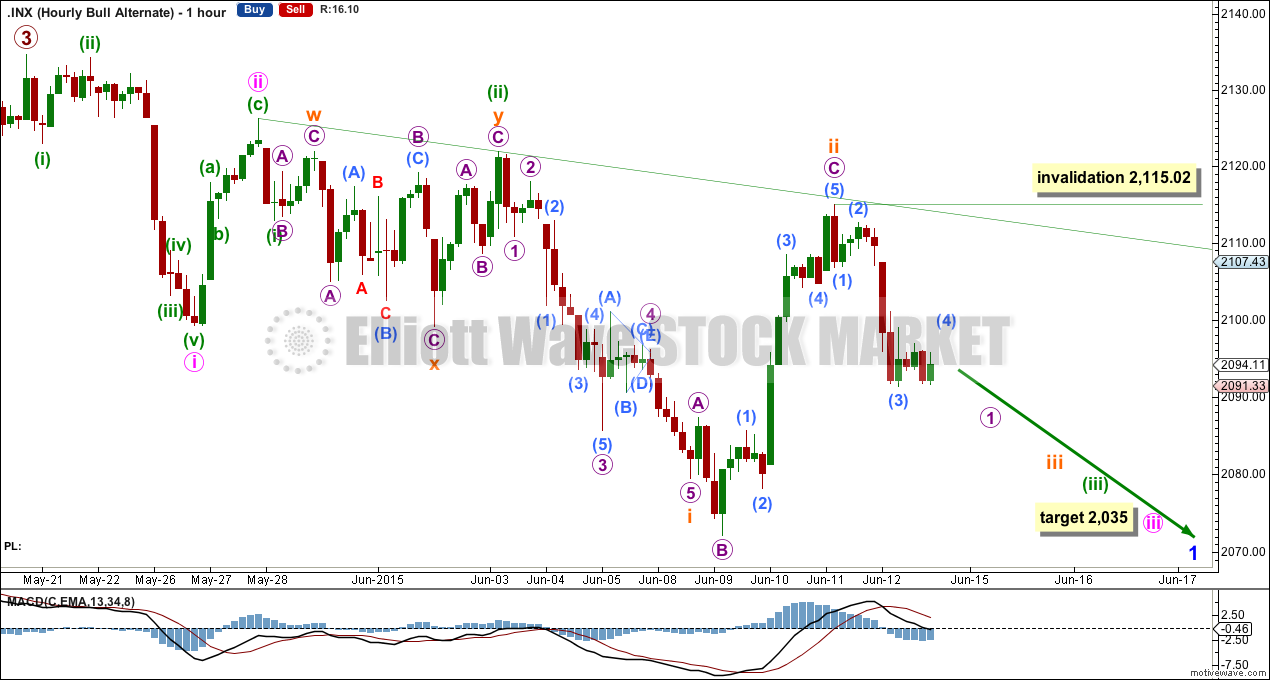
There is a series of three overlapping first and second waves. This alternate wave count requires the middle of a third wave to turn down next week.
At 2,035 minute wave iii would reach 2.618 the length of minute wave i.
Within the middle of the third wave, further upwards corrections should find resistance at the downwards sloping green trend line. If that line is breached, this wave count will reduce in probability in favour of the main wave count.
Micro wave 2 to come may not move beyond the start of micro wave 1 above 2,115.02.
A new low below 2,072.14 next week would increase the probability of this wave count.
Bear Wave Count
Click chart to enlarge.
The subdivisions within primary waves A-B-C are seen in absolutely exactly the same way as primary waves 1-2-3 for the alternate bull wave count.
To see the difference at the monthly chart level between the bull and bear ideas look at the last historical analysis here.
At cycle degree, wave b is over the maximum common length of 138% the length of cycle wave a, at 170% the length of cycle wave a. At 2,393 cycle wave b would be twice the length of cycle wave a and at that point this bear wave count should be discarded.
Technical Analysis
Click chart to enlarge.
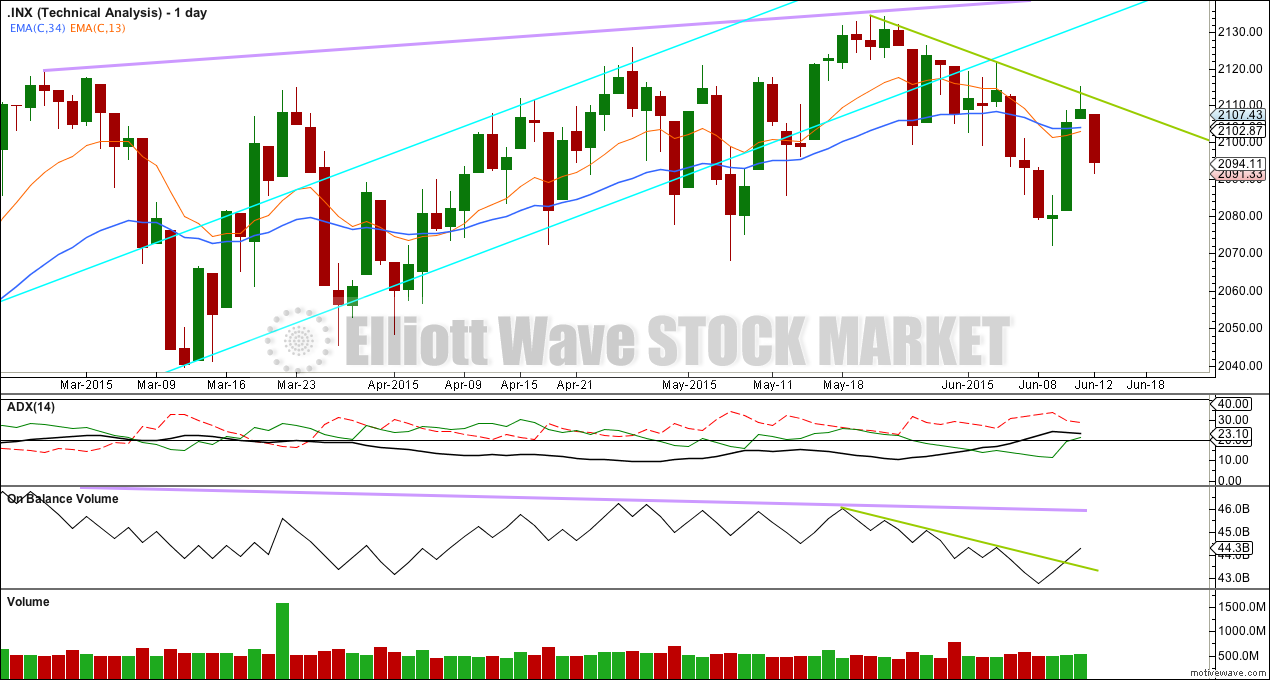
ADX is rising and still above 20. This indicates the potential start of a new trend. The direction would be down.
Only when this lower aqua blue trend line is breached by a close of 3% or more of market value would a bear market be indicated. The trend line has been breached about 2,118 so price must close at 2,055 or below for it to be used correctly to indicate a change from bull to bear.
That trend line is long held (it began in November 2011), repeatedly tested and reasonably shallow so it is highly technically significant and should be respected. It remains the strongest piece of technical analysis on all charts.
On Balance Volume has turned strongly downwards. This fall in price is supported by volume.
On Balance Volume is showing negative divergence with price back to February. The recent rise in price to new all time highs is not supported by volume and so is suspicious. This may indicate that when the bear market arrives it may be deeper and more long lasting than recent corrections.
The shorter EMA has crossed below the longer EMA providing some confidence in a bear market.
Upwards movement found resistance at the downwards sloping green line. While lower highs have been made, OBV is also moving lower; this drop in price is supported by volume.
This analysis is published about 09:25 p.m. EST.
Thx Lara, but I can’t help but wonder if 2072-2116 was just ‘i of a’. It’s possible the S&P could be targeting 2191. 2161 may not be high enough to produce a decent overthrow as well. Sentiment is not exactly bullish, so it may take 4-6 weeks of upwards movement to turn the tides before the bottom falls out. I would not be surprised to see a red doji if ‘ii of a’ continues on Mon.
You can ignore as another breach of ii-iv trend line on the new ED probably invalidates and alt is in play.
Possibly… but not yet. It’s an overshoot, that’s acceptable. Only a new low below 2,072.14 now can invalidate it.
And yes, it could be (a) or it could only be wave i within (a). I’ll leave the labelling as (a) for now.