
I have found a more acceptable bull Elliott wave count which sees the ending diagonal incomplete.
Bull Wave Count
Click chart to enlarge.
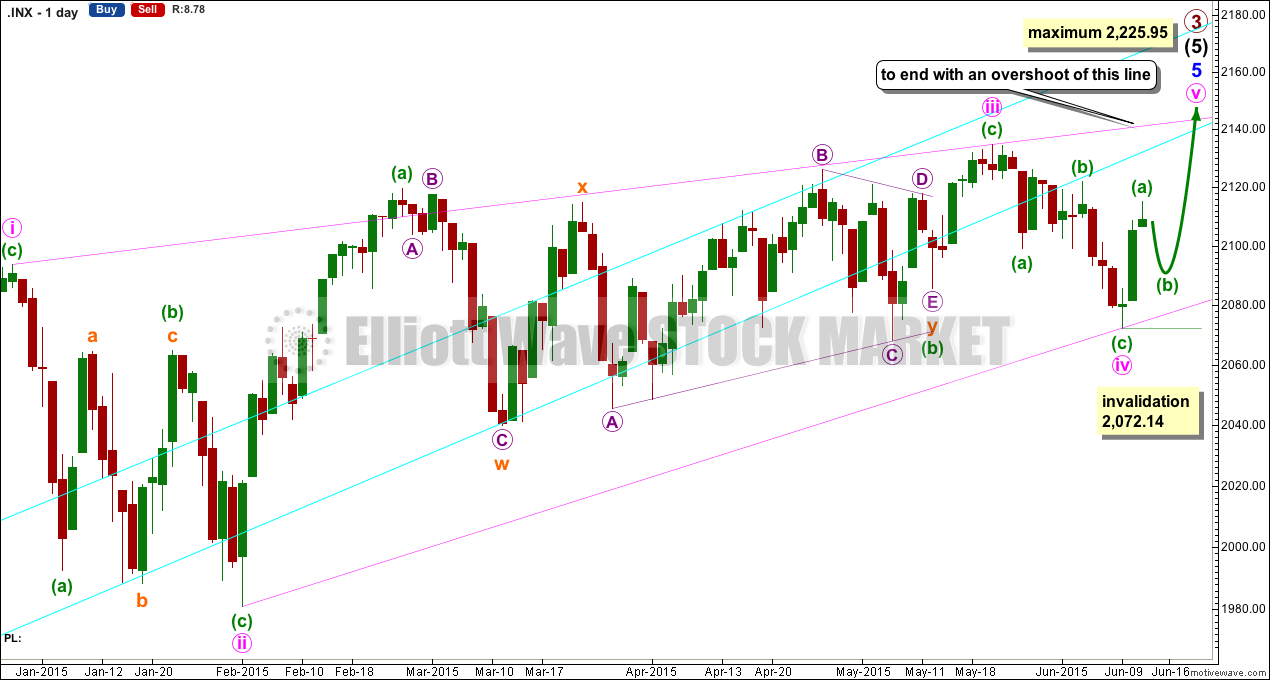
The ending contracting diagonal may be incomplete.
The diagonal is still contracting. Minute wave iii is shorter than minute wave i, and minute wave iv is shorter than minute wave ii. Minute wave iv overlaps into minute wave i price territory as it must for a diagonal.
This will be my main wave count from here. When minuette wave (b) within the final zigzag is complete, then a target may be calculated using the ratio between minuette waves (a) and (c).
Minute wave v may not be longer than equality with minute wave iii at 2,225.95, and the third wave may not be the shortest.
Overall this wave count has a good look. It sees minute wave iii as complete at the more recent high, and within it minuette wave b is a combination: zigzag – X – triangle.
The problem of the lower ii-iv trend line being breached is resolved.
The lower aqua blue line is higher up. This illustrates the problem I had with Motive Wave and this trend line. When drawn from EXACTLY the same price points (which requires I contract the charts) on two different daily charts, the trend line crosses the candlesticks differently when I expand the charts back out. I concluded that I needed to remove all study boxes below (showing indicators like volume and MACD) for the trend line to sit correctly on both charts. The trend line on this chart is how it sits and now I can replicate that over multiple charts. I will leave the trend line as shown here. I will show how to draw and fit this trend line carefully in tomorrow’s end of week video.
The trend line still has not been breached by a close of 3% or more of market value since its inception in November 2011. But it is no longer exactly where price is finding resistance.
This analysis update is published about 11:18 p.m. EST.
What a classic setup! Wave b down will probably end close to lows of the day to pre-maturely draw the bears in followed by a final face-ripping c wave up starting Monday. Looking forward to Lara’s upside target and keeping my powder dry. There will be no doubt when this willy diagonal concludes…great lesson in patiently waiting for correct signals, in this case the diagonal overshoot…
Oops! I posted before I realized this was an update. This new wave count makes an awful lot of sense and explains a lot. I think Lara got it EXACTLY right. Thanks Lara!
You’re welcome!
Again, it looks right. But this time I’m not relying on a triangle completing. Horrid structures within the S&P, they just don’t always behave nicely.
So now we have two versions of the diagonal…. and we can use specific price points to see which one is right.
And if price just keeps on going up if it moves above the limit for both diagonals then that very bullish wave count would be the only one left.
Volume on down days suggest sellers are still scared of this market’s bullish potential and so the market has been trading “heavy”, as if declining under its own torpidity
I was really surprised at the way the diagonal ended and something’s still seems to be missing from the big picture. I am staying on the sidelines until there is bit more clarity as to what is really going on…this I suspect will come with a break above 2130 or below 2060
This is a much better version of the bull count. The prices are very reasonable.
Yes indeed. And if the maximum limit for both is passed by upwards movement, then the very bullish wave count will be the only one left.
Until then, it is an alternate idea. To consider ALL possibilities.