
The upwards movement, which was unexpected, invalidated the hourly alternate Elliott wave count.
Summary: The main wave count is changed. It now expects a third wave up and requires confirmation with a new high above 2,134.72. The alternate expects a primary degree trend to remain down for a further 18 weeks, and requires confirmation with a close at 2,037.
To see a weekly chart and how to draw trend lines go here.
Changes to last analysis are italicised.
Bull Wave Count
Click chart to enlarge.
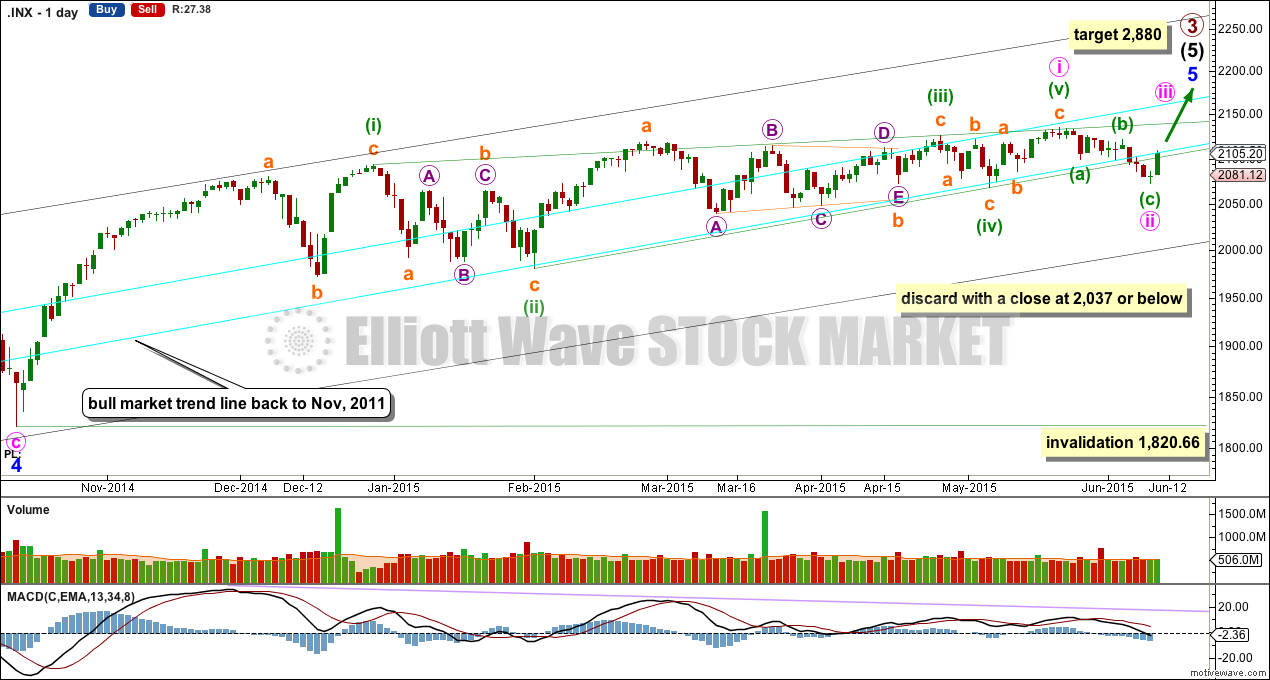
The bull wave count sees primary 1-2-3 within an impulse for a cycle degree wave V.
The bear wave count sees primary A-B-C zigzag for a cycle degree B wave.
I have presented this idea before and for the main count I will again revert to it. The diagonal structure is highly likely to be complete. While a market change from bull to bear is unconfirmed, it should be assumed that the trend remains the same at primary degree. I have moved the degree of labelling within the diagonal down one degree: minor wave 5 may still be incomplete and may have begun with a leading contracting diagonal.
Leading diagonals in first wave positions are most commonly followed by particularly deep second wave corrections. In this instance that should not happen though because the lower aqua blue bull market trend line should provide very strong support. Minute wave ii may have ended as a more shallow zigzag.
At 2,880 primary wave 3 would reach 2.618 the length of primary wave 1.
Minute wave ii may not move beyond the start of minute wave i below 1,820.66. However, this wave count should be discarded before that price point is passed. If the bull market trend line is breached by a close of 3% or more of market value at 2,037 or below, it would indicate a trend change from bull to bear. The alternate would become the main wave count.
Click chart to enlarge.
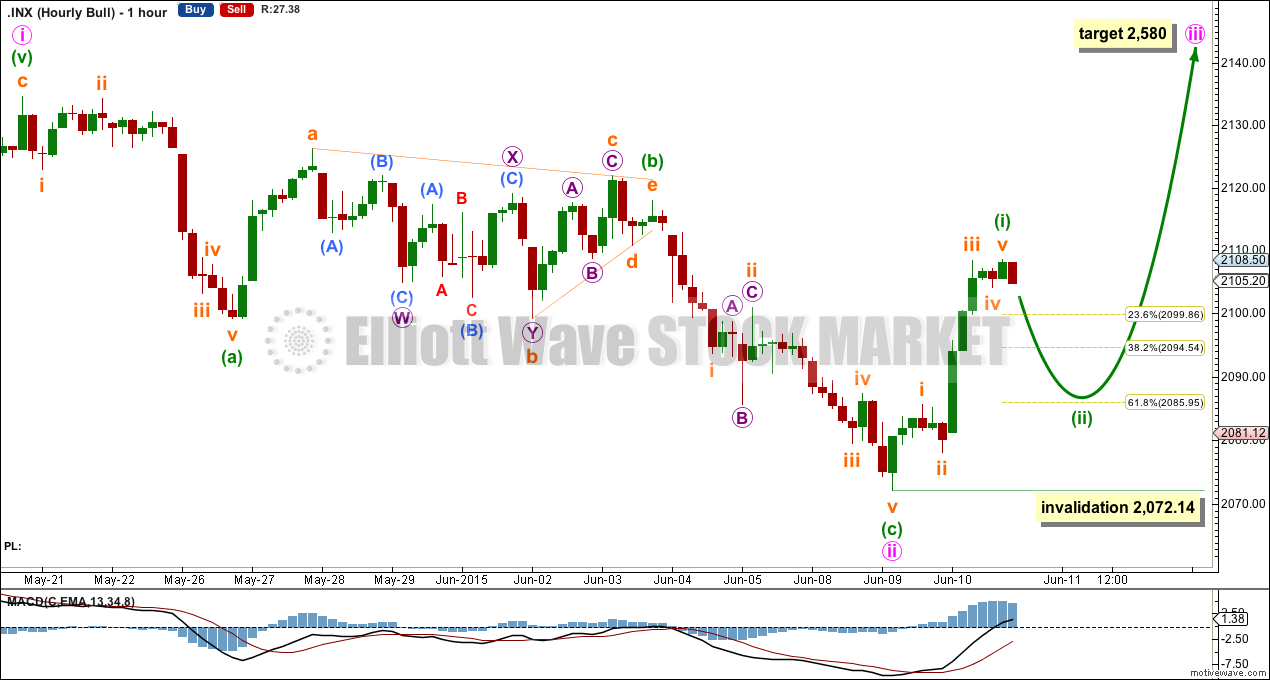
If recent downwards movement is a second wave correction, then it may now be over as a zigzag.
There is no Fibonacci ratio between minuette waves (a) and (c).
Minuette wave (b) subdivides as a running contracting triangle. All the subdivisions within it fit, but within the double zigzag of subminuette wave b the second zigzag of micro wave Y is not a clear three. It looks like a five. This is the only problem within this wave count at the hourly chart level.
If minute wave iii has begun, then at 2,580 it would reach 1.618 the length of minute wave i.
Within minute wave iii, the first five up for minuette wave (i) may be complete. Minuette wave (ii) may correct to either the 0.382 or more likely the 0.618 Fibonacci ratios. Minuette wave (ii) may not move beyond the start of minuette wave (i) below 2,072.14.
Alternate Bull Wave Count
Click chart to enlarge.
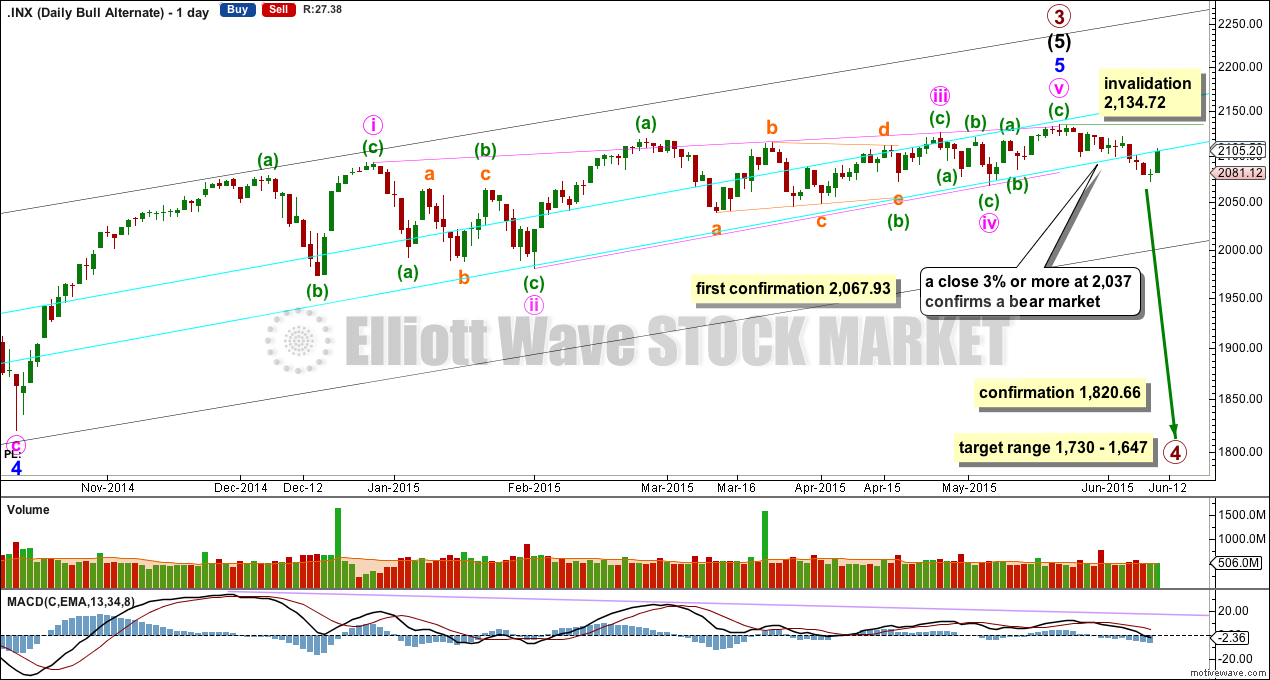
It is possible that the S&P has seen a primary degree (or for the bear count below a cycle degree) trend change fourteen days ago.
This wave count absolutely requires confirmation at the daily chart level before any confidence may be had in a primary (or cycle) degree trend change. Confirmation would come with:
1. A new low below 2,067.93.
2. A clear five down on the hourly chart.
3. A close of 3% or more of market value below the lower aqua blue trend line. If the line was breached at 2,100 then this rule needs a daily close at 2,037 or below.
4. A clear five down on the daily chart.
5. A new low below 1,820.66.
As each condition is met the probability of a substantial trend change would increase.
Primary wave 4 would most likely be a time consuming flat, triangle or combination in order to exhibit structural alternation with the zigzag of primary wave 2. Primary wave 2 lasted 12 weeks. Primary wave 4 is likely to be longer in duration because combinations and triangles particularly are more time consuming than zigzags which tend to be quick corrections. Primary wave 4 may be expected to last more than 12 weeks, and may end with a total Fibonacci 13 or more likely 21 weeks.
For this more bearish wave count to be taken seriously it still requires confirmation at least below 2,067.93.
At this stage, a trend change is looking more likely so I’ll list points in its favour:
1. ADX is rising and above 20, and the -DX line is above the +DX line indicating a new downwards trend.
2. The long held bull market trend line, the strongest piece of technical analysis on ALL charts, is again now breached. But the breach needs to be by a close of 3% or more of market value to be using that trend line correctly.
3. There is quadruple negative divergence between price and MACD on the weekly chart.
4. There is double negative divergence between price and MACD on the daily chart.
5. There is persistent and strong negative divergence between price and RSI on the monthly chart. The last time this happened was October 2007 and we all know what happened after that…
6. A long held bull trend line on On Balance Volume going back to October 2014 has been breached and is no longer providing support.
7. Using Dow Theory, DJT and Nasdaq recently failed to confirm a continuation of the bull market. This does not indicate a bear market and just indicates caution.
While a bear market is unconfirmed I uncomfortably sit on the fence.
Click chart to enlarge.
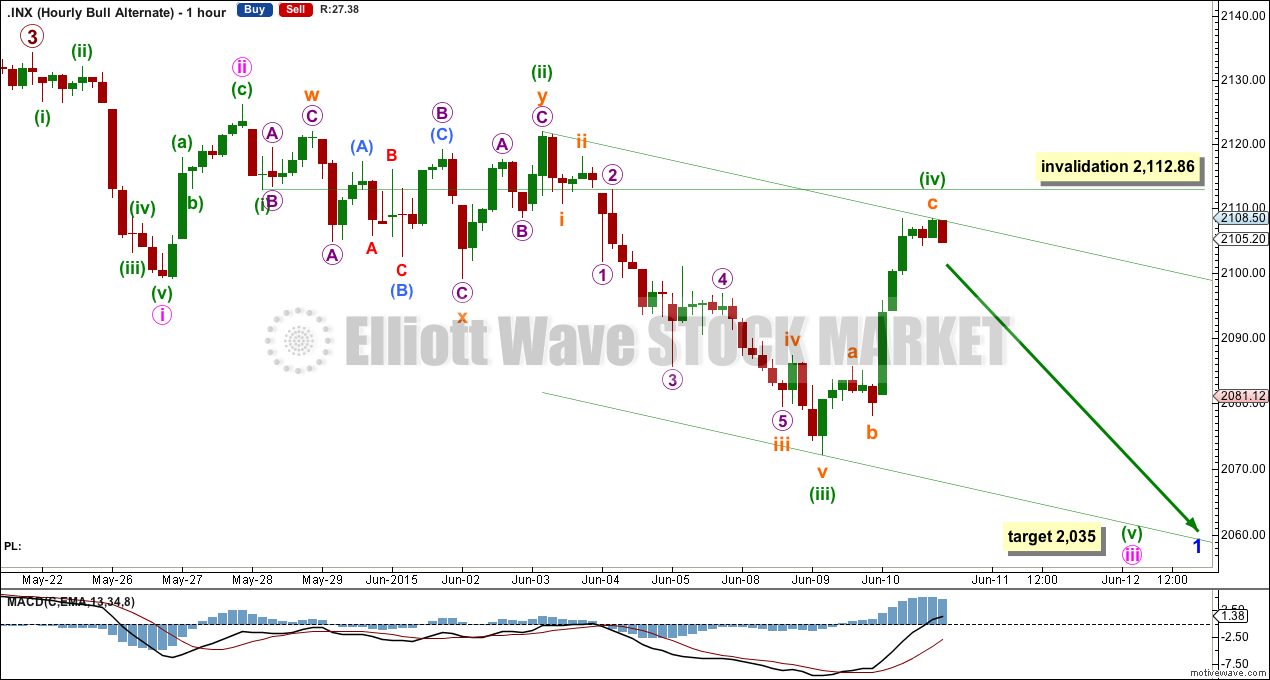
Yesterday’s labelling of this possible incomplete five down was wrong.
There is still not a clear five down a the hourly chart level; a clear five down, at least, is absolutely required before any confidence may be had in a trend change of this magnitude.
Within the first five down of minor wave 1, minute wave iii is incomplete. At 2,035 it would reach 2.618 the length of minute wave i.
Within minute wave iii, the labelling has been changed today. Minuette wave (ii) is seen as a longer lasting double combination: flat – X – zigzag, which has an overall sideways move to it that is typical for a combination. The only problem here is that subminuette wave x is much bigger in duration than subminuette waves w or y.
Minuette wave (ii) is still longer in duration than a second wave one degree higher. It lasted 28 hours compared to minute wave ii which lasted only 8 hours. Sometimes the S&P 500 just does not have perfect proportion between its waves.
There is some alternation between minuette waves (ii) and (iv): minuette wave (ii) was a deep 0.68 combination and minuette wave (iv) may now be complete as a slightly more deep 0.76 zigzag. There is alternation in structure, but not enough alternation in depth. Minuette wave (iv) lasts only 11 hours compared to minuette wave (ii) at 28 hours, but zigzags do tend to be much quicker corrections than combinations so this disproportion is acceptable.
Minuette wave (iv) may not move into minuette wave (i) price territory above 2,112.86. If this price point is invalidated within the next few days, this alternate wave count and the potential for a change to a bear market in the near term will substantially reduce in probability.
Draw a channel about minute wave iii using Elliott’s second technique as shown. Minuette wave (v) may find support at the lower edge.
Bear Wave Count
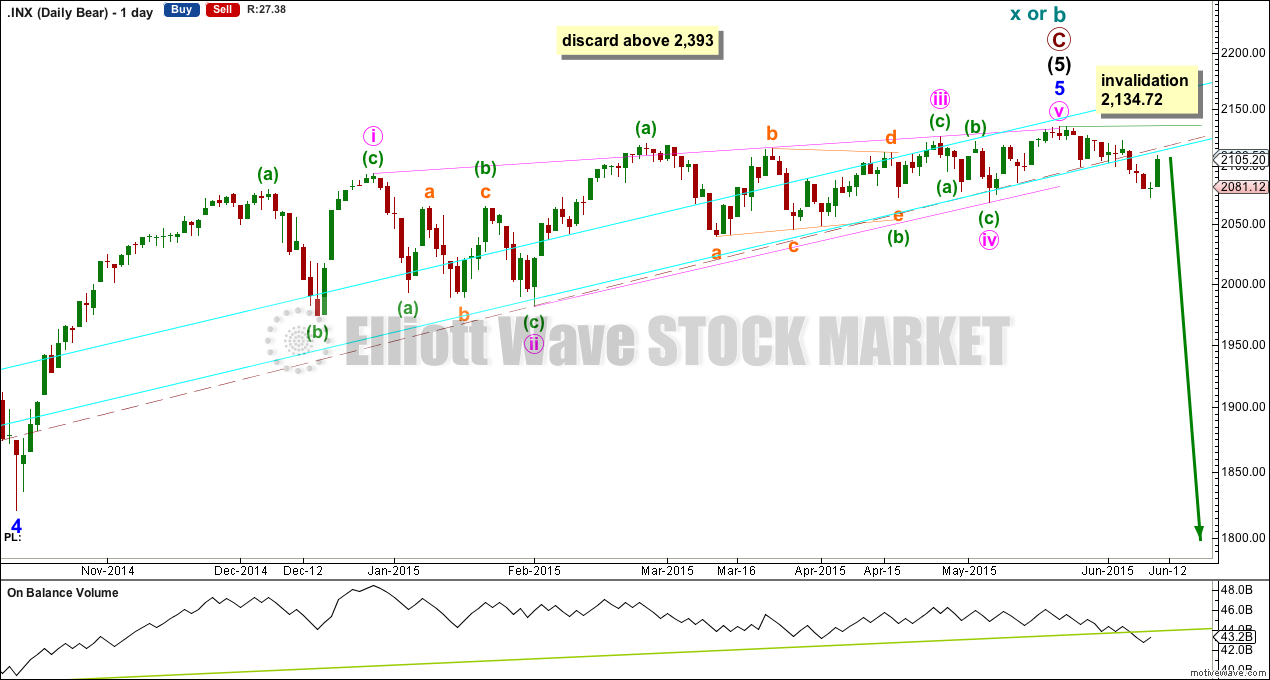
Click chart to enlarge.
The subdivisions within primary waves A-B-C are seen in absolutely exactly the same way as primary waves 1-2-3 for the alternate bull wave count.
To see the difference at the monthly chart level between the bull and bear ideas look at the last historical analysis here.
At cycle degree, wave b is over the maximum common length of 138% the length of cycle wave a, at 170% the length of cycle wave a. At 2,393 cycle wave b would be twice the length of cycle wave a and at that point this bear wave count should be discarded.
While we have no confirmation of this wave count, we should assume the trend remains the same, upwards. This wave count requires confirmation before I have confidence in it. Full and final confirmation that the market is crashing would only come with a new low below 1,370.58. However, structure and momentum should tell us long before that point which wave count is correct, bull or bear.
On Balance Volume has very now clearly breached a trend line which began back in October 2014. This may be an early warning of more downwards movement to come.
Technical Analysis
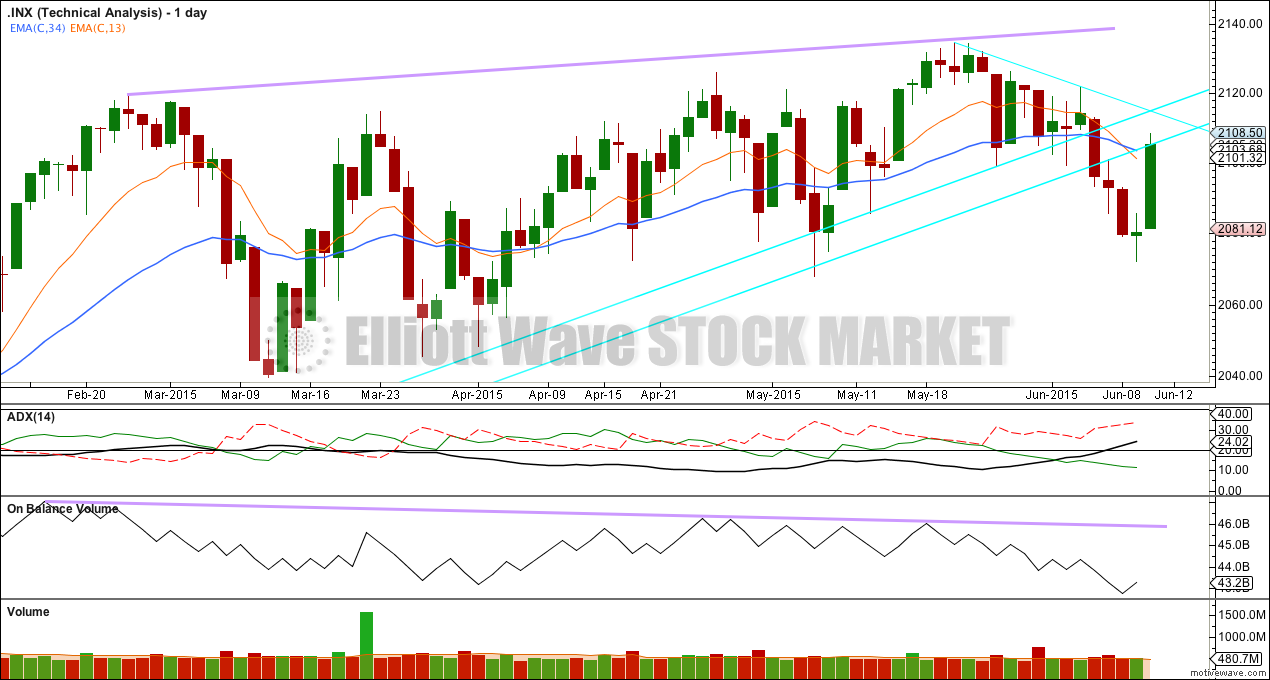
Click chart to enlarge.
ADX is rising and above 20. This indicates the potential start of a new trend. The direction would be down.
Only when this lower aqua blue trend line is breached by a close of 3% or more of market value would a bear market be indicated. That would require a close at 2,037 or below.
That trend line is long held (it began in November 2011), repeatedly tested and reasonably shallow so it is highly technically significant and should be respected. It remains the strongest piece of technical analysis on all charts.
On Balance Volume has turned strongly downwards. This fall in price is now supported by volume.
On Balance Volume is showing negative divergence with price back to February. The recent rise in price to new all time highs is not supported by volume and so is suspicious. This may indicate that when the bear market arrives it may be deeper and more long lasting than recent corrections.
The shorter EMA has crossed below the longer EMA providing some confidence in a bear market.
The upwards movement for Wednesday has found resistance about the lower aqua blue trend line. The next line of resistance, if price continues higher, would be the downwards sloping aqua blue line. If price breaks above that sloping line and above both of the double bull market trend lines, then new all time highs may be expected and a bear market would be in serious doubt. If price finds resistance here and turns down, then the next condition which must be satisfied for a bear market to be indicated is a close at 2,037 or below.
This analysis is published about 09:15 p.m. EST.
For Thursday action, spinning top in SPY, doji in DOW. I think we are going to see a down day tomorrow.
Hi Lara. In the bull count, the target you are considering is 2880 for Minor 5/ Intermediate 5/ Primary 3. While it gives Primary 3 as 2.618 times Primary 1, it results in a large Intermediate 5 at more than 2 times Intermediate 3. It also results in Minor 5 being about 3.618 times of Minor 3. Are these values extreme? What about settling for a more modest Primary 3 being 1.618 times of Primary 1?
Primary 3 would be 1.618 the length of primary wave 1 at 2,191. I don’t think that allows enough room for the structure of minor wave 5 to complete, if only it’s first and second waves have just ended.
That’s why I have used the next Fibonacci ratio in the sequence, 2.618.
I agree, it’s very bullish. While DJT and Nasdaq haven’t confirmed the continuation of the bull market I’m uncertain about that target, but calculate it I must.
I agree that those targets make for very unusual time and distance relationships among the sub-waves. This bull market is now seven years old, and while it seem interminable, there are many seasonal and cyclical forces at work that suggest a top should be near or has already occurred. The odds of the SPY going past 2300 (based on the break from the triple top in 2013) without at least a very substantial correction, are in my opinion not very high…many other factors suggest we are going to see far more than a substantial correction.
I know the bearish nest of 1’s and 2’s has never panned out, but I think that’s how I would label the hourly bull alternate. However, I would label minute 2 at 2122 as a rare triple ZZ and subminuette i at 2072. It doesn’t have the right look IMO as it’s labeled now. Don’t know if it pans out, but just my thoughts.
But then minute wave iv would be well in minute wave i price territory. It doesn’t work.
Also, triple zigzags don’t look like that. They should have a clear slope, not a sideways move. The second and third zigzags in the double and triple exist to deepen the correction because the first and second don’t move price deep enough.
My apologies I meant to say triple combination ending at 2122. It looks like a clear 5 waves down from 2122 and that’s why I suggested labeling subminutette i at 2072. However, today’s action does not look like the beginning of a third wave down unless the we are down -25 tomorrow.
The lower aqua blue trend line will tell the tale I think. The swift move back up to test the underside is classic when such a critical long term support line is broken. If not convincingly retaken in the next day or two, 2880 in SPY may quite some time away…
Yes, I agree. What happens tomorrow is critical.
If that lower line doesn’t provide resistance here then a new high above 2,112.86 would provide a lot of clarification at this stage.