
Further downwards movement fits the alternate Elliott wave count better than the main Elliott wave count, but price has not yet confirmed one and invalidated the other.
Summary: The main wave count has again further reduced in probability, but the alternate still requires confirmation. This is a big trend change, even for the bull wave count, and for the bear wave count the big trend change calls for a huge market crash. I will assume the trend remains the same until proven otherwise, and will continue to present all information to members to make their own judgements and act accordingly.
To see a weekly chart and how to draw trend lines go here.
Changes to last analysis are italicised.
Bull Wave Count
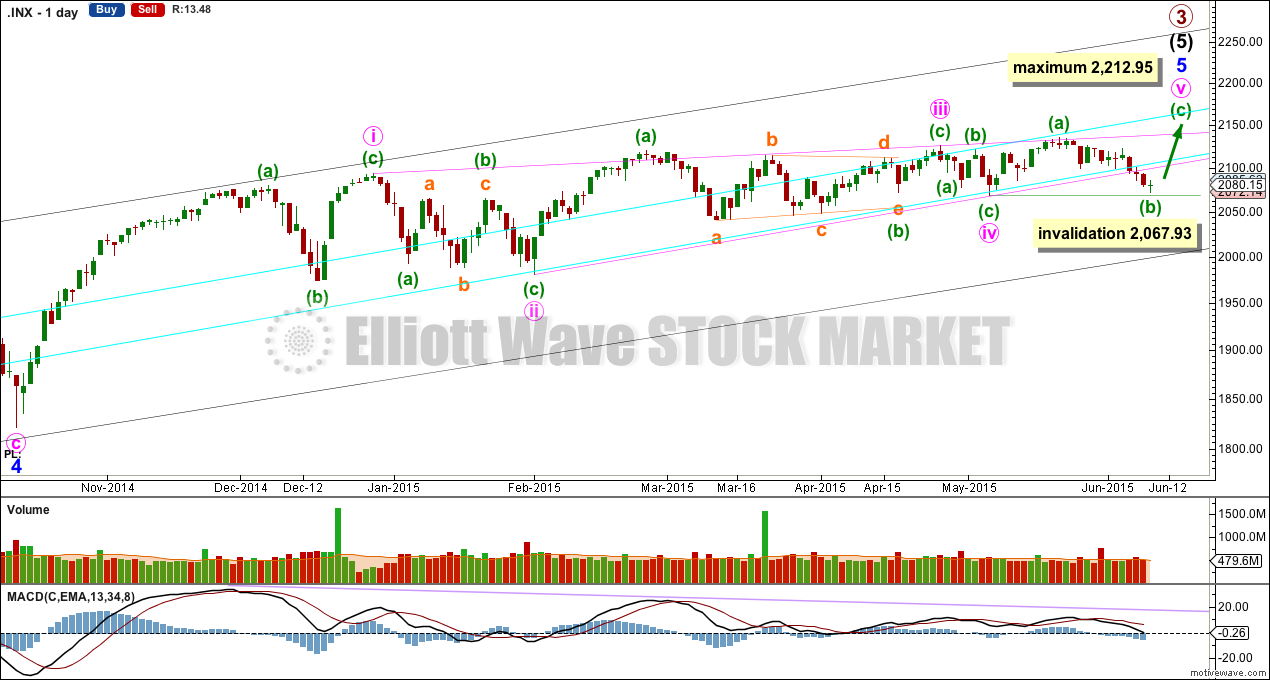
Click chart to enlarge.
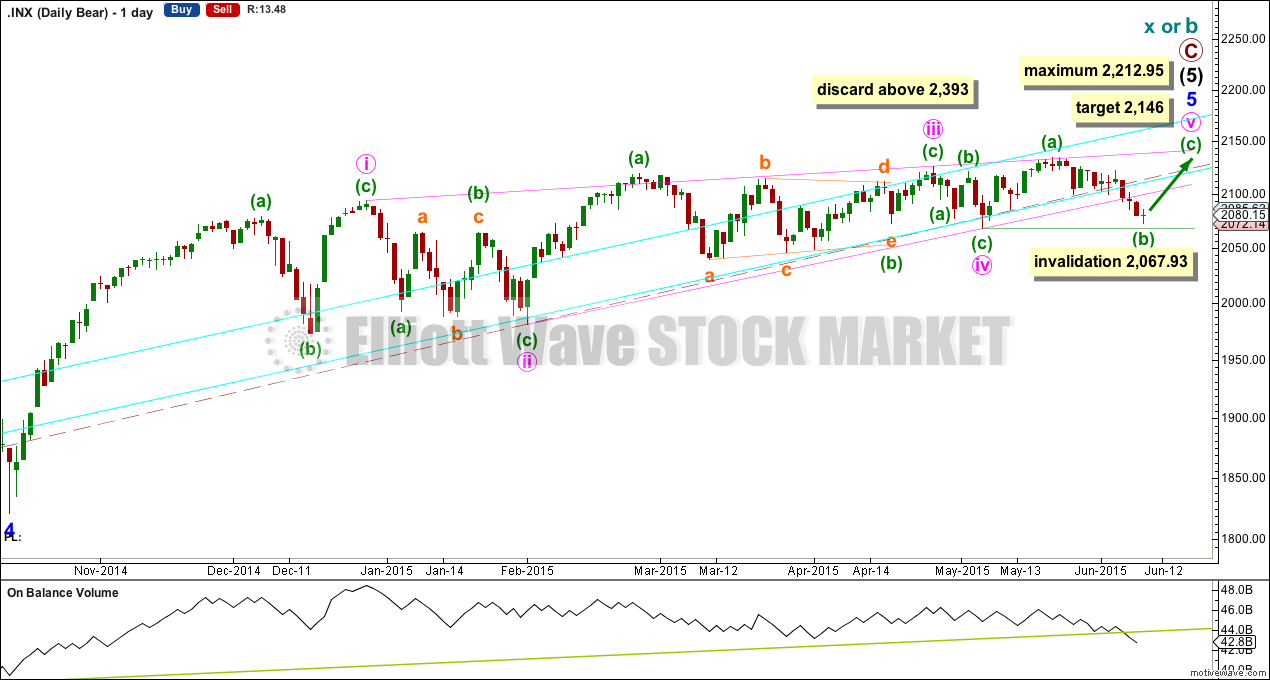
The bull wave count sees primary 1-2-3 within an impulse for a cycle degree wave V.
The bear wave count sees primary A-B-C zigzag for a cycle degree B wave.
The diagonal of minor wave 5 is contracting so minute wave v must be shorter than minute wave iii. Minute wave iii may not be the shortest wave. At 2,212.95 minute wave v would reach its maximum length at equality with minute wave iii.
Contracting diagonals most often end with a reasonably strong overshoot of the 1-3 trend line.
The diagonal trend lines are converging, and they are getting to be quite close together. This structure must end before the diagonal trend lines cross over which would be on 3rd August.
Minuette wave (b) may not move beyond the start of minuette wave (a) below 2,067.93.
Diagonals normally adhere well to their trend lines. This one has small overshoots and one small breach at minuette wave (a) within minute wave iii. The clear and strong two candlestick breach of the lower ii-iv diagonal trend line has substantially reduced the probability of this wave count, and the wave count now does not have the right look. Only a new low below 2,067.93 would see this wave count discarded.
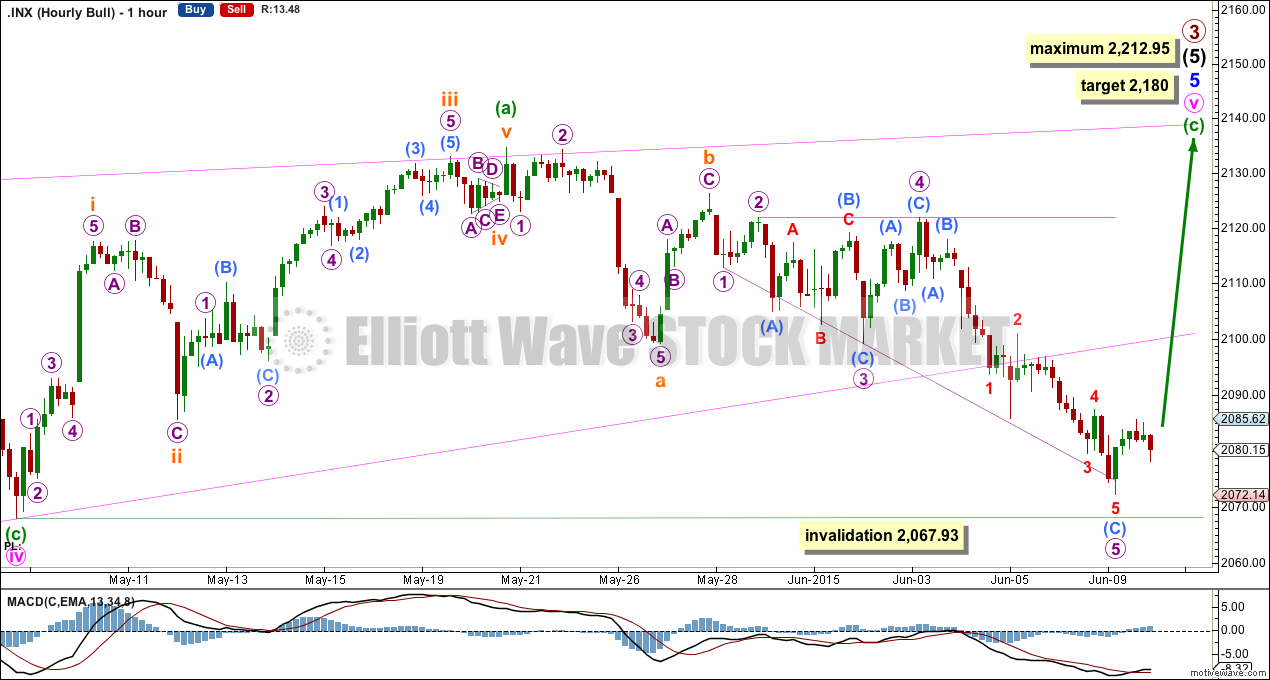
Click chart to enlarge.
Minuette wave (b) should not have breached the lower ii-iv diagonal trend line. This is the first wave count, only because I will assume that the trend remains the same until proven otherwise.
At 2,180 minuette wave (c) would reach 1.618 the length of minuette wave (a). This target would see the upper i-iii diagonal trend line overshot.
I no longer have confidence in this wave count. It does not have the right look. But the alternate below is still unconfirmed.
Alternate Bull Wave Count
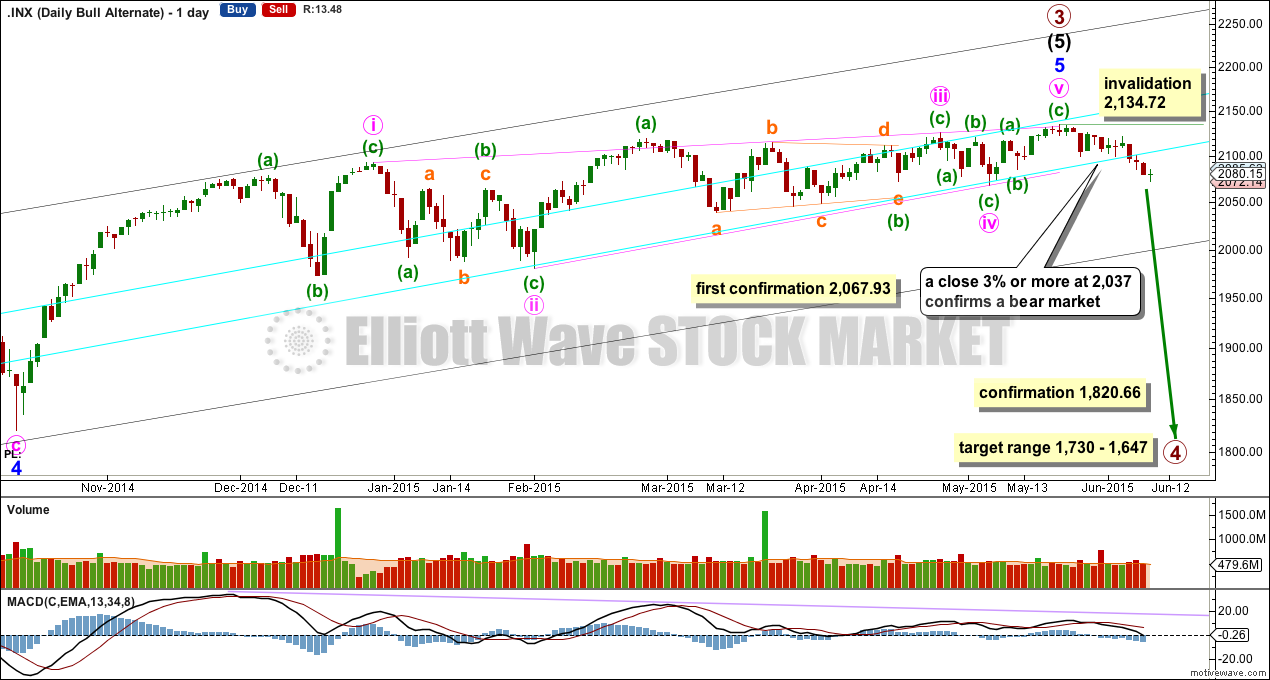
Click chart to enlarge.
It is possible that the S&P has seen a primary degree (or for the bear count below a cycle degree) trend change thirteen days ago.
This wave count absolutely requires confirmation at the daily chart level before any confidence may be had in a primary (or cycle) degree trend change. Confirmation would come with:
1. A new low below 2,067.93.
2. A clear five down on the hourly chart.
3. A close of 3% or more of market value below the lower aqua blue trend line. If the line was breached at 2,100 then this rule needs a daily close at 2,037 or below.
4. A clear five down on the daily chart.
5. A new low below 1,820.66.
As each condition is met the probability of a substantial trend change would increase.
Primary wave 4 would most likely be a time consuming flat, triangle or combination in order to exhibit structural alternation with the zigzag of primary wave 2. Primary wave 2 lasted 12 weeks. Primary wave 4 is likely to be longer in duration because combinations and triangles particularly are more time consuming than zigzags which tend to be quick corrections. Primary wave 4 may be expected to last more than 12 weeks, and may end with a total Fibonacci 13 or more likely 21 weeks.
For this more bearish wave count to be taken seriously it still requires confirmation at least below 2,067.93.
At this stage, a trend change is looking more likely so I’ll list points in its favour:
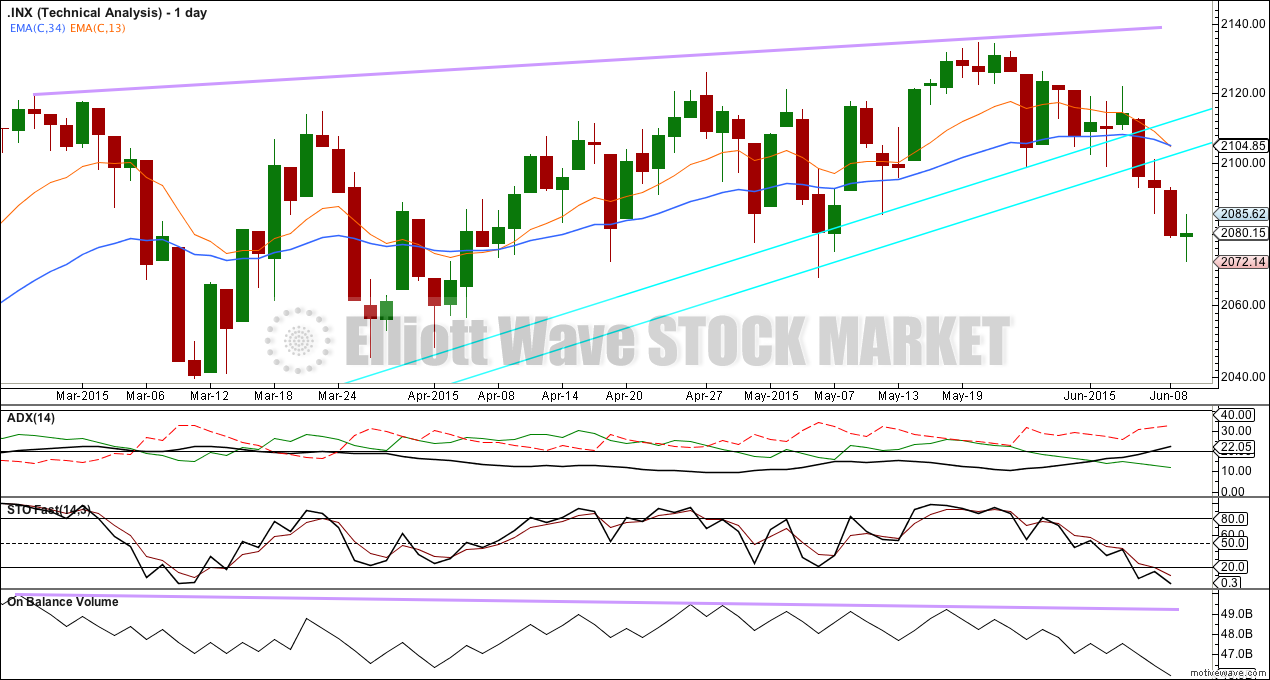
1. ADX is rising and above 20, and the -DX line is above the +DX line indicating a new downwards trend.
2. The long held bull market trend line, the strongest piece of technical analysis on ALL charts, is again now breached. But the breach needs to be by a close of 3% or more of market value to be using that trend line correctly.
3. There is quadruple negative divergence between price and MACD on the weekly chart.
4. There is double negative divergence between price and MACD on the daily chart.
5. There is persistent and strong negative divergence between price and RSI on the monthly chart. The last time this happened was October 2007 and we all know what happened after that…
6. A long held bull trend line on On Balance Volume going back to October 2014 has been breached and is no longer providing support.
7. Using Dow Theory, DJT and Nasdaq recently failed to confirm a continuation of the bull market. This does not indicate a bear market and just indicates caution.
While a bear market is unconfirmed I uncomfortably sit on the fence.
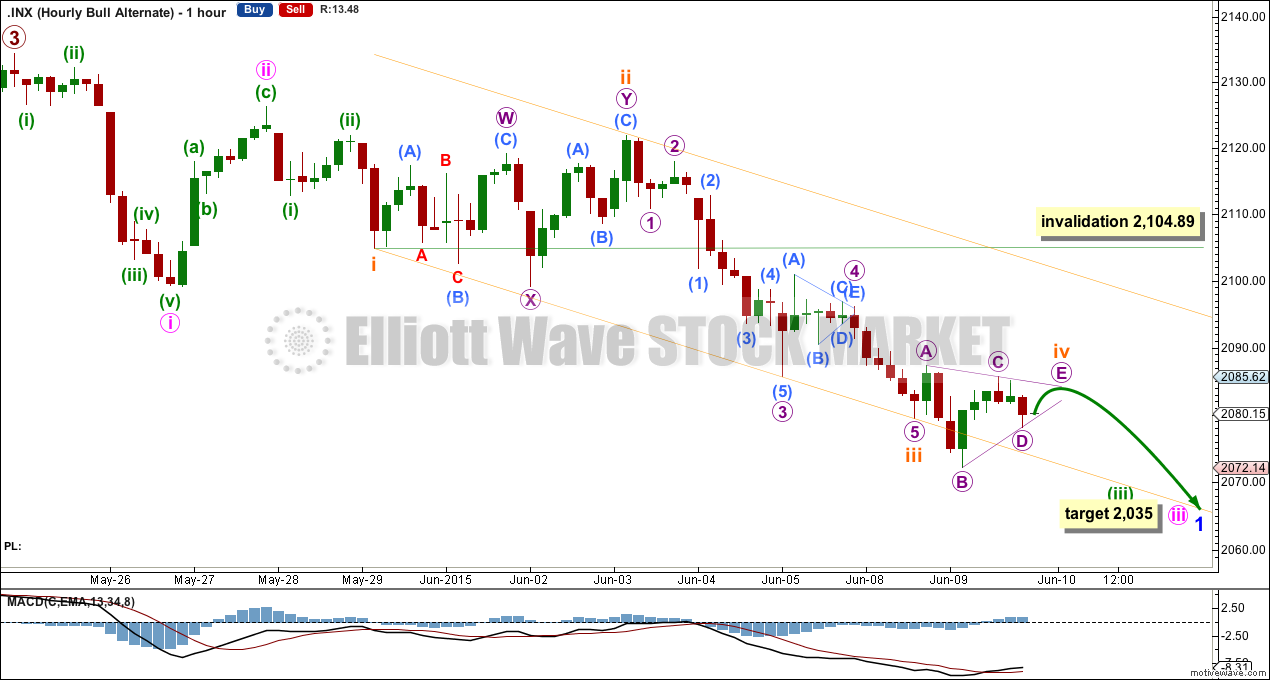
Click chart to enlarge.
Downwards momentum slightly increased. This now fits as a third wave.
At 2,035 now minute wave iii would reach 2.618 the length of minute wave i. The target is changed because the prior higher target did not allow enough room for the structure to unfold.
Within minute wave iii, minuette wave (iii) is still incomplete.
Within minuette wave (iii), subminuette wave iv is most likely incomplete. Subminuette wave ii lasted 21 hours and was a deep 99.8% combination. Given the guideline of alternation subminuette wave iv may be expected to be more shallow. It is more likely it may be unfolding as a triangle requiring only the final wave of micro wave E to complete it. Micro wave E may not move beyond the end of micro wave C above 2,085.62. If this price point is passed then subminuette wave iv would more likely be a flat correction.
Subminuette wave iv may not move into subminuette wave i price territory above 2,104.89.
If the structure of subminuette wave iv as a running contracting triangle is labelled correctly, then it may end quickly tomorrow and be followed by more downwards movement.
Bear Wave Count
Click chart to enlarge.
The subdivisions within primary waves A-B-C are seen in absolutely exactly the same way as primary waves 1-2-3 for the bull wave count.
To see the difference at the monthly chart level between the bull and bear ideas look at the last historical analysis here.
At cycle degree wave b is over the maximum common length of 138% the length of cycle wave a, at 170% the length of cycle wave a. At 2,393 cycle wave b would be twice the length of cycle wave a and at that point this bear wave count should be discarded.
While we have no confirmation of this wave count we should assume the trend remains the same, upwards. This wave count requires confirmation before I have confidence in it. Full and final confirmation that the market is crashing would only come with a new low below 1,370.58. However, structure and momentum should tell us long before that point which wave count is correct, bull or bear.
On Balance Volume has very now clearly breached a trend line which began back in October 2014. This may be an early warning of more downwards movement to come.
Technical Analysis
Click chart to enlarge.
ADX is rising and above 20. This indicates the potential start of a new trend. The direction would be down.
Only when this lower aqua blue trend line is breached by a close of 3% or more of market value would a bear market be indicated. That would require a close at 2,037 or below.
That trend line is long held (it began in November 2011), repeatedly tested and reasonably shallow so it is highly technically significant and should be respected. It remains the strongest piece of technical analysis on all charts.
On Balance Volume has turned strongly downwards. This fall in price is now supported by volume and is no longer suspicious.
On Balance Volume is showing negative divergence with price back to February. The recent rise in price to new all time highs is not supported by volume and so is suspicious. This may indicate that when the bear market arrives it may be deeper and more long lasting than recent corrections.
The shorter EMA needs to cross below the longer EMA to provide further confidence in a bear market. This condition is not yet quite met.
This analysis is published about 10:07 p.m. EST.
I think you mentioned a doji in the video…ie at the daily chart level.
Even if we have had a trend change (and if so is this supported by breaks of the applicable trendlines on the DJIA /Wilshere/Russell/ Nasdaq etc.).? then doesnt the doji indicate at least a small bull move ; e.g. a backtest at least of the aqua trendline ? I.e. a shortterm oversold position.
While indicators may show a COT that doesnt mean we arent due a short term bounce first… Even though the long preffered bull move of “one final high” may not pan out.
Imo it all depends on what happens on the backtest.
Sometimes doji’s turn up as small fourth wave corrections and are followed by fifth waves down. Seeing a doji does not necessarily expect a trend change or even a reaction against the trend short term.
To see what I mean there’s a perfect example within minute wave ii on the daily chart. Look at the wave down labelled minuettte wave (a). There’s a doji for the third candlestick. It was followed by another two strong down days.
As for a trend change being supported by breaks of trend lines: I don’t have enough data on my feed for DJIA to tell (which is pretty much why I’m not providing analysis of that market anymore, my data through yahoo no longer is there), but DJT has a clear break more than 3% below it’s bull market trend line, Nasdaq does not, price hasn’t even touched it’s trend line (see my Nasdaq analysis for that one). I’m not looking at Russell or Wiltshire, I consider for Dow Theory that using S&P500, DJIA, DJT and Nasdaq is enough. Nasdaq is probably the best modern day equivalent of the old transportation index.
Thx Lara, but isn’t minuette ii lasting 5 hours a big problem compared to subminuette ii lasting 21 hours? We did get a stock market buy signal in the VIX today. The other 2 in 2015 both produced decent rallies. I think we backtest 50 dma @ 2100 and we should turn lower from there if a bearish count is in play.
Yes, it is. And yes, that’s a concern.
But even if I relabel it (as I’m doing today) to see minuette wave (ii) ending where I have subminuette wave ii on the hourly alternate chart, now there is a problem of disproportion still.
Minute wave ii lasted 8 hours. Now minuette wave (ii) one degree lower is much longer in duration, it would last 28 hours.
But the S&P just does not always have nice proportions. Sometimes it’s threes look like fives and vice versa. So I have to consider all possibilities.
Sometimes it has clear fives or threes, but not always.