
Sideways movement was exactly what was expected for Wednesday’s session. The Elliott wave count remains the same.
Summary: Sideways movement should continue tomorrow to complete a triangle, with a small downwards movement to most likely fall short of the lower a-c triangle trend line. When that is done, then one final upwards wave should begin to new all time highs. I can calculate a target for the last wave up for you when the triangle is complete.
To see a weekly chart and how to draw trend lines go here.
Changes to last analysis are italicised.
Bull Wave Count
Click chart to enlarge.
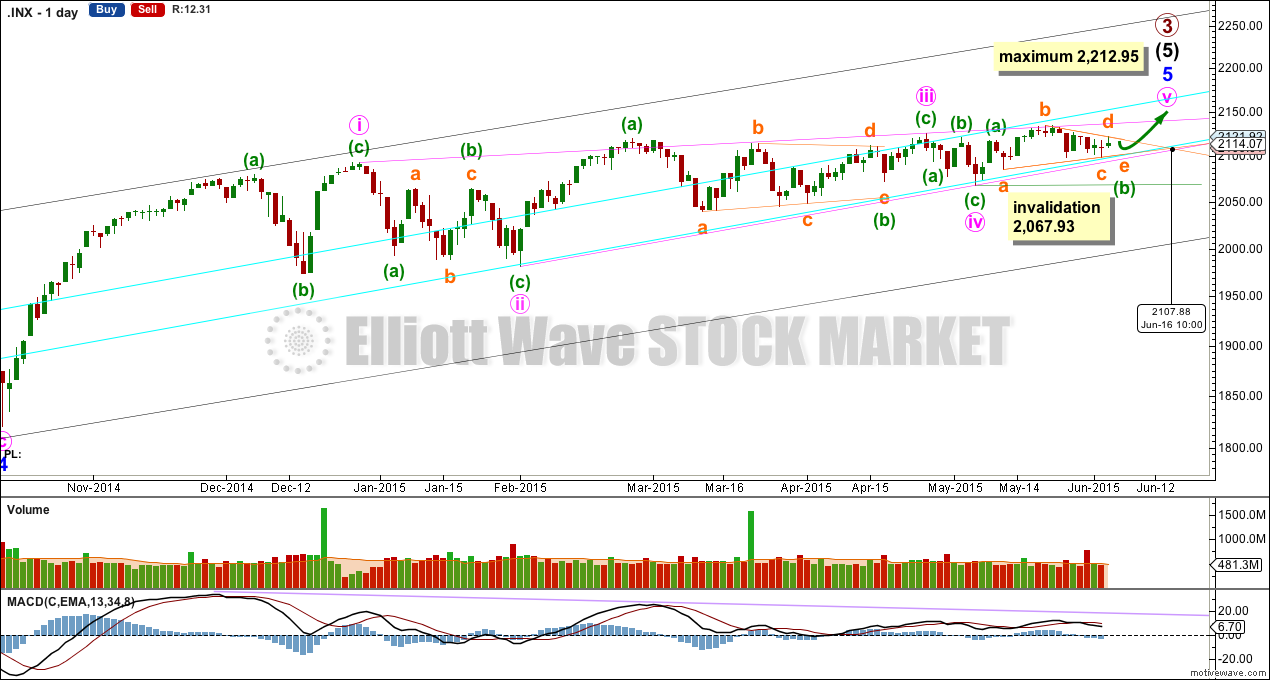
The bull wave count sees primary 1-2-3 within an impulse for a cycle degree wave V.
The bear wave count sees primary A-B-C zigzag for a cycle degree B wave.
Recent sideways movement fits nicely still as a triangle, and the triangle must be incomplete. When minuette wave (b) may again be complete then a new target for minuette wave (c) up will be calculated. It may be expected to be equal in length with minuette wave (a) at 49.73 points.
The diagonal of minor wave 5 is contracting so minute wave v must be shorter than minute wave iii. Minute wave iii may not be the shortest wave. At 2,212.95 minute wave v would reach its maximum length at equality with minute wave iii.
Contracting diagonals most often end with a reasonably strong overshoot of the 1-3 trend line. The target would see this.
The diagonal trend lines are converging, and they are getting to be quite close together. This structure must end before the diagonal trend lines cross over which would be on 3rd August.
Sometimes a trend change is seen at the point in time where triangle trend lines cross. If the ends of sub waves a, b, c and d remain as labelled, then the triangle trend lines will cross over on 16th June. Primary wave 3 may end then, and this would see it end before the diagonal trend lines cross over.
Minuette wave (b) may not move beyond the start of minuette wave (a) below 2,067.93.
Click chart to enlarge.
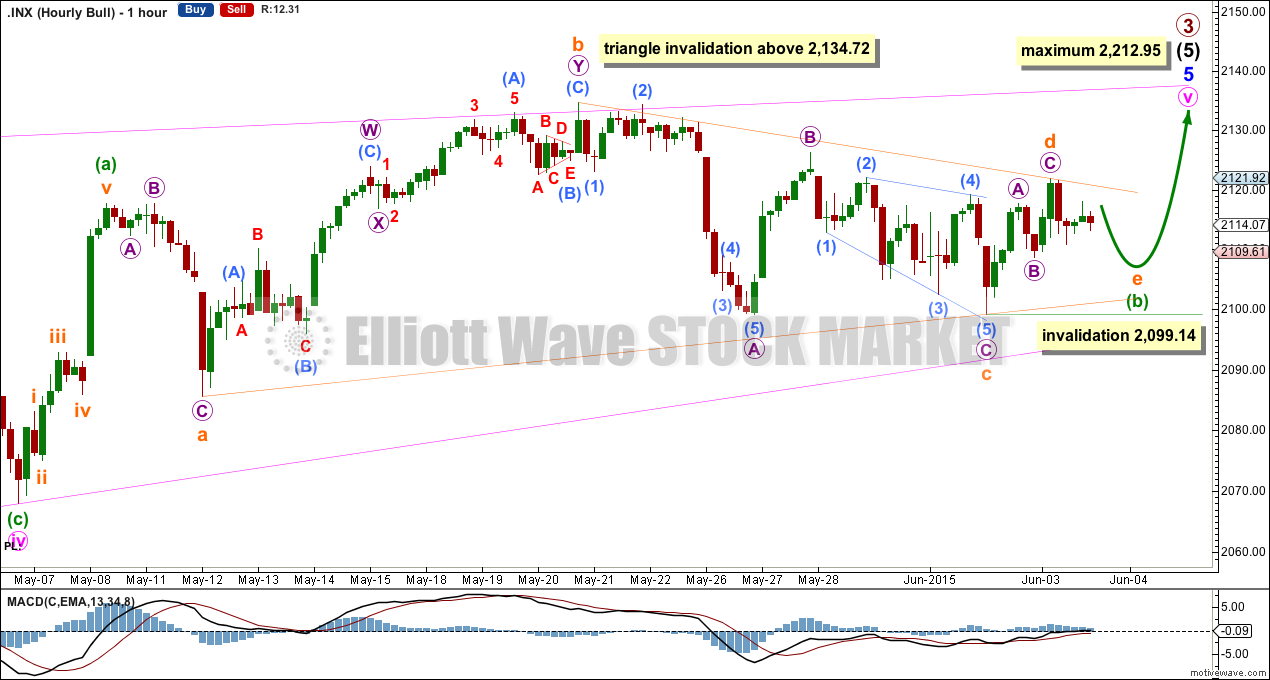
The hourly chart shows all of minute wave v zigzag.
Minuette wave (b) is still an incomplete running contracting triangle. Within a contracting triangle, subminuette wave c may not move beyond the end of subminuette wave a below 2,085.57, subminuette wave d may not move beyond the end of subminuette wave b above 2,134.72 and subminuette wave e may not move beyond the end of subminuette wave c below 2,099.14.
It is now quite likely that subminuette wave d ended on Wednesday. Subminuette wave e may take one to three days to unfold, and is possible that it could itself be a triangle so that minuette wave (b) is a very time consuming nine wave triangle.
Subminuette wave d may continue higher, but today this looks less likely. It is still possible that minuette wave (b) may complete as a barrier triangle. For a barrier triangle, subminuette wave d should end about the same level as subminuette wave b at 2,134.72 so that the b-d trend line of the triangle is essentially flat. In practice, this means that subminuette wave d may end slightly above 2,134.72 and so this upper price point to invalidate the triangle is not black and white. This is the only Elliott wave rule which has any grey area. If price rises to slightly above 2,134.72, then it would be the structure of upwards movement which may indicate if the triangle is over or not; if it is a clear three, then it’s probably subminuette wave d of a barrier triangle.
Both contracting and barrier triangles most commonly end with an e wave which undershoots the a-c trend line. That is what should be expected for tomorrow.
When minuette wave (b) is a complete triangle, then a five wave structure to new all time highs should unfold upwards for minuette wave (c) which is most likely to be about even in length with minuette wave (a) at 49.73 points, and most likely to comfortably overshoot the upper pink i-iii trend line of the diagonal.
Alternate Bull Wave Count
Click chart to enlarge.
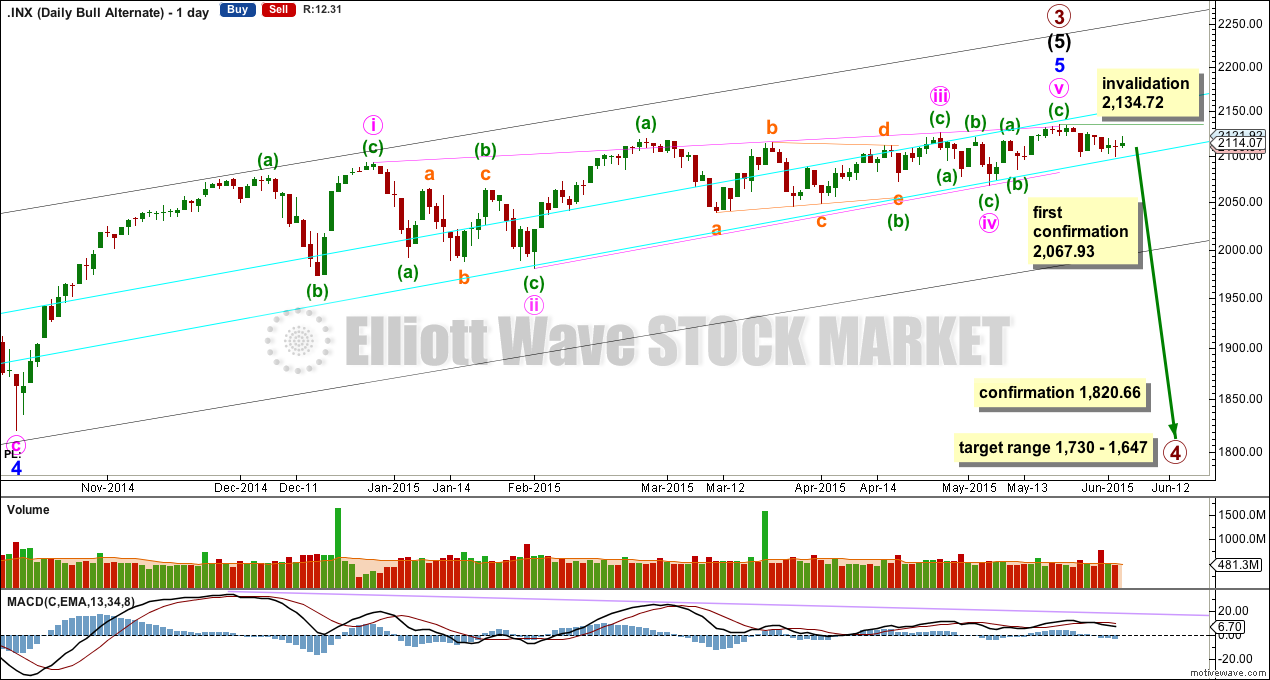
It is possible that the S&P has seen a primary degree (or for the bear count below a cycle degree) trend change nine days ago.
This wave count absolutely requires confirmation at the daily chart level before any confidence may be had in a primary (or cycle) degree trend change. Confirmation would come with:
1. A close of 3% or more of market value below the lower aqua blue trend line.
2. A clear five down on the daily chart.
3. A new low below 1,820.66.
As each condition is met the probability of a substantial trend change would increase.
Primary wave 4 would most likely be a time consuming flat, triangle or combination in order to exhibit structural alternation with the zigzag of primary wave 2. Primary wave 2 lasted 12 weeks. Primary wave 4 is likely to be longer in duration because combinations and triangles particularly are more time consuming than zigzags which tend to be quick corrections. Primary wave 4 may be expected to last more than 12 weeks, and may end with a total Fibonacci 13 or more likely 21 weeks.
Despite ADX indicating the early stages of a new downwards trend, this sideways choppy movement is not convincing as the start of a new bear market.
Bear Wave Count
Click chart to enlarge.
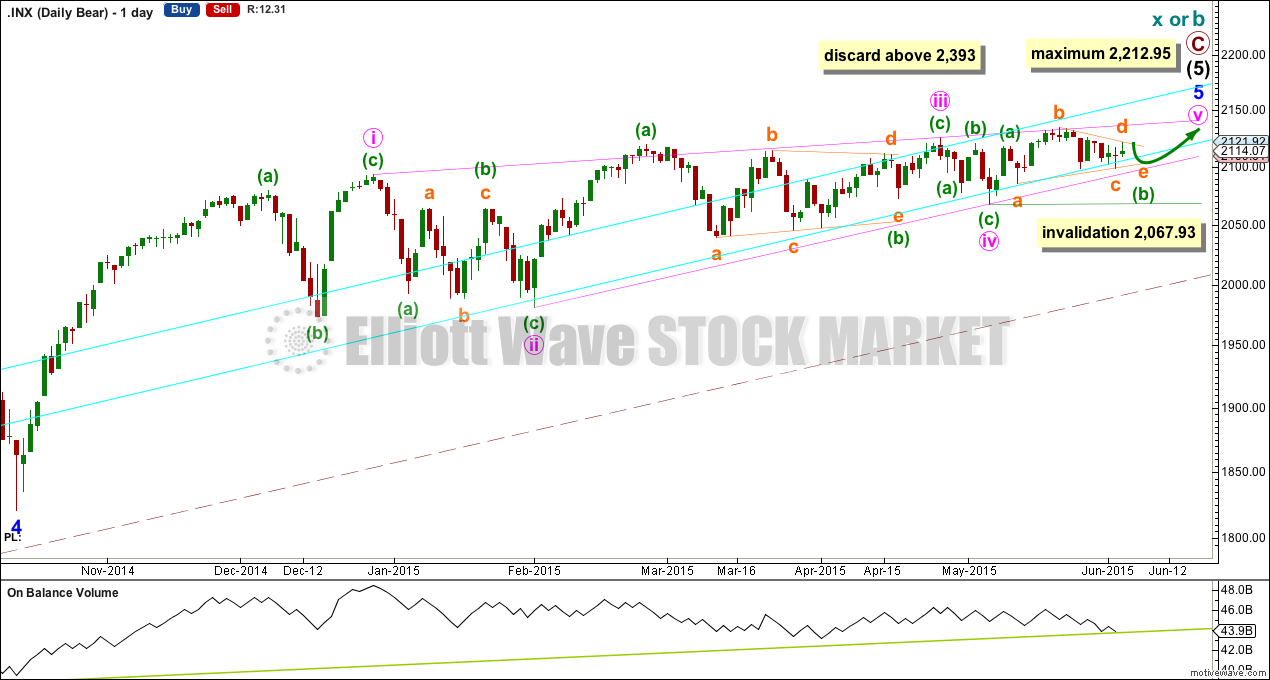
The subdivisions within primary waves A-B-C are seen in absolutely exactly the same way as primary waves 1-2-3 for the bull wave count.
To see the difference at the monthly chart level between the bull and bear ideas look at the last historical analysis here.
At cycle degree wave b is over the maximum common length of 138% the length of cycle wave a, at 170% the length of cycle wave a. At 2,393 cycle wave b would be twice the length of cycle wave a and at that point this bear wave count should be discarded.
While we have no confirmation of this wave count we should assume the trend remains the same, upwards. This wave count requires confirmation before I have confidence in it. Full and final confirmation that the market is crashing would only come with a new low below 1,370.58. However, structure and momentum should tell us long before that point which wave count is correct, bull or bear.
On Balance Volume has very slightly breached a trend line which began back in October 2014. This may be an early warning of more downwards movement to come.
Technical Analysis
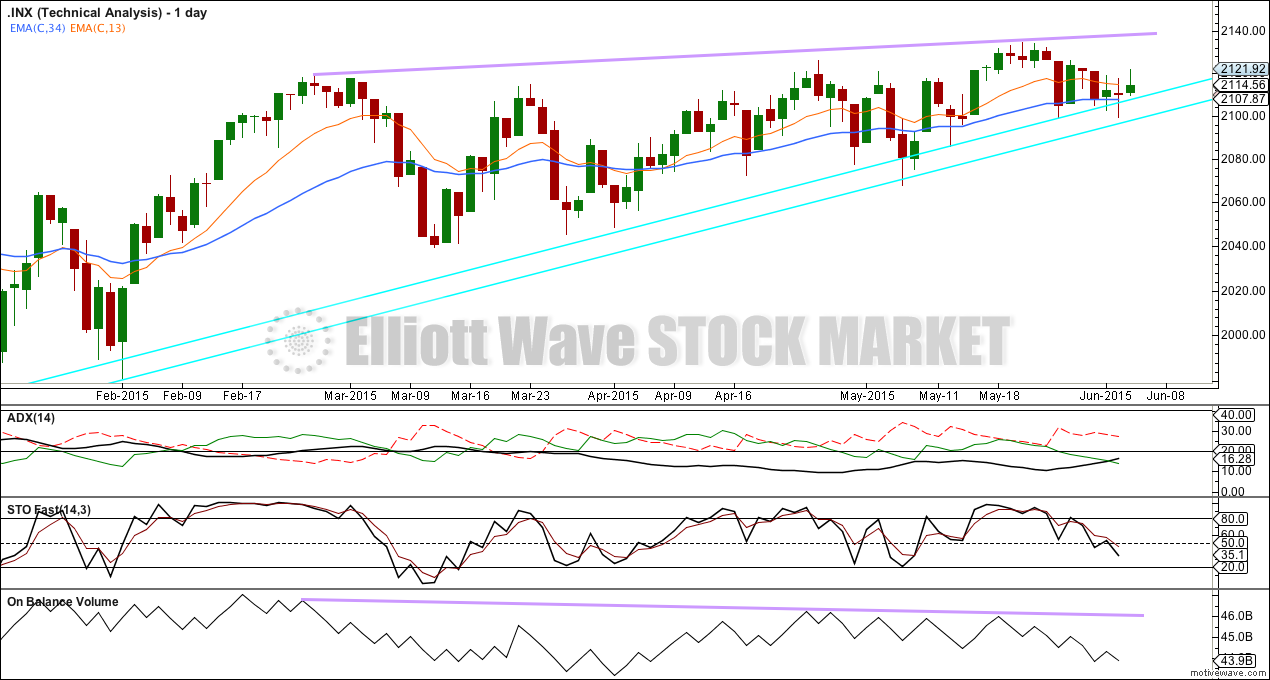
Click chart to enlarge.
ADX continues to rise and is above 15. This would be an indicator of the early stages of a new trend. With the -DX line above the +DX line the new trend should be down.
However, while price remains above the long held bull market aqua blue trend line a bear market is not indicated. Of all the technical analysis indicators that trend line should be respected the most strongly. It is relatively shallow, long held and repeatedly tested since November 2011. It is highly technically significant.
The continued divergence with price and On Balance Volume shows that this rise in price is not supported by volume. A price rise unsupported by volume is suspicious. This may be an indicator of a larger correction to come soon.
This analysis is published about 07:56 p.m. EST.
Wow! China down over 5% intraday, only to close up slightly. US indices also climbing from triple digit declines. The central bankers are being kept busy indeed!