
The short term target for downwards movement at 2,103 was met and exceeded slightly by 3.73 points.
Summary: A small fourth wave correction is incomplete; sideways movement may complete a small green candlestick or doji for tomorrow. The fourth wave may end about 2,107. This should be followed by more downwards movement.
Changes to last analysis are italicised.
To see a weekly chart and how to draw trend lines go here.
Bull Wave Count
Click chart to enlarge.
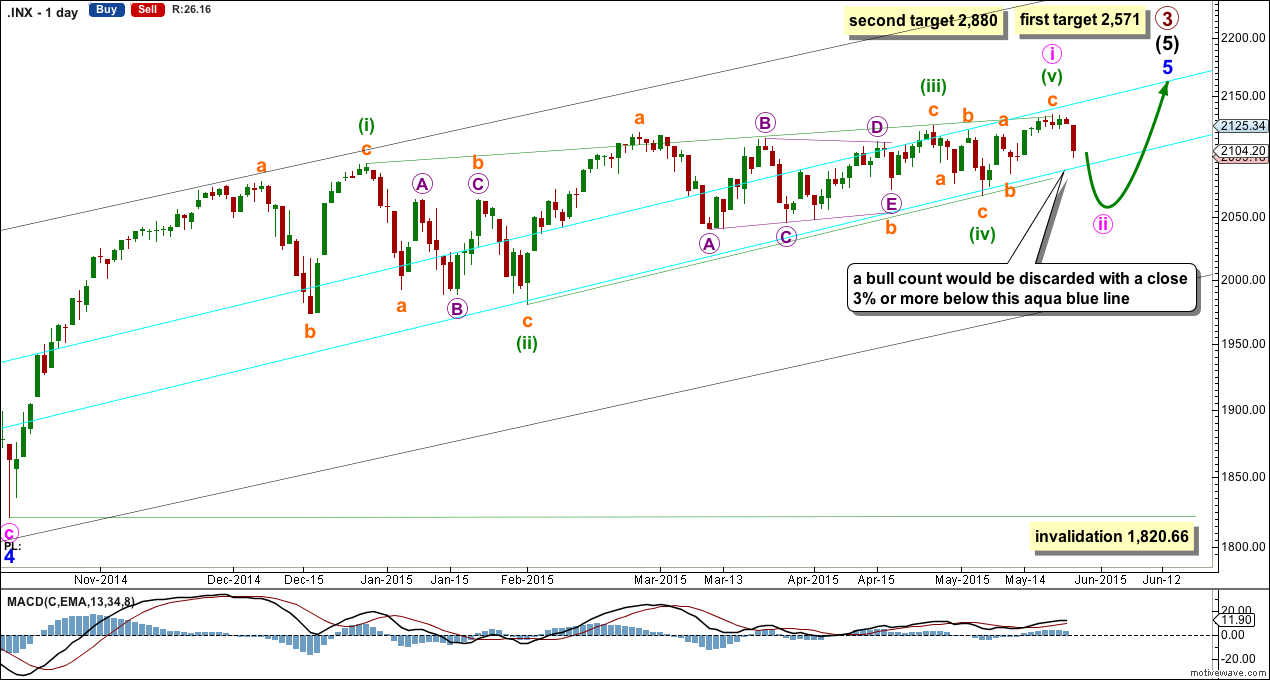
The bull wave count sees primary 1-2-3 within an impulse for a cycle degree wave V.
The bear wave count sees primary A-B-C zigzag for a cycle degree B wave.
We should always assume the trend remains the same until proven otherwise. I will have the main wave count relatively bullish while price remains above the lower aqua blue trend line which has provided support for this bull market since 2011. Only when that trend line is breached by a close of 3% or more of market value will I have my main wave count bearish.
The complete contracting diagonal may have been only minute wave i as a leading diagonal within minor wave 5.
At 2,571 intermediate wave (5) would reach 1.618 the length of intermediate wave (3). If upwards movement keeps going past this first target, or when price gets there the structure is incomplete, then the second target would be used.
At 2,880 primary wave 3 would reach 2.618 the length of primary wave 1.
There is now a complete contracting diagonal structure, although the final fifth wave has only slightly overshot the (i)-(iii) trend line. There is now first confirmation of a trend change at least at a small degree on the hourly chart. Normally a second wave correction following a first wave leading diagonal is very deep. In this case it may be expected to be shallow due to strong support offered by the lower aqua blue trend line. An overshoot of this line is allowed for (like that seen for the end of minor wave 4 at the left on the daily chart) as long as price does not close 3% or more below the line.
For both main and alternate bull wave counts some downwards movement is now expected. For this main bull count it may be a low degree second wave for minute wave ii, which should not breach the lower aqua blue trend line by a close of 3% or more of market value.
Minute wave ii may not move beyond the start of minute wave i below 1,820.66. While this price point would provide final price invalidation of this bull wave count, it would be discarded before this point is passed when the aqua blue trend line is breached.
Click chart to enlarge.
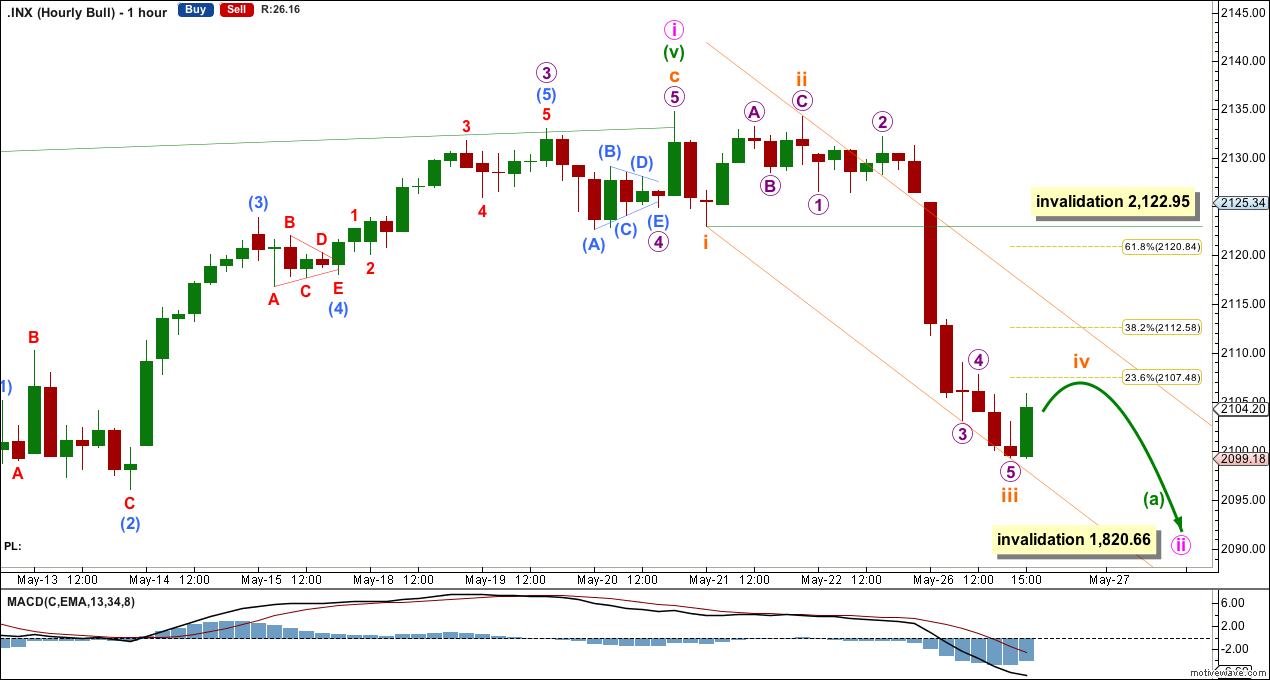
Subminuette wave iv is most likely incomplete. It is very unlikely to be over in just one hour.
Subminuette wave ii was a very deep 0.96 zigzag lasting 6 hours and showing up on the daily chart as one small green candlestick. Subminuette wave iv is likely to also show up on the daily chart as at least one green candlestick or doji in order for this five wave structure down to have a typical five wave look on the daily chart.
Subminuette wave iv is likely to exhibit alternation with submineutte wave ii in structure and / or depth. It is very likely to be shallow, reaching up to only the 0.236 Fibonacci ratio about 2,107 or at most the 0.382 Fibonacci ratio about 2,113. It is most likely to be a sideways type of structure such as a flat, combination or triangle. If it is an expanded flat, running triangle or combination it may include a new low below 2,099.27. There is no lower invalidation point for subminuette wave iv for this reason.
Subminuette wave iv may not move into subminuette wave i price territory above 2,122.95.
When subminuette wave iv is complete then a target for subminuette wave v down may be calculated. This would complete a five wave impulse for minuette wave (a).
Alternate Bull Wave Count
Click chart to enlarge.
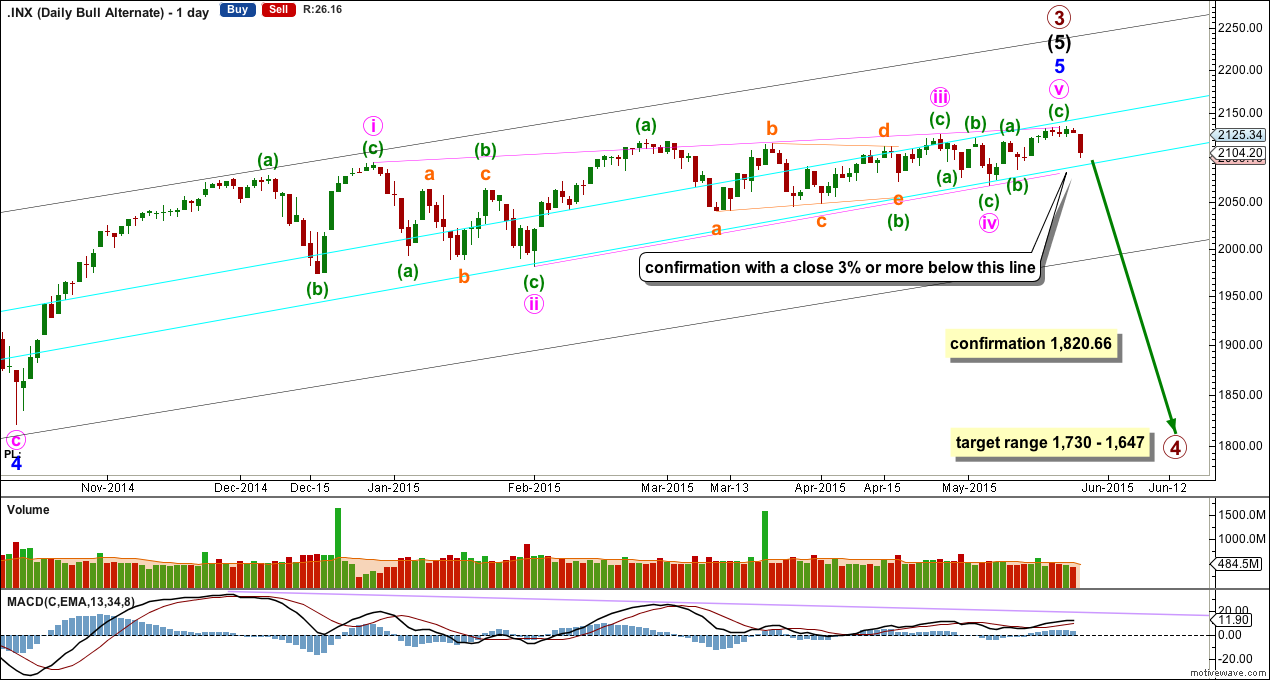
It is possible that the S&P has seen a primary degree (or for the bear count below a cycle degree) trend change four days ago. If not there, then another one or two days of a very little more upwards movement to overshoot the upper pink i-iii trend line would give this contracting diagonal a very typical look.
This alternate bull wave count simply moves the degree of labelling within the contracting diagonal all up one degree to see it as an ending diagonal for minor wave 5.
This wave count absolutely requires confirmation at the daily chart level before any confidence may be had in a primary (or cycle) degree trend change. Confirmation would come with:
1. A close of 3% or more of market value below the lower aqua blue trend line.
2. A clear five down on the daily chart.
3. A new low below 1,820.66.
As each condition is met the probability of a substantial trend change would increase.
Primary wave 4 would most likely be a time consuming flat, triangle or combination in order to exhibit structural alternation with the zigzag of primary wave 2. Primary wave 2 lasted 12 weeks. Primary wave 4 is likely to be longer in duration because combinations and triangles particularly are more time consuming than zigzags which tend to be quick corrections. Primary wave 4 may be expected to last more than 12 weeks, and may end with a total Fibonacci 13 or more likely 21 weeks.
Bear Wave Count
Click chart to enlarge.
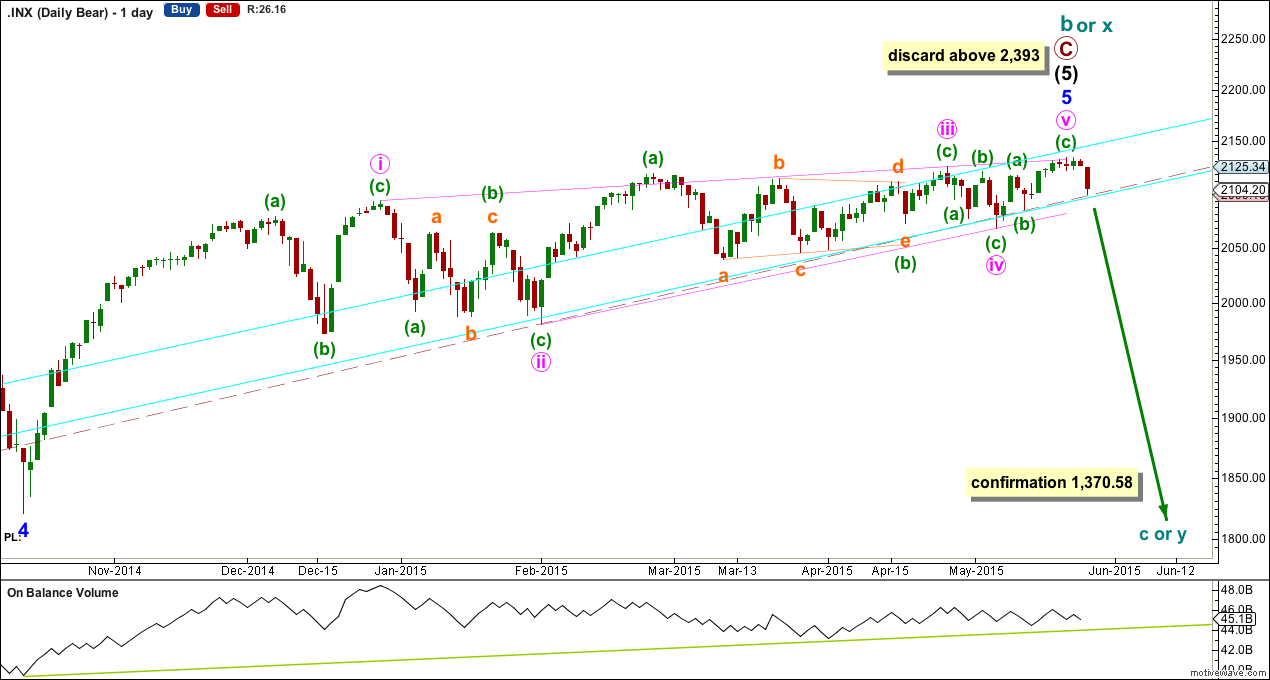
The subdivisions within primary waves A-B-C are seen in absolutely exactly the same way as primary waves 1-2-3 for the bull wave count.
To see the difference at the monthly chart level between the bull and bear ideas look at the last historical analysis here.
At cycle degree wave b is over the maximum common length of 138% the length of cycle wave a, at 170% the length of cycle wave a. At 2,393 cycle wave b would be twice the length of cycle wave a and at that point this bear wave count should be discarded.
While we have no confirmation of this wave count we should assume the trend remains the same, upwards. This wave count requires confirmation before I have confidence in it. Full and final confirmation that the market is crashing would only come with a new low below 1,370.58. However, structure and momentum should tell us long before that point which wave count is correct, bull or bear.
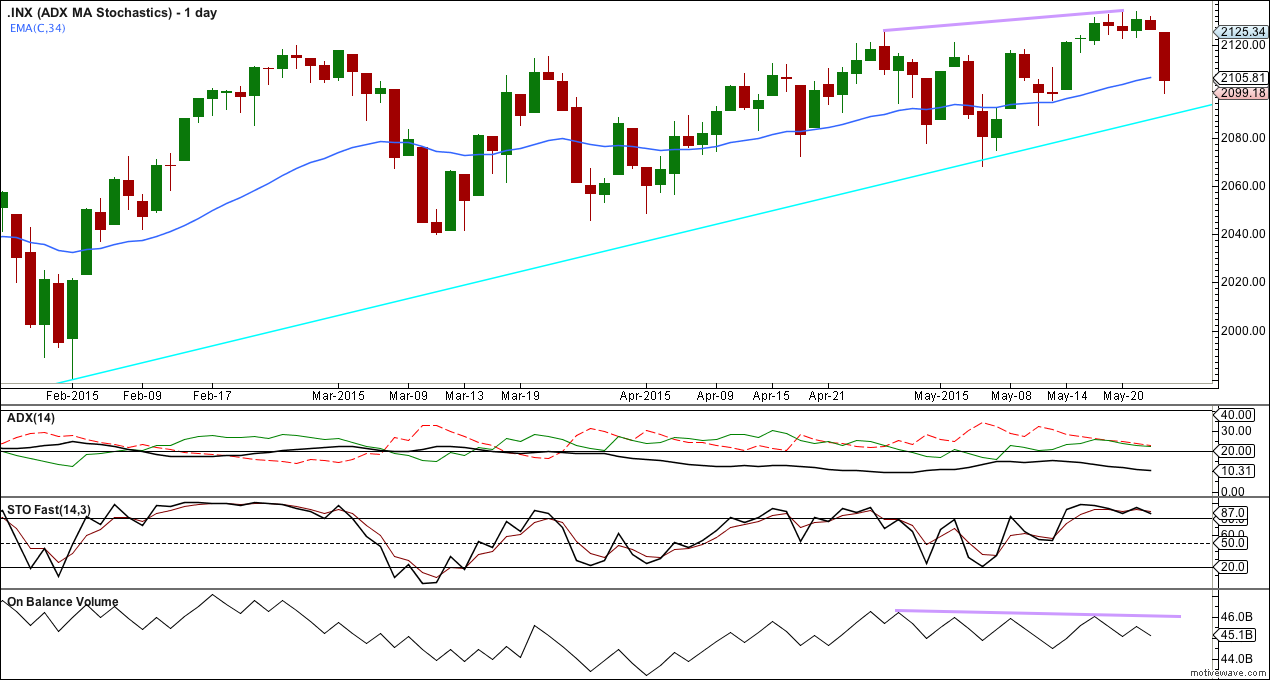
On Balance Volume should continue to find support at the trend lines drawn. When the longer held green trend line is broken by OBV a trend change would be supported.
Technical Analysis
Click chart to enlarge.
Data for Friday’s session shows ADX still below 15 and declining. This indicates as of Friday there was no clear trend for the S&P. Short swings and low volatility may be expected.
Stochastics may be returning from overbought towards normal. A downwards swing may be expected from this point, at least until Stochastics moves into oversold territory at or below 20.
At the last high price was trending up while On Balance Volume did not confirm. This may indicate a trend change at the last high, for at least some downwards movement.
DJIA saw new highs, confirmed by it’s On Balance Volume. DJT failed to confirm new highs, as has Nasdaq. DJT has made a new swing low below the low of 17th December, 2014. The next confirmation for DJT would be the low at 15th October, 2014.
If DJIA, DJT and Nasdaq make new swing lows below the lows made for October 2014, then I would look for the S&P 500 to also make new lows below its low of 1,820.66 on 15th October, 2014. If all four markets make new lows below those points, then using Dow theory a bear market would be confirmed.
This analysis is published about 08:33 p.m. EST.
Ending contracting diagonals usually do not look back when they conclude so today’s action in my opinion diminishes the bearish case substantially. Probably a b wave in progress followed by a relatively benign wave C down to stop at lower Aqua blue trend line. Central bankers still all in apparently…
Lara,
Did the gap in the hourly chart around 2126 – 2127 get filled today ?
I don’t think we are seeing a fourth wave correction -it is way too deep. Maybe we had a complete impulse down yesterday and today is a second wave up?
Yes………probably a second wave or (b) wave.
The fourth wave at subminuette degree was invalidated.
The subminuette second wave may have moved further as a double combination with a much briefer 4th wave.
It may be that a very big third wave down is about to un-fold ?
An excellent analysis shows the route as navigation in GPS. Thank you very much lara so that you have the force to continue this project. avner.